Hi,
right now I'm debugging a nasty bug which occurs every few days in our application with MSP430F519A. I finally captured the event with Code Composer Debugger, but I cannot come to a conclusion.
The controller still receives interrupts from timers and from externals (GPIOs), but hangs somewhere in the main loop, so i#m trying to find that line of code. When I halt the application, the debugger gives me: No source available for "0xe1f40"
The PC points to this (second row):
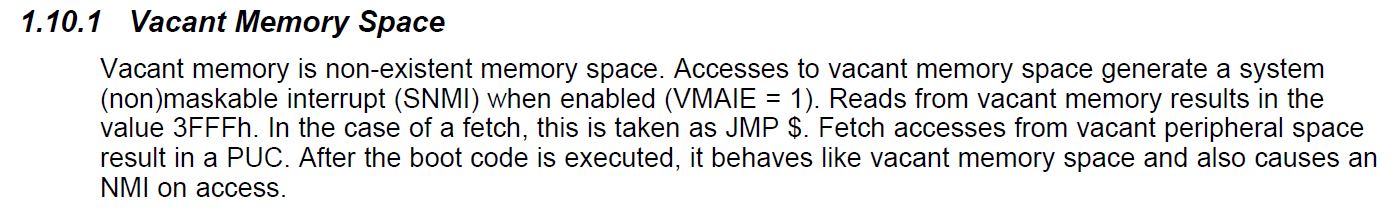
0e1f3e: 3FFF JMP (bMB_TX)
0e1f40: 3FFF JMP (scMB_FrameNOK)
0e1f42: 3FFF JMP (bDouble)
which seems like a SRAM area (the fields are variables in my application).
The question now is, how can i get further information where the application hangs? Can i use the stackpointer? I'm afraid I'm not that familiar with the MSP430 family, i just got this projekt from a former coworker...
Unfortunatley the debugger crashed by now, so i hope to catch that behaviour again.