This thread has been locked.

If you have a related question, please click the "Ask a related question" button in the top right corner. The newly created question will be automatically linked to this question.

IAR IDE question - a'Debugger Window"


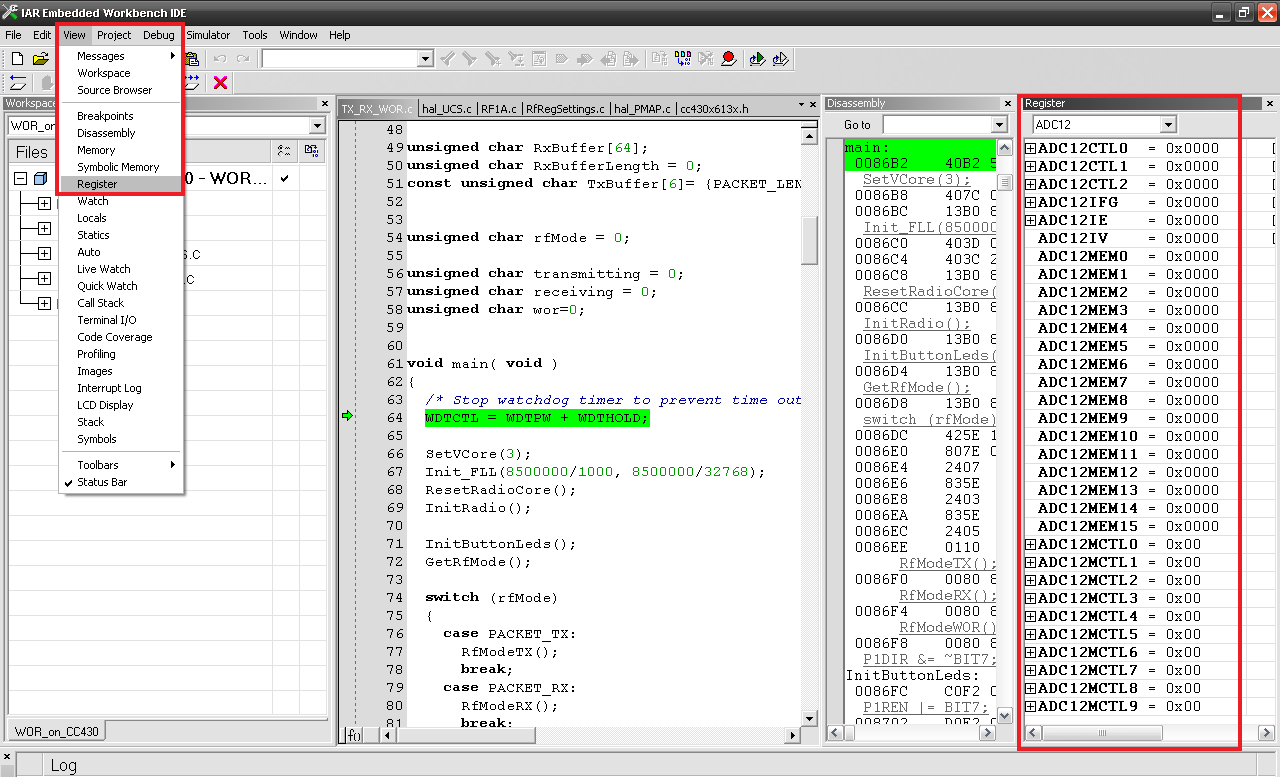
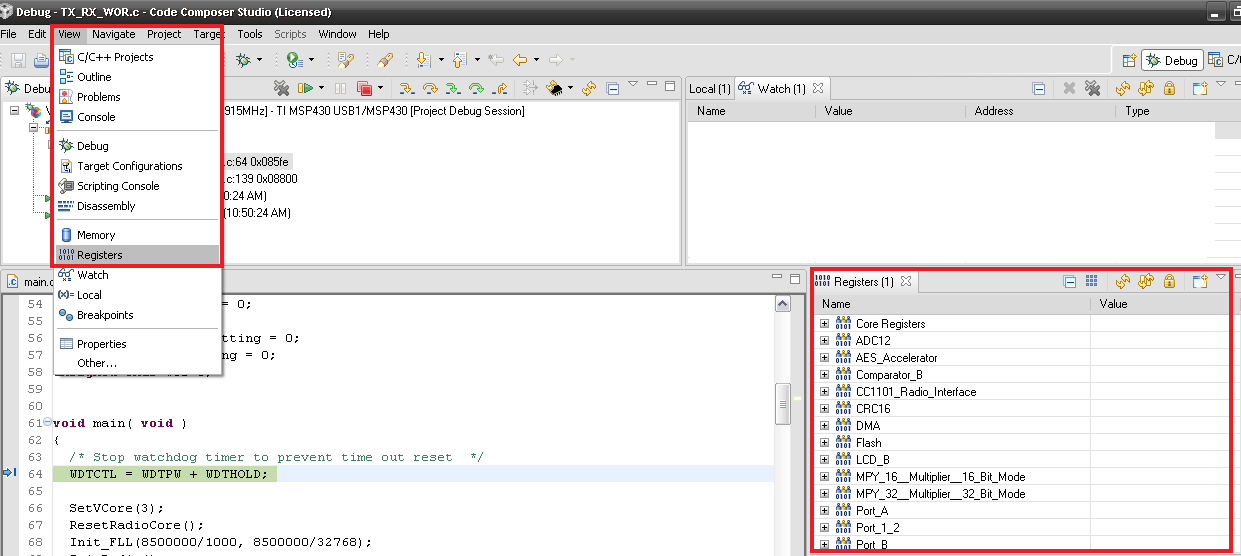
I'm trying out one of the sample adc12 programs using internal reference and the comment says "To view the conversion results, open an ADC12
//  register window in debugger and view the contents of ADC12MEM0." How exactly do you open this window?


Thanks,

  • Brock,

    for both IAR & CCS (I'm assuming you're using one of these IDEs), the window is enabled in Debug Mode, via View --> Register. The window shows a list of different modules, each with associated registers. The screenshots below should help.

    IAR

    CCS:


    Regards,

    Dung

  • Thanks Dung; I should have responded to the thread prior; i dug around a bit after posting the question and found it

  • Don't forget that some registers triger an action when being read. So the xxxIV registers which are cleared and clear a pending interrupt when read. Or the RX registers. It makes no difference whether your program or the debugger reads them, bu tif the debugger deos, your program will not see the original content anymore. And maybe even the interrupt is lost.

**Attention** This is a public forum