This thread has been locked.

If you have a related question, please click the "Ask a related question" button in the top right corner. The newly created question will be automatically linked to this question.

Stack Over Follow for msp430f663

Other Parts Discussed in Thread: MSP430F6638, CC430F6137

Hello,

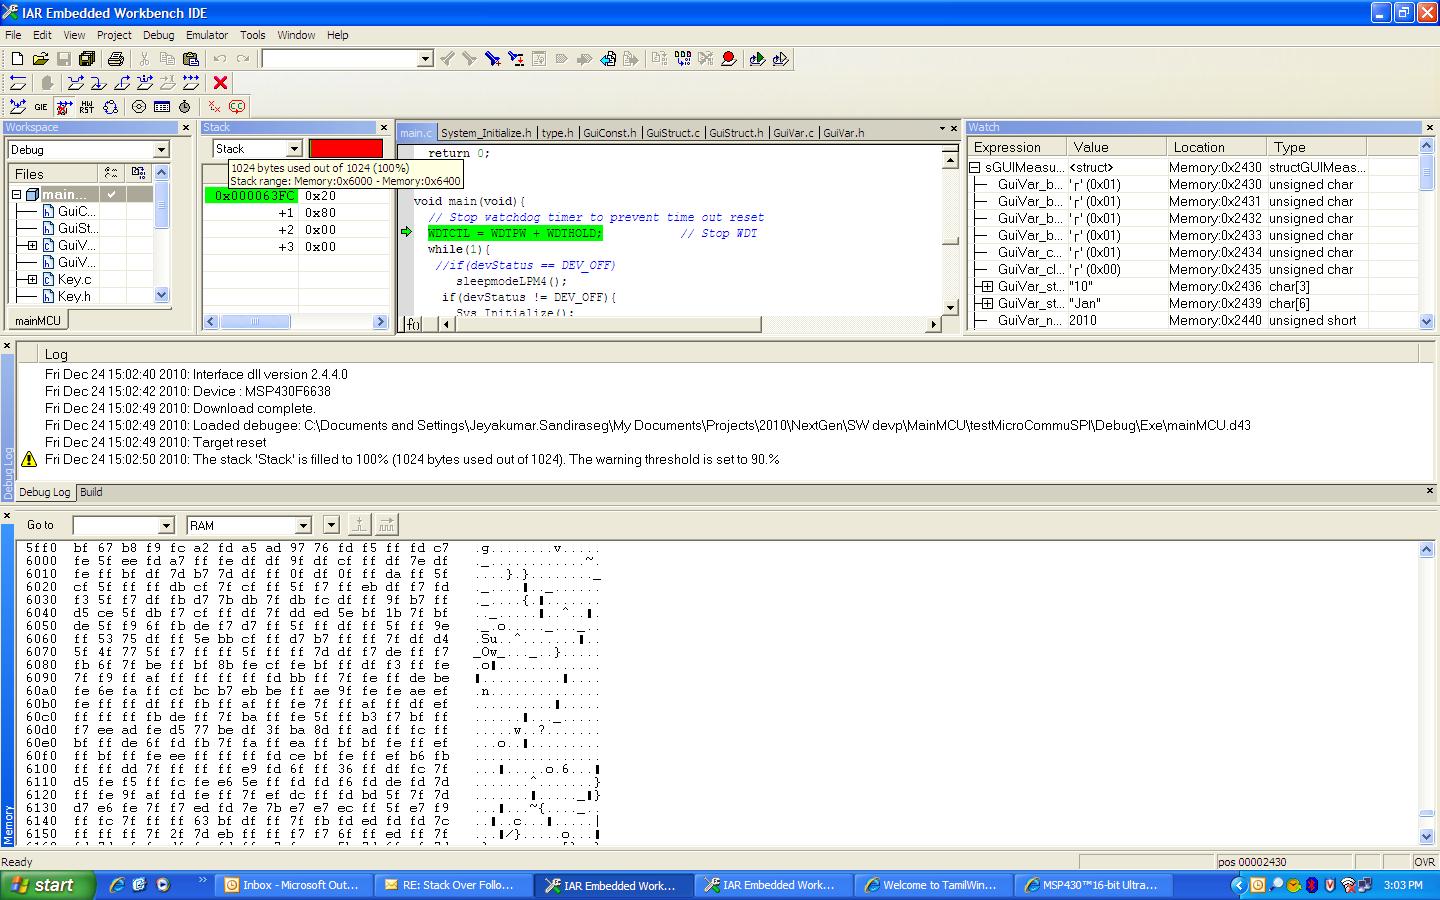
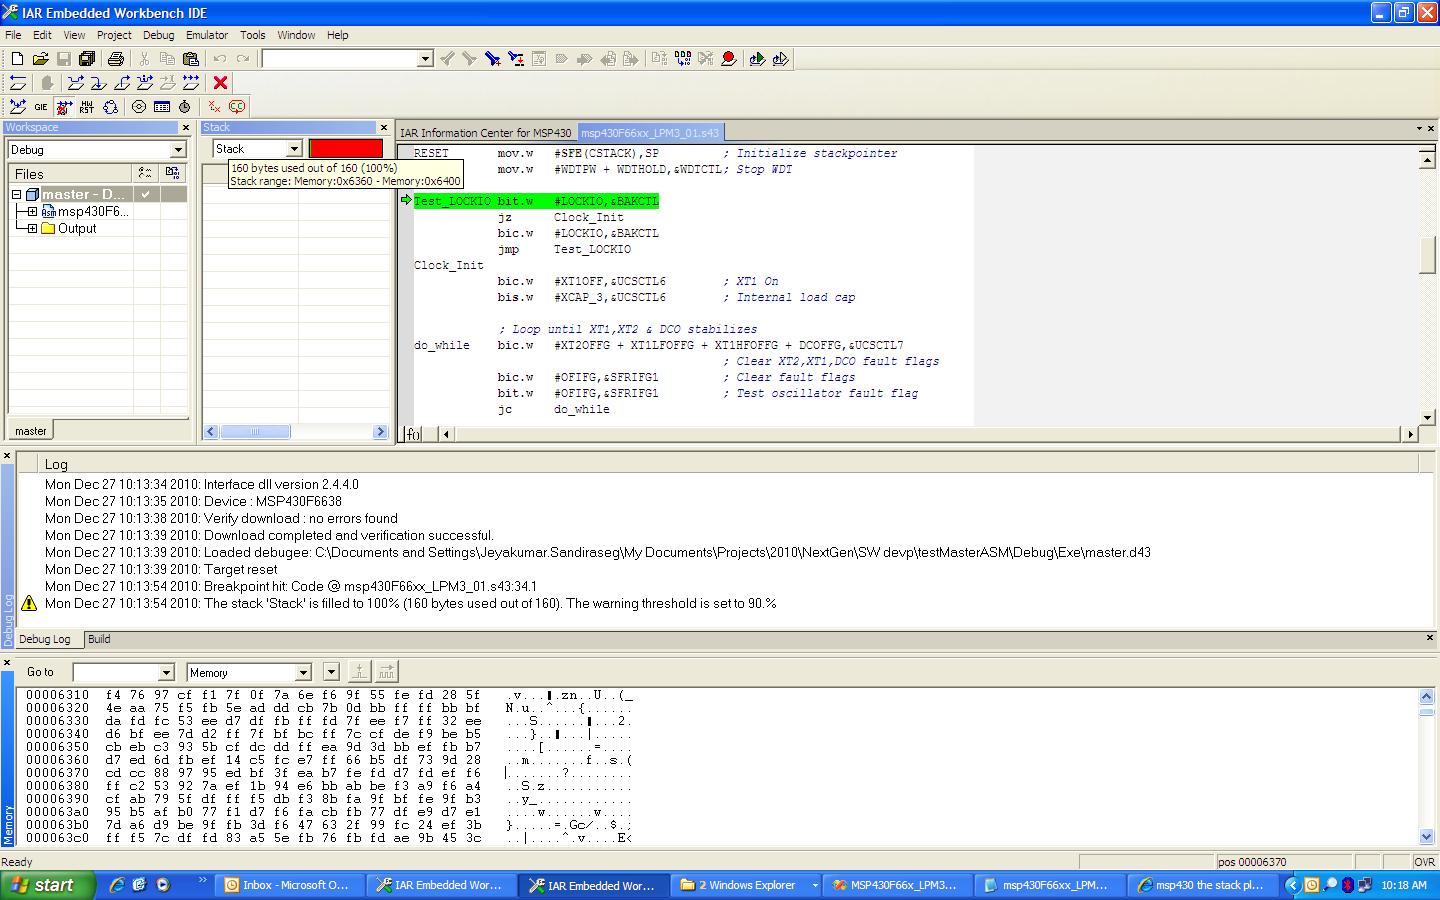
Whenever I download simple program the below error message keep prompting up with IAR log window.

Can I check is there any additional setting need to be done in IAR workspace?   

Wed Dec 22 16:01:49 2010: The stack 'Stack' is filled to 100% (1024 bytes used out of 1024). The warning threshold is set to 90.%

looking foward for your reply.

Best regards,

Joy

  • The warning is telling you that your stack is full. It also says that you have 1K for stack, which is pretty big! How about trying to reduce your stack usage?


    But I guess if you've got plenty of RAM to spare, you can add more...

    Right Click the project name->Options->General Options Category - Stack/Heap

  • Hello,

    Thanks for the replied.

    For the above message, the program ram size is few bytes; I have set the stack size 1024 bytes, the same message pop up.

    Even if I download a sample program of this micro given by TI web site. Thanks.

  • Verify that you can get to the start of main without seeing the warning. If you can do this, then you can proceed to debug your application.

  • Dear Darkwzrd,

    Thank you for your replied.

    The warning pop up right after the code is download, not even execute  a single instruction yet.

    Will it be due to the MCU related issue? It is diffcult to debug my application.

    Thanks,

    Joy

  • The problem is not related to any issue with the MCU or the compiler/linker/etc. The issue is with how your application uses resources.

    Can you confirm the contents of the stack are actually in use (use the memory window)? IAR will fill the stack with the pattern 0xCD. If your stack is full, then it will have different values for the stack.

    The only time I've ever had this warning appear at the beginning of main was when I had a Power Up RAM test run before main for a medical product I developed. In this case, the stack was written with values other than 0xCD, which made IAR think the stack was full. 

    If you are not familiar with your application, it could be that it is doing something similar. You could also try setting a breakpoint at your reset vector to see what the MCU executes before main starts.

  • Dear darkwzrd,

    Pls see below on the printscreen for IAR window.

     The data pattern is not found. Is there any additional settings need to do in IAR?

     The options are set as usual.  Could you pls advise how to set or where to do the addtional setting if there any ? Thank you.

  • I don't actually know which chip you are using, except that the title of your post is "Stack Over Follow for msp430f663". I will assume you are using an msp430f663x, where x is 0, 1, 2 or 3. Either way, for all of these parts the RAM is the same.

    Based on the screenshot, it appears that your stack range is 0x63FF to 0x6000. This makes sense based on which chip I think you are using. You can see in the memory window that the stack has values in it up to 0x6000. You need to figure out why.

    Go to the reset vector, and figure out what code runs before main starts.

  • Dear Darkwzrd,

    Sorry that I did not indicated clearly in my email. I am using  MSP430F6638.

    Pls see attached Screen shot with a break point just after the rest stack pointer but  unfortunately the same result appears.

    Can you help by trying at your end? let me know if you have the same issue?


  • Okay, I'm a little confused at this point. I've seen two screenshots now, which show different projects. The first one was a project in C with multiple files, and it had a stack of 1KB. This project has one file in assembly and has 160 bytes of stack.

    The stack trace tool is not normally able to track the stack of user made assembly files unless you take special action to help the tool keep track of the stack. This is an advanced feature. It is something I fiddled with a little bit, but ultimately didn't finish because I didn't think it was all that useful.

    If you have a project that has assembly files hand created (and you don't give the stack tool information about how the stack is being used), it won't be able to come up with this information. If the warning bothers you, then turn it off, by disabling the plugin (RightClickProject->Options->Category:Debugger->Plugins->Stack).

    Did you find out what was executing before main in your C Project that filled your stack? If you are running a C Project and you haven't done something special with the startup process, then IAR should load the stack with 0xCD when you first download code to the device using the FET Debugger. If you are doing something special with the startup process, then you can either disable the plugin has shown previously, or you can fill the stack back in with 0xCD depending on what you want to do.

  • darkwzrd said:

    Did you find out what was executing before main in your C Project that filled your stack? If you are running a C Project and you haven't done something special with the startup process, then IAR should load the stack with 0xCD when you first download code to the device using the FET Debugger. If you are doing something special with the startup process, then you can either disable the plugin has shown previously, or you can fill the stack back in with 0xCD depending on what you want to do.

    Today I downloaded some code into the Chronos development kit I've been playing with (CC430F6137), and I ran into your same problem. I found that IAR Compiler 4.21 (what I had installed on my home computer) had this same issue.

    This doesn't happen very often, but I believe that IAR is at fault here. I upgraded to version 5.20, and the issue was fixed. Looking through their change log, I think I found the likely culprit.

    EW21955: The stack plugin detected a failure overflow when using MSP430F66xx devices. The .ddf file now has a correct start ram address which means that the stack initialization no longer results in a failure. 

    Just for grins, I did a file diff between the files used for my CC430F6137 and I did find that the RAM range in Version 4.21 was incorrect as well (too bad this one wasn't mentioned in the change log as well)!


    Try upgrading to version 5.20 and see if the issue goes away.

  • Dear Darkwzrd,

    Thanks for following up regarding this issue.Actually, I try to contact IAR regarding the problem faced to see if they have any comments.

    ok, I will upgrade to version 5.20 and see if resolve the issue.

    Secondly, can I check with you on how to rest the process before goes to the main function?

  • Joy Tan said:

    Secondly, can I check with you on how to rest the process before goes to the main function?

    I don't understand your question. Could you ask again using different words?


  • Sorry I mean,  how to reset the process before goes to the main function?  

  • What process? The startup process? Reset it to what?

  • Sorry Darkwzrd,

    Remember, You suggested to me to put a break point at reset vector before go into the main function in order to see the stack initialization process.

    I like to find out from you, how to put that break point before go into the main function?

  • First you need to find out where your reset vector is. You can either look in the disassembler window or the memory window at location 0xfffe to find this out. Then go to that location and look at the assembly code to figure out what is going on. At that point, you can set a breakpoint and hit reset to single step through it.

    It is also possible to navigate to functions using the disassembler window. If you are letting IAR do the startup initialization, then you can just type "__program_start" to navigate to that location.

**Attention** This is a public forum