This thread has been locked.

If you have a related question, please click the "Ask a related question" button in the top right corner. The newly created question will be automatically linked to this question.

Compiler/MSP430FR5969: GDB launch with Corrupted RESETVEC

Part Number: MSP430FR5969

Tool/software: TI C/C++ Compiler

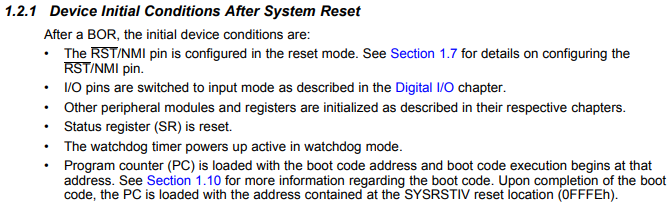
This post is a follow up on the related question with new information. All previously described behavior is still occurring, but I found that the source of the wild program counter is a bad value stored in SYSRSTIV located at 0xFFFE. The address stored at this location is loaded into the program counter right before the user program is started:
Using GDB we can see the difference between normal and erroneous operation:

Normal Operation

(gdb) layout asm
(gdb) x/8i 0xfffa
   0xfffa:      interrupt service routine at 0xffff
   0xfffc:      interrupt service routine at 0xffff
   0xfffe:      interrupt service routine at 0xdcb4
   0x10000 <last_rst>:  beq
   0x10002 <mpu_rsts>:  beq
   0x10004 <wdt_rsts>:  beq
   0x10006 <rsts>:      beq
   0x10008:     and.b   @r15+,  -1(r15) ; 0xffff

Erroneous Operation

(gdb) layout asm
(gdb) x/8i 0xfffa
   0xfffa:      interrupt service routine at 0xffff
   0xfffc:      interrupt service routine at 0xffff
   0xfffe:      interrupt service routine at 0xffff
   0x10000 <last_rst>:  beq
   0x10002 <mpu_rsts>:  beq
   0x10004 <wdt_rsts>:  beq
   0x10006 <rsts>:      beq
   0x10008:     and.b   @r15+,  -1(r15) ; 0xffff

The code snippets show the location of interest (RESETVEC) and the surrounding instructions. Prior to running, 0xFFFE always appears to be correct when I print the memory location. It's only after attempting to run the program and it getting lost in garbage land that I can see it's 0xFFFF instead of the correct value 0xDCB4. I'm not sure if this is GDB reporting the wrong/old value or if it somehow gets clobbered. It's suspicious that it only happens on the first launch and never any subsequent loads.

I looked through the msp430-gcc source code but couldn't find anything useful in crt0_start.S or anywhere else. I would appreciate any info on how the $pc gets loaded, how 0xFFFE is set, or what might be going wrong.


  • The linker script defines a section for each vector and the compiler sets that label to the required value. This is how I do it in assembly:

           .section .resetvec,"ax",@progbits
            .word   sys_init
    

    Where sys_init is the label where execution should start. msp430-elf-objdump -S will show you this information from your .elf file.

    The interrupt vectors will be set when you program the part. If it were a flash part the vectors would be safe from most bugs but with FRAM any errant program can trash them. I like to use the MPU to write protect that region. That only works because I don't use the high FRAM and can tolerate the lost memory.

  • Hi Mike,

    From the sounds of it the problem is with how GDB and GDB Agent are loading your program, since the PC never even reaches __crt0_start it can't be a code issue.

    Can you please post the output of

    msp430-elf-readelf -l <your-executable>

    I hope both the LMA and VMA of SYSRSTIV are 0xFFFE.

    If you set the environment variable "GDB_AGENT_DISPLAY_LEVEL=4" before starting the GDB agent, are you able to glean any information from the verbose output?

    You can get more verbose output by increasing the level further, but 4 should be enough to see something like this:

    GDB requesting a write of 0x2 bytes of binary data starting at address 0xfffe
    -Writing to flash :
      MSP430_Memory(addr=0xfffe ,length=0x2,WRITE) returns 0

    When you reload the program in GDB, thereby fixing the issue, does any of this debugging output from GDB agent change?

    What does the GDB command "show arch" report before you load or run your program? If it is set to "MSP430" at any point, and you set it to "MSP430X", does that make any difference?

    Regards,

  • msp430-elf-readelf output:

    Elf file type is EXEC (Executable file)
    Entry point 0xdcb4
    There are 9 program headers, starting at offset 52
    
    Program Headers:
      Type           Offset   VirtAddr   PhysAddr   FileSiz MemSiz  Flg Align
      LOAD           0x000000 0x00001d40 0x00001d40 0x00154 0x00266 RW  0x4
      LOAD           0x000154 0x00004400 0x00004400 0x011d8 0x011d8 R   0x4
      LOAD           0x00132c 0x000055d8 0x000055d8 0x0005c 0x0005c RW  0x4
      LOAD           0x001388 0x00001c00 0x00005634 0x00294 0x00294 RW  0x4
      LOAD           0x00161c 0x00010008 0x000058c8 0x00002 0x00002 RW  0x4
      LOAD           0x00161e 0x000058ca 0x000058ca 0x084fe 0x084fe R E 0x4
      LOAD           0x009b1c 0x0000fff0 0x0000fff0 0x00002 0x00002 R E 0x4
      LOAD           0x009b1e 0x0000fffe 0x0000fffe 0x00002 0x00002 R   0x4
      LOAD           0x009b20 0x00010000 0x00010000 0x00008 0x0035e RW  0x4
    
     Section to Segment mapping:
      Segment Sections...
       00     .lower.bss .bss .heap 
       01     .lower.rodata 
       02     .rodata2 
       03     .lower.data .data 
       04     .upper.data 
       05     .lower.text .text 
       06     __interrupt_vector_49 
       07     __reset_vector 
       08     .persistent .upper.bss .noinit

    GDB agent output before running:

    Target connected...Starting server
    -Reading the device register 0:
     MSP430_Register(pc=0xdcb4,READ) returns 0
    
    and
    
    -Reading the device registers:
     MSP430_Register(ALL_REGS,READ) returns 0
      Reg pc=0xdcb4
    
    and
    
    GDB requesting a write of 0x2 bytes of binary data starting at address 0xfffe
    -Writing to flash :
      MSP430_Memory(addr=0xfff0 ,length=0x2,WRITE) returns 0
    GDB requesting a write of 0x8 bytes of binary data starting at address 0x10000
    -Writing to flash :
      MSP430_Memory(addr=0xfffe ,length=0xa,WRITE) returns 0

    GDB agent output after stopping:

    -Stopping the device:
     MSP430_State(0, TRUE) returns 0 cycles(2011)
    -Reading the device register 0:
     MSP430_Register(pc=0x4,READ) returns 0

    GDB agent after 'load' command:

    GDB requesting a write of 0x2 bytes of binary data starting at address 0xfffe
    -Writing to flash :
      MSP430_Memory(addr=0xfff0 ,length=0x2,WRITE) returns 0
    GDB requesting a write of 0x8 bytes of binary data starting at address 0x10000
    -Writing to flash :
      MSP430_Memory(addr=0xfffe ,length=0xa,WRITE) returns 0
    
    and
    
    -Reading the device registers:
     MSP430_Register(ALL_REGS,READ) returns 0
      Reg pc=0xffff
      ...
    
    and
    
    -Writing the device register
    0:  MSP430_Register(pc=0xdcb4,WRITE) returns 0

    Show arch:

    (gdb) show arch
    The target architecture is set automatically (currently MSP430X)

    Notes:

    - The request/write sequence seems weird. GDB requests data to write starting at 0xfffe but then addr=oxfff0 in MSP430_Memory. GDB then requests data starting at 0x10000 but the following addr=0xfffe.

    - Also in the request/write sequence: GDB requests 0x8 bytes starting at 0x10000, but ends up writing 0xa bytes seemingly starting at 0xfffe. Could this be an alignment issue? If it is, I wouldn't expect it to work on subsequent loads

    - After the load command, the gdb agent shows that pc=0xffff and then issues a register write to set it to pc=0xdcb4. This does not happen on the initial load.

    Bonus note:

    I just found a very interesting behavior. On initial launch, the pc will be wild. After a subsequent load, the pc and the program will always run normally. However, multiple 'load' commands in a row without running the program in between will reproduce the wild pc.

  • Linker script seems okay:

    RESETVEC         : ORIGIN = 0xFFFE, LENGTH = 0x0002
    
    and
    
    __reset_vector :
    {
      KEEP (*(__interrupt_vector_56))
      KEEP (*(__interrupt_vector_reset))
      KEEP (*(.resetvec))
    } > RESETVEC

    objdump:

    Disassembly of section .text:
    0000dcb4 <__crt0_start>:
        dcb4:       81 01 00 40     mova    #81920, r1      ;0x14000

    Nothing stands out to me as being wrong, but let me know if I should look at anything else in objdump

  • Thanks for providing that data. I'll take a detailed look into it and run my own tests on it soon.

    As a longshot, what happens if you change the start address of the HIFRAM memory region to 0x10002 instead of 0x10000?

    This way GDB won't ask the GDB agent to do a write of 0xFFFE to 0x10008 in one go, and should use two separate internal load commands.

    For the subsequent load commands which "fix" execution, do you see the below output in GDB agent again?

    MSP430_Memory(addr=0xfffe ,length=0xa,WRITE)

    Or does it only write 2 bytes to 0xFFFE for those commands?

    Are you using the latest version of the GDB Agent?

    Regards,

  • I tried your suggestion and moved HIFRAM to 0x10002. It produced the type of load you expected to see but did not fix the issue. Here is the relevant output:

    GDB requesting a write of 0x2 bytes of binary data starting at address 0xfffe
    -Writing to flash :
      MSP430_Memory(addr=0xfff0 ,length=0x2,WRITE) returns 0
    GDB requesting a write of 0x8 bytes of binary data starting at address 0x10002
    -Writing to flash :
      MSP430_Memory(addr=0xfffe ,length=0x2,WRITE) returns 0
    -Writing to flash :
      MSP430_Memory(addr=0x10002 ,length=0x8,WRITE) returns 0

    Just to clarify, the output under "GDB agent after 'load' command" in my earlier comment is the subsequent load you're asking about.

    The only difference I've noticed between the gdb agent output in working vs nonworking loads is the pc register write which recognizes that it is incorrect:

    -Reading the device registers:
     MSP430_Register(ALL_REGS,READ) returns 0
      Reg pc=0xffff
      ...
      <rest of registers>
      ...
    
    -Writing the device register
    0:  MSP430_Register(pc=0xdcb4,WRITE) returns 0
  • Looking at the code for mspdebug (a lot smaller than gdb and I don't have a current copy of the gdb source sitting around) I see a couple of ways to run the program. Maybe.

    The continue command includes an address and this is written to the PC before execution is started. Reset vector not involved.

    The restart command requests a device reset. I don't know if that also results in a change to the run state.

    One nice thing about mspdebug is that it is small enough to deal with. And you can add some code to print out gdb command packets if you want so you can see exactly what the gdb client is requesting.

  • Are you able to provide a reproducible example for this? If you don't want to provide your application binary, I would suggest starting by trying to reproduce the memory map shown in the readelf output.

    Just create a source file with variables/functions sized to try and recreate the memory map of your application. Defining macros with "for" loops is one way to add an arbitrary amount of code:

    #define _A for (volatile int i = 30000; i > 0; i--);
    #define _B _A _A _A _A _A _A _A _A _A _A
    
    void foo (void)
    {
      _B _B
    }

    And define all the same interrupt vectors etc.

    Unless I am missing something, this sounds like it must be some issue with the loading process rather than a code generation issue.

    Thanks,

  • Thanks for the suggestion. I haven't been able to spend time on this recently but I'm hoping to get back to it soon. In addition to the steps you described, it occurred to me that trying other versions of the msp430 opensource stack might be interesting. What do you think?

  • You could try different versions of the debug stack but there haven't been any significant MSP430 changes in a while (https://software-dl.ti.com/ccs/esd/documents/xdsdebugprobes/emu_xds_software_package_download.html).

    Even if you pin point a specific update as having introduced the bug, we would probably still need a reproducible test case.

    Regards,

**Attention** This is a public forum