Part Number: MSP432P401R
Other Parts Discussed in Thread: SYSBIOS
Tool/software: TI-RTOS
Using CCSv8 (latest), v2.10 of the Simplelink SDK. TI Resource Explorer exampls.
When creating some new labs for the TI-RTOS workshop on Simplelink, I ran into a problem with the execution graph - or maybe it is just my interpretation of the numbers.
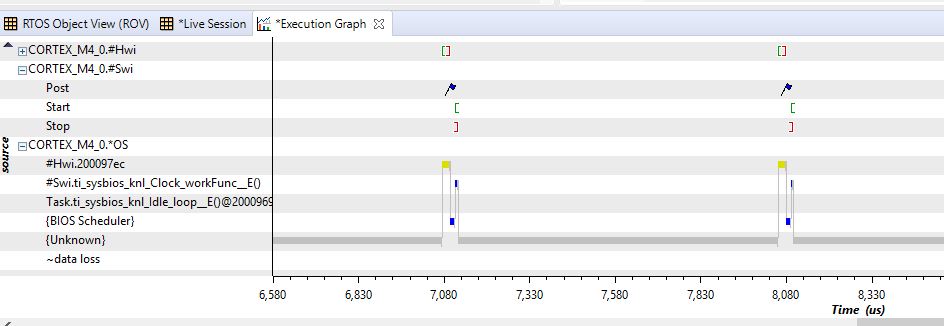
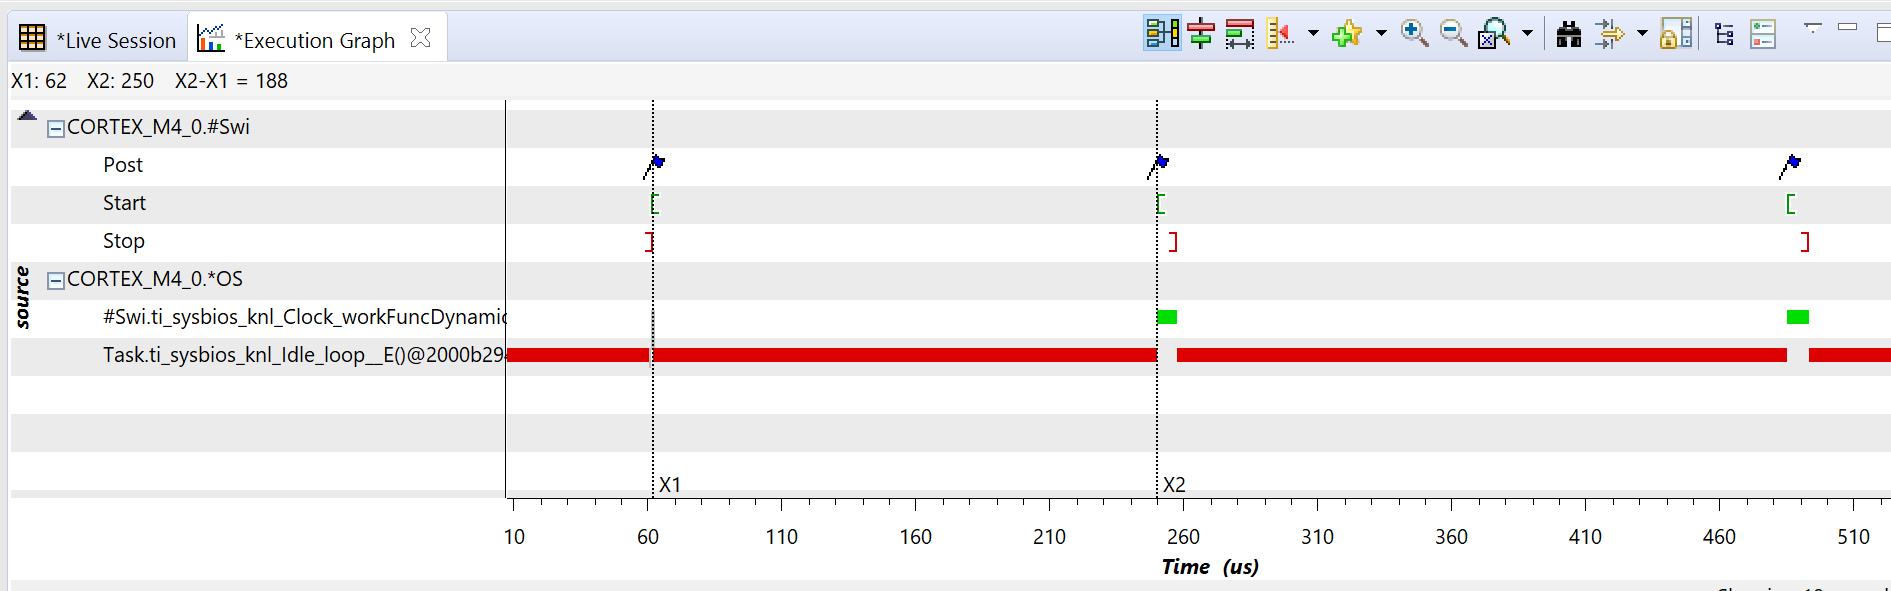
Using the native (SYS/BIOS) Clock example from Resource Explorer, I get the following picture. It shows five "ticks" with Clock set up as the default 1000us (1ms) and then the clock function runs. Perfect. Until you benchmark the TIME between each clock tick - which according to the graph is 47us. It should be 1000us (1ms). I am sure the clock is going off at a 1ms rate, but why does the graph show every 47us?
So two questions:
- Why is 47uS really 1000us? How do I interpret this?
- If there is an interpretation, why is the Execution Graph "wrong" and does not display "correct" data? Is there a way to force it to show 1000us ticks vs 47us ticks?