Because of the holidays, TI E2E™ design support forum responses will be delayed from Dec. 25 through Jan. 2. Thank you for your patience.

This thread has been locked.

If you have a related question, please click the "Ask a related question" button in the top right corner. The newly created question will be automatically linked to this question.

BQ28Z610: data of SOC

Part Number: BQ28Z610
Other Parts Discussed in Thread: BQSTUDIO

Dear team

The customer has an case, the following is the customer's log, at line 7&8, they can see that the SOC reading suddenly changes from 80% -> 9%...but the voltage seems to be normal

Could you guide us how to resolve this issue or do some experiment?

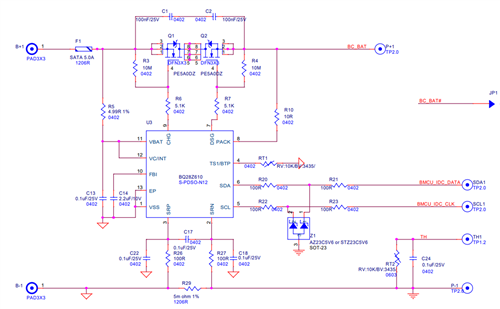
The schematic and data as attached.

0114_DataChecks.csv

Many thanks

Denny

  • Hello Denny,

    Can you share a bqStudio log and .gg file if possible? We would at least need the .gg file to give any suggestions.

    Have they found the correct chem ID for their battery and then completed a learning cycle?

    Sincerely,

    Wyatt Keller

  • Hi Keller

    Thanks for your reply.

    I just get the file from the customer, is it enough for your site analysis?

     If not, please kindly to tell me.

    APP00324-2021-06-03 ver B.gg.csvAPP00324-2021-06-03 ver B.srec

    Many thanks

    Denny

  • Hello Denny,

    What's the time difference between the samples of 9% SOC and 80%? The voltage looks like it's almost a 140mV higher. The gauge uses the voltage to find the SOC when at rest, if there was some charge current then a reset of the gauge, it can force the gauge to think there is higher current. Also if your cells relax up to a much higher voltage the gauge may correct the SOC higher.

    What chem ID are they using?

    Sincerely,

    Wyatt Keller

  • Hi Keller

    Thanks for your reply.

    BQ28Z610 data of SOC.7z

    What's the time difference between the samples of 9% SOC and 80%? 

    => About 17 hour


    The customer's reply is as follows, and in item2, I can see that the SOC is charged to 100% ,but the voltage is only 3.86

    Unfortunately, today the customer reported the log with the second SOC reading problem (DataChecks_20220119) However, the behavior of this one is very different from the first one. It seems that this one has been used since 2022.4, and the problem occurred later. And the voltage after the final charge has returned to above 4.1V!!

    This is the currently known information for reference, if you have any ideas, please do not hesitate to advise, thank you!!

  • Hello Denny,

    Can they perform the tests with a temp chamber using bqStudio? It's hard to tell what is happening with their custom log and where the log starts/stops and all the registers we need to help debug.

    If the gauge is sent a reset command or losses power, it will recalculate the SOC based on the present voltage and temperature. If the gauge was under load or charge when this occurs it can cause SOC errors. We would need to see the bqStudio log to understand better what is occurring and why the SOC may be jumping.

    Sincerely,

    Wyatt Keller

  • Hi Keller

    Thanks for your reply.

    Below will showed 3pcs result and these 3 batteries are the same design for us.


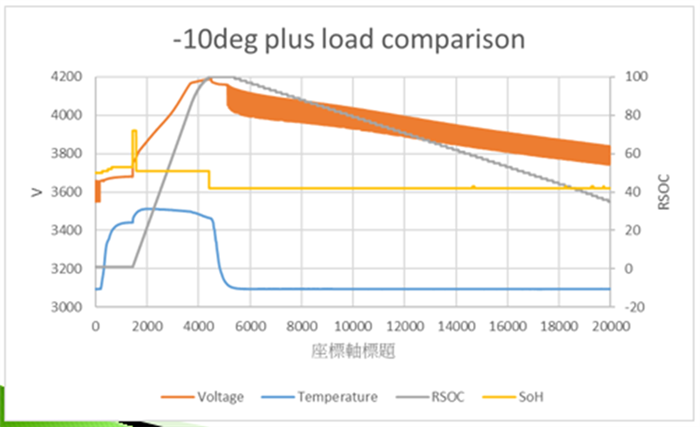
                    Failure-1

                    This one is new battery pack and use for our customer, the cycle count = 1 , it’s looks the fresh battery pack

                    SOH we expected to near to 100% but the average of SOH is 40%

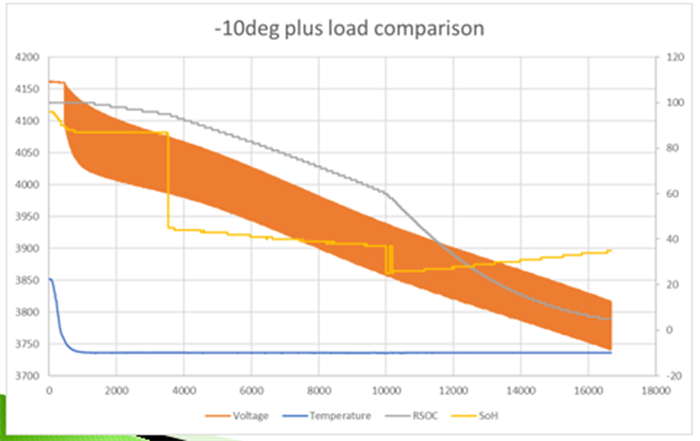
                    Failure-2

                    This one is new battery pack and use for our customer, the cycle count = 6 , it’s looks the fresh battery pack as well

                    And the SOH value looks not stable and low.

                    Good sample

                    And we choose one battery pack and all design parameter is same as above 2 sample,

                    The value of SOH looks very stable.


    So, how to explain this abnormal change of SOH?

    Or is there any way we can reproduce this issue?

     If you have any idea please kindly to tell us

    Many thanks

    Denny

  • Hello Denny,

    Low temperature pulsed loads are the hardest applications to gauge, for the SOH variation that does not looks possible for the SOH to move that much, is the host reading the correct register in all cases? Can you share the bqStudio logs from the test?

    SOH is based on all predetermined values, the only way for the SOH to jump this much is from the Ra table being updated during discharge (which it is possible to increase significantly due to the low temp pulsed load).

    But the first step we would need is the bqStudio logged data with a .gg file from before and after (or enable .gg logging would be ideal) for us to help identify what may be causing this.

    Sincerely,

    Wyatt Keller

  • Hello Denny,

    I think this is a duplicate thread, I will answer on the other thread since there is data posted there.

    https://e2e.ti.com/support/power-management-group/power-management/f/power-management-forum/1076507/bq28z610-battery-rsoc-soh-jump-at-the--10-battery-have-gpcrb

    Sincerely,

    Wyatt Keller

  • Hi Wyatt

    Please refer the attachment file.

    If another data you need to analyze please let me know.

     202-01-26-RMA_336.gg.rar

    202-02-08-RMA_ DISCHARGE_336.rar

    2022-01-26-RMA_0030.gg.rar

    2022-01-27_01-RMA_ DISCHARGE.log.rar

    Many thanks

    Denny

  • Hello Denny,

    Thanks for the data, I am going to close this thread so we con consolidate threads. You can post on the other with questions (not sure if you're working with Cherry?)

    I will respond on the other thread.

    Sincerely,

    Wyatt Keller