This thread has been locked.

If you have a related question, please click the "Ask a related question" button in the top right corner. The newly created question will be automatically linked to this question.

BQ2970: The data in the data sheet is not matching the test result of my PCB performance

Part Number: BQ2970

Hi,

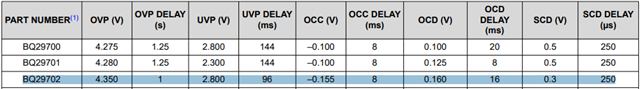
I have implemented a battery protection circuit using the BQ2970. Additionally, I have created a circuit similar to the BQ2970 EVM. However, during testing, I did not obtain the expected values mentioned in the EVM specifications. I have checked the tolerance levels, but my data exceed the given tolerance levels. Could you please advise on what might be causing this discrepancy and whether it is safe to continue with my circuit? I have attached the test report of my experiment below.

Thank you,

sanathkumar

bat pcb test res ext.pdf

  • Hi Sanath,

    1. Overcharge detection/release voltage

      The OVP threshold on the 02 version of the bq297xx is 4.35V, so 4.36V sounds about right. The hysteresis being at 4.2V also sounds close.

    2. Over-discharge detection/release voltage

      2.55V sounds wrong for this and your scope looks to be showing a voltage higher than this. I recommend using an accurate multimeter across C1 during testing to get a precise measurement of the voltage at the device's pins. A 3V hysteresis value seems close for a 2.8V threshold, but the step size on the waveform is far too large to get an accurate idea of what voltage the recovery occurs at. I recommend stepping by 50mV until the part recovers to get a better idea of where the threshold is at.

    3. Discharge overcurrent detection/release voltage

      The OCD threshold of the 02 version is 160mV, so 155mV sounds correct. This waveform is a little confusing to me. Why is the BAT pin voltage going to 0V when the protection triggers? Where are your probes placed? How the recovery works is when the FETs turn off, the V- pin is pulled up to BAT by the load. The device will then recover from the OCD (or SCD) protection when the V- pin voltage drops below BAT-1V due to the load impedance increasing. I'm not sure if this is what is occurring as it looks as though BAT is very low for some reason in your waveform.

    4. Load short circuit detection/release voltage

      Same as before. The protection will recover when V- <= BAT-1V.

    5. Charge overcurrent detection/release voltage

      OCC threshold is -155mV on the 02 version so this seems correct.

    6. Operating current consumption

      This value should be the current through R1 when BAT = 3.9V and V- = 0V. How are you setting up this test on your board?

    7. Power down current consumption

      This value should be the current through R1 when BAT = V- = 1.5V. How are you setting up this test on your board?

    8. Resistance between V– and BAT pin

      I'm not sure how you're getting such a low value. How are you setting up this test?

    9. Current sink between V– and VSS

      This should be the current through R2. How do you have this set up?

    10. COUT current source when activated High

      This seems okay.

    11. COUT current sink when activated Low

      So does this.

    12. DOUT current source when activated High

      This might be a typo in the datasheet, maybe V3 is supposed to be V4.

    13. DOUT current sink when activated Low

      Same as before.

    14. Overcharge detection delay

      Detection delay does not mean the time it takes for the FET to turn off. Detection delay is the time between the fault condition being met and the FET starting to turn off. In this case, it should be the time between VBAT exceeding the OVP threshold and COUT switching off.

    15. Over-discharge detection delay

      Same as in 14 but the time between VBAT dropping below the UVP threshold and DOUT switching off.

    16. Discharge overcurrent detection delay

      Same as before but the time between the OCD threshold being met and DOUT switching off.

    17. Load short circuit detection delay

      Same as before but the time between the SCD threshold being met and DOUT switching off.

    18. Charge overcurrent detection delay

      Same as before but the time between the OCC threshold being met and COUT switching off.

    For reference:

    Regards,

    Max Verboncoeur

  • Hi Max Verboncoeur,

    1. Overcharge detection/release voltage

            Thank you for your comment.

    1. Over-discharge detection/release voltage

           As you told I have used MULTI METER as well as CRO obtain these values, where I have considered MULTI METER as my final value and mentioned in the document.

    I will conduct release voltage test as you suggested and let you know the result.

    1. Discharge over current detection/release voltage

    I have placed the probe across BAT and GND pin.

    As u assumed the BAT voltage is going low because when the OCD is triggered VSS to V- voltage is increasing to Battery voltage level.

    1. Load short circuit detection/release voltage

                      Thank you for your comment.

    1. Charge over current detection/release voltage

                        Thank you for your comment.       

    6, 7,8 ,9, 10 ,11 ,12 ,13 – I have used BQ29700 EVM to conduct these tests.

    1. Overcharge detection delay

         I think I have mentioned the same in my document.

          I just want to know the delay tolerance of this case are not matching the datasheet so is it ok to continue or not.

    15, 16,17,18

          I just want to know the delay tolerance of this case are not matching the datasheet so is it ok to continue or not.


    Regards,

    SANATH KUMAR

  • Hi Sanath,

    I think I have mentioned the same in my document.

          I just want to know the delay tolerance of this case are not matching the datasheet so is it ok to continue or not.

    The test cases in your document seem as though they are testing the time it takes for COUT/DOUT to go from high to low, but that is different from the datasheet spec for detection delay, which is the time from the fault condition's threshold being met to the time that COUT/DOUT begin to turn off. I recommend looking at Section 8.1 of the datasheet for a diagram of what this should look like.

    Regards,

    Max Verboncoeur