This thread has been locked.

If you have a related question, please click the "Ask a related question" button in the top right corner. The newly created question will be automatically linked to this question.

TPS22917: Model simulation and parameters calculation

Part Number: TPS22917

Tool/software:

Dear TI Team,

Would you please let me know if the PSpice model has got corrected and updated?

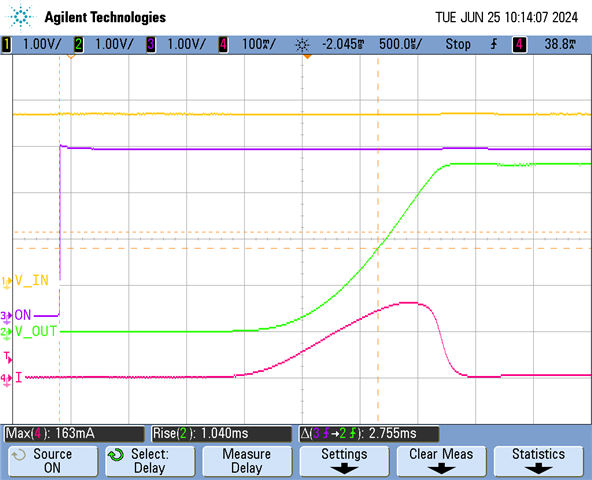
I tried to replicate figure 10-3 in the datasheet and simulate the circuit based on that (CT=1000pF, CL=47uF and RL=1K) but got the results far off from the datasheet.

Result in Datasheet

PSpice-TI simulation

I got 362mA inrush current instead of 150mA and 480us risetime instead of 1.037ms.

Besides that, Could you please let me know why the results in figure 10-3 do not concur with the formula?

Based on the formula 6 with CT=1000pF we should get 1.9 mv/us slew rate and then with the calculated slew rate and using formula 5 the inrush current should end up to 89.3mA(CL=47uF). Would you please let me know why it has been measured 142mA?

Best regards,

Amir

  • Hi Amir,

    Thank you for your question, We do recommend using the EVM to test device functionality for specific loading conditions.


    I will take a look at this question by the end of the week.

    Best Regards,
    Nicholas

  • Hi Amir,

    Looking at the datasheet it seems that the example image in the data sheet, the calculations from the data sheet, and your PSpice simulation all have different operating conditions resulting in the differences you see in rise time and inrush current. 

    If you would like precise data for inrush current using an EVM would be the best option to test for your specific loading conditions.

    Best Regards,

    Nicholas

  • Hi Nicholas,

    Thanks for your answer.

    It's understandable that the result from the simulation may deviate from the real life measurement depending on the model accuracy.

    However regardless of the simulation result, I assume there should be a correlation between the calculation outcomes based on the formula and equations  and, the examples results in the datasheet.

    I read the datasheet again, especially section 10.2.2, I could not find that the operating conditions of image 10.2 and image 10.3 differ apart from CT. Would you please let me know if I have looked at the wrong section?

    Considering your elaboration, Does not it mean that I can not rely on the equations and formulas in the datasheet for finding an appropriate CT to achieve a desired inrush current and Slew rate?

    Does it imply that I need to use an EVM to find an appropriate CT?

    If it is Considered that the operating conditions of images 10-2 and 10-3 are similar apart from the CT, then:

    With CT=1000pF, SRon=1900 and using equation (1) in section 9-3-2 returns Slew Rate=1.9 mV/us

    With Slew Rate= 1.9 mV/us and CL=47uF and using equation (5) the inrush current should be 89.3mA.

    So my question is Why the measured inrush current(142mA) in image 10-3 is almost 60% more than the calculated value(89.3mA)?

    Best regards,

    Amir

  • Hi Amir,

    All numbers and formulas given in the datasheet are correct and can be used to find the correct slew rate, inrush current, and CT that you need.

    The main reason you see a difference between the 89.3 mA you calculated on the graph is that the CL and operating conditions of the graphs are not given and it may be different from the 47uF you are using for your calculations resulting in the 60% difference you are seeing.

    However I have noticed some inaccuracies with the PSpice model and I have reported those to my team I would recommend basing your schematic on the datasheet calculations.

    If you would like to further verify your implementation you can use an EVM to accurately test your operating conditions.

    Best Regards,
    Nicholas

  • Hi Nicholas,

    Thanks for the elaboration.

    So it would be helpful and more clear if it is mentioned in the datasheet that the operating condition and CL of each graph are not identical.

    Having said that, I have obtained an EVM of TPS22917 and performed some measurements with different CL, please see the following results:

    The operating conditions of each test apart from CL are identical:

    CT=1000pF (Based on the TPS22917 EVM user guide ) Vin= 3.6V and RL= 1K

    CL=47uF

    CL=22uF

    CL=15uF

    You can find the summer here:

    Measurement results
    Calculated
    CL (uF) CT (pF) I_inrush (mA) TR (us) I_inrush (mA) TR (us) Inrush current difference
    47 1000 163 1040 89.3 1600 182.53%
    22 1000 79 975 41.8 1600 189.00%
    15 1000 67 965 28.5 1600 235.09%

    As you can see above the measurement result for 47uF load is almost in concur with  the measurement result shown in graph 10-3 in the datasheet.

    I would appreciate it if you could let me know why the measured inrush current for each load is higher than the calculated one and the rise time is lower?

    Best regards,

    Amir

  • Hi Amir,

    I am going to verify your results and get back to you with an answer later this week.

    Thanks,
    Nicholas

  • Hi Amir,

    Looking at our EVM we noticed that the loading conditions could cause a large difference such as the one that you found. For example on our EVM the built in CT was 1340 pF. If possible could you unsolder and measure the capacitor on the CT pin to verify its capacitance?

    Another thing that accounted for the differences you are seeing is that RL = 10 ohms on the datasheet measurements for slew rate and rise time compared to the RL of 1k that you are using in your tests. Accounting for these 2 differences the rise time should be within 20% of the calculated values.

    If you need to determine values for a schematic account for an extra +-20% variance from the typical given in the data sheet and make sure to check everything with the EVM to verify the results. Make sure to also use risetime instead of slew rate when doing calculations as slew rate only accounts for the fastest portion of the ramping.


    Best Regards,
    Nicholas

  • Hi Nicholas,

    Thanks for your answer.

    I measured 1380pF for CT on my EVM.

    Considering what you descried on the above answer, It would be helpful and beneficial if a new equation for calculating CT with consideration of RL variation is introduced in the datasheet.

    Thanks for your help.

    Best regards,

    Amir   

  • Hi Amir,

    Thanks for helping us work through the problem, your tests really helped us determine where the problem could be.

    We will make sure to include the variation of RL in the next revision of the datasheet to add further clarity on how to find CT.

    Best Regards,
    Nicholas