This thread has been locked.
If you have a related question, please click the "Ask a related question" button in the top right corner. The newly created question will be automatically linked to this question.
Nitin:
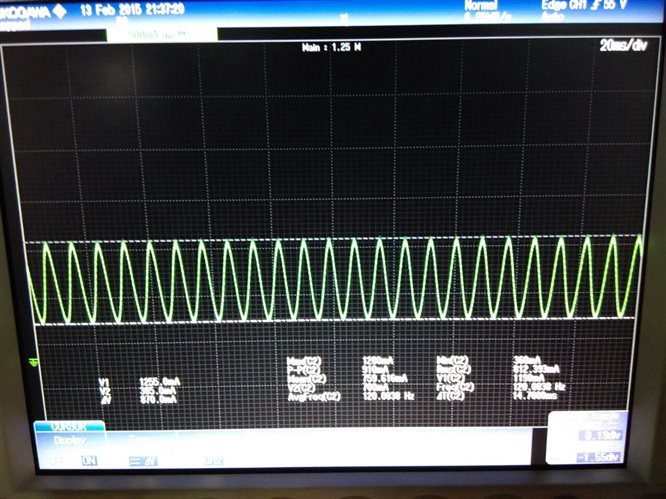
Can you please zoom in to show the current ripple? Also please tell me the time scale. The labels of this scope picture are not very clear.
David Zhang
Dear Zhang,
Please refer below Curves after 1 hr Burn In
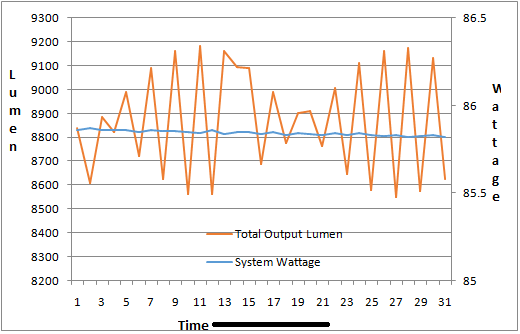
Curve 1: Lumen Output Curve at 60Hz
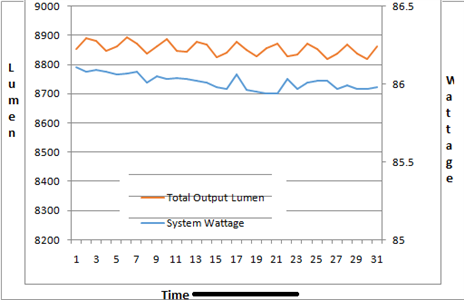
Curve 2: Lumen Output Curve at 50Hz
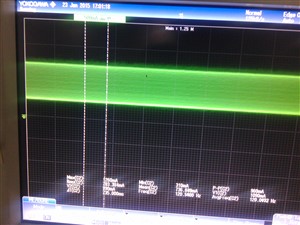
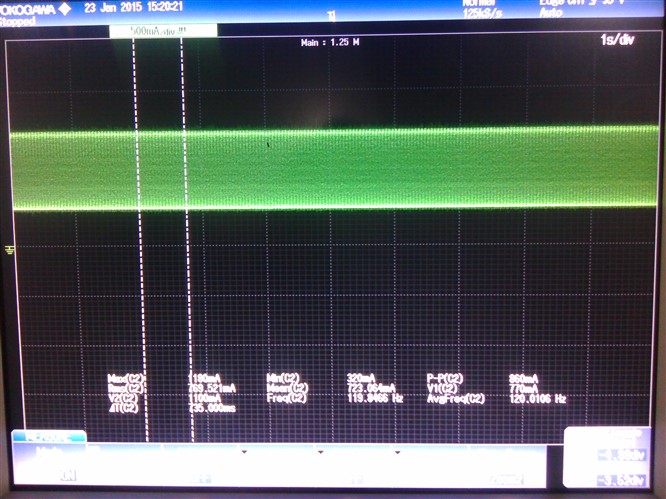
3: Output Current Curve at 60 Hz at 1s/div
4: Output Current Curve at 60 Hz at 20ms/div
Concern:
1. Why at 60Hz line frequency Output Luman switching curve following Sinusoidal wave form and why it is not at 50Hz line frequency?
2. Why Output Current & Voltage wave forms are not following the same pattern of Lumen Curve.( by the way , pattern of Output Voltage and current wave form are same )
3. Why the Lumen Fluctuation at 60Hz is more than the 50Hz? Lumen Fluctuation at 60 Hz is 7000 Lumen where as at 50 Hz the fluctuation is 100 Lumen Max).
Please let me know if you need any more information...
With Regards
Nitin Gupta
Nitin:
Are you doing power factor correction? If you are doing single stage power factor corrrection, you will see a sine wave ripple twice the line frequency. I measured the LED current ripple frequency of the scope shot. I was about 80Hz. So the ripple may not be caused by power factor correction. It could be the control loop is not stable and it osccilates at 80Hz. Please adjust the loop to see if the osscilation goes away.
I can not answer you the question why the LED lumen changes over time even the system power remains relative constant. I think the LED supplier can better help you on this.
David Zhang
Dear Zhang,
Can you please share your personal Email ID. I want to share the Schematic of the design to know which component we have to change to make the frequency with in a range.
With Regards
Nitin