This thread has been locked.

If you have a related question, please click the "Ask a related question" button in the top right corner. The newly created question will be automatically linked to this question.

TPS61022: a section of inductance current that is not consistent with the rising trend waveform

Part Number: TPS61022

Hi 

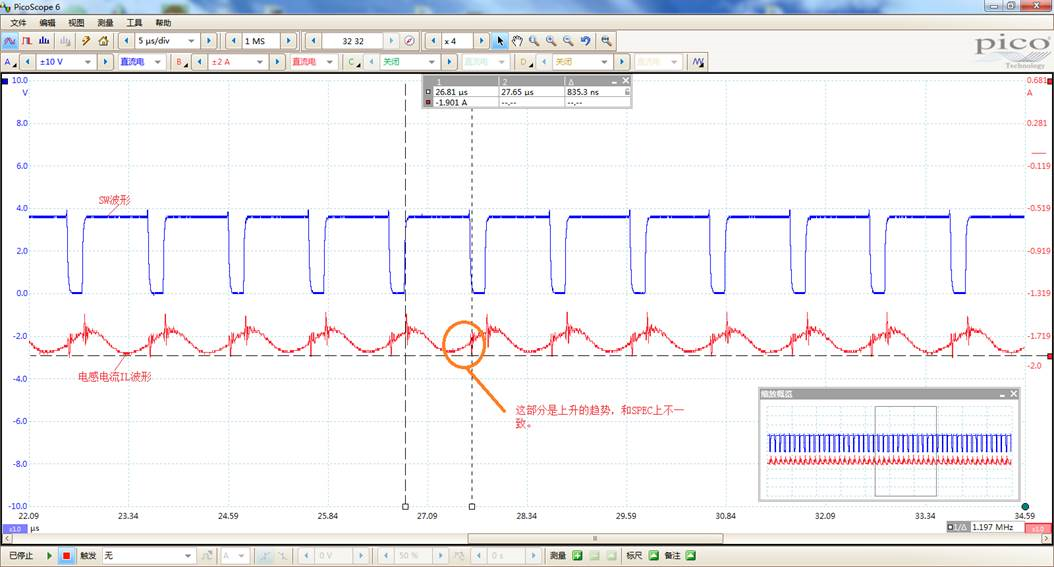
In the EVM board test,  the load current is about 1.4A, the input current is about 1.7A, VIN=3V, VOUT= 3.6v, we found that SW is A high time, marked in the figure, there is A segment of inductance current in the middle of the rising trend, which is inconsistent with the waveform on SEPC.

Please help to check the reason. The difference is that the output on SPEC is 3A, and we output 1.4A, thank you!

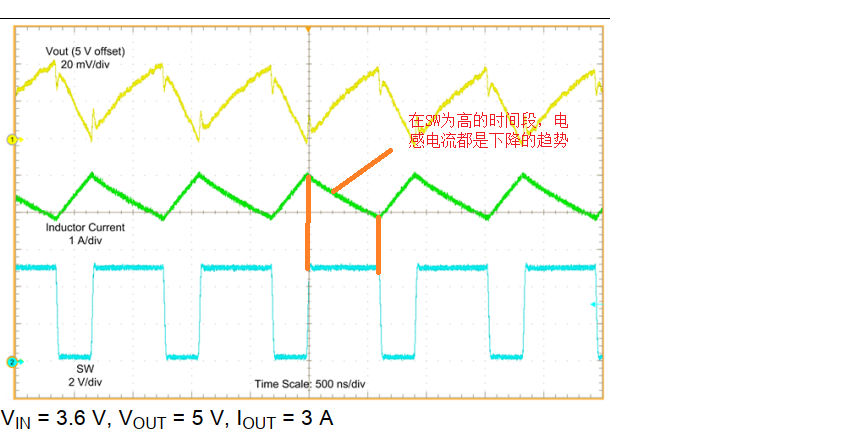
By comparing the inductance current and SW waveform at the output of 3A on SEPC, it can be seen that when SW is high, the inductance current has a downward trend.

  • Hi Melina,

    May I know the meaning of SEPC? And how do you get the figure 1?

    For boost converter, when low side switch turns on, SW pin equals 0, voltage across inductor is Vin so energy is stored in inductor. When low switch turns off, high side switch turns on, SW pin equals Vout and voltage across inductor is Vin-Vo. Since Vo is higher than Vin, inductor current begins decreasing until next switching period.

  • Hi Zack

    SEPC means datasheet.The image taken from an oscilloscope.

    The blue line represents the SW pin waveform, and the red line represents the inductive current, which is measured using the current probe.

    The question is SW is high voltage, why does the waveform of inductive current have an upward trend?it related to the input and output current?

  • Hi Melina,

    What's the sample rate of oscilloscope and current probe bandwidth?

    It the bandwidth is not high enough, the real current waveform could not be captured.