This thread has been locked.

If you have a related question, please click the "Ask a related question" button in the top right corner. The newly created question will be automatically linked to this question.

AM6442: XDS560 Trace with CCS on Linux

Part Number: AM6442
Other Parts Discussed in Thread: CCSTUDIO

Hi,

I have installed CCS 10.3.1 and connected XDS560v2 to out custom board. I'm developing on Linux Mint.

I try to get some trace functions to running. But nothing works and (as always with TI) no proper documentation available!

What I tried:

- select MCU (R5 Core) , go to Code Analyzer->Core Trace

     -> I get a new window, but there is no content at all! (just a white page)

- go to Tools-> RTOS Analyzer->Execution Analyzer, a config window appears. But I cannot configure anything. Error: UIA Config missing... Whats that? How to configure? Do I need this??

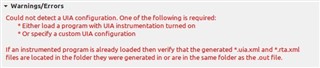
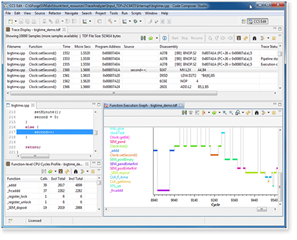
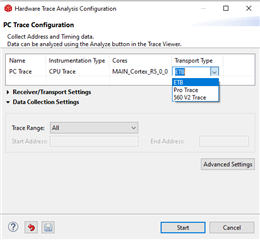
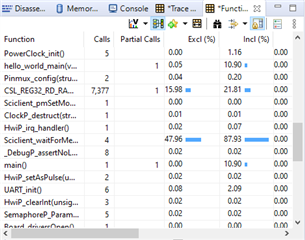
I also tried to run hardware trace analyzer with function profiling. But there I get the error:

Is there a documentation to configure 4bit trace of xds560 with MCU+SDK and Linux CCS???

Kind regards

Andreas

  • Hi Andreas,  trace is not supported at this time and not sure when it will get enabled.  There is support for real-time object view but not trace.  If you need trace you would need to consider a 3rd party solution like Lauterbach 

  • Hi Arnon, thanks for your answer.

    Is it just not supported on Linux or in general with AM64xx (AM24xx) and CCS?

    A collegue had something running, but we are not sure if it was real trace data or the real-time objects from the OS.

    Kind regards

    Andreas

  • My understanding was this is a general statement, not just for Linux - but let me check.  

  • Hi,

    See some docs:

    https://www.ti.com/lit/pdf/spruhm7

    Trace capability is present, but unknown how to enable it.

    Regards,

    Alexey

  • Trace was available when CCS had a licence based paid subscription enabled.

  • Hi Alexey, Arnon,

    we need to show the 4-PIn trace capability with XDS560 using Sitara EVM.

    Let's take the "howto" internally and come back with final statement,

    regards

    Karim

  • Hi Andreas,

    My solution works with 2-pin Trace Probe on CCS v10.3.1

    So:

    1. CCS just loaded, started. EVM boot should be in debug mode. Start required script to initilize all peripherals.

    2. Selected project must be successfully compiled. Load compiled program (.out) to selected CPU core.

    3. Debug execution cursor should be in program entry point (main() func). Choose starting and stopping brakepoints (for trace collection).

    4. Run program up to starting brakepoint.

    5. Activate trace collection (Tools->Hardware Trace Analizer->PC Trace). Choose transport type (560 V2 or else) according to acctual trace probe variant.

    6. Press Start. Trace Viewer is in collection enable state. Run code until it reaches next breakpoint.  

    7. Trace data is collected, adiititonal statistical graphs can be viewed by pressing Analize buttion on the top left Trace Viewer window.

    Trace activation

    Regards,

    Alexey

  • Kamil,

    Do we need to show trace capability with Cortex-A53 cores? They are not supported for debug and trace on AM64x for now. Additionally double precision FP instructions of Cortex-R5 are not decoded correctly on CCS 10.3.1.

    Regards,

    Alexey 

  • Hi Alexey,

    we need to show 4-Pin Trace capability with R5F cores running freeRTOS.

    Please send me an email (internal) in case you still have questions.

    regards

    Karim

  • XDS560v2 Issues:
    When selecting XDS560V2 STM USB Emulator in TargetConfig Window and clicking on test connection it does not check if connection works.
    Which XDS560 has to be selected for the Spectrum Digital 560v2 ProTrace?? Any documentation available which is not 11 years old?!!!!

    Output after 10 minutes!!!
    #############################################################################
    [Start: Spectrum Digital XDS560V2 STM USB Emulator_0]
    Execute the command:
    %ccs_base%/common/uscif/dbgjtag -f %boarddatafile% -rv -o -F inform,logfile=yes -S pathlength -S integrity
    [Result]
    -----[Print the board config pathname(s)]------------------------------------
    /home/zeilera/.ti/ccs1031/0/0/BrdDat/testBoard.dat
    -----[Print the reset-command software log-file]-----------------------------
    This utility has selected a 560/2xx-class product.
    This utility will load the program 'sd560v2u.out'.
    sem_timedwait errno 110
    E_RPCENV_IO_ERROR(-6) No connection: DTC_IO_Open::dtc_conf
    Download failed for file /home/zeilera/ti/ccs1031/ccs/ccs_base/common/uscif/./xds560v2.out
    An error occurred while soft opening the controller.
    -----[An error has occurred and this utility has aborted]--------------------
    This error is generated by TI's USCIF driver or utilities.
    The value is '-250' (0xffffff06).
    The title is 'SC_ERR_ECOM_EMUNAME'.
    The explanation is:
    An attempt to access the debug probe via USCIF ECOM has failed.
    [End: Spectrum Digital XDS560V2 STM USB Emulator_0]
    ##################################################################################


    I already managed to debug (NOT TRACE!!!) with xds560 but know nothing works. I just installed new ccs 10.4 version.
    And I try to run connection test with it. In all CCS versions the xds560 server had to be killed manually and CCS does not react.

    When running sd560v2config.jar GUI it lists the XDS560v2 STM. But CCS always has Problems.

  • Hi Andreas,

    This test connection error is due to a bug in CCS 10.3.1 and has been fixed in the 10.4 release. I'm checking with the CCS team to provide guidance on running Trace and will get back to you. 

    Regards,
    Sahin

  • Depending on your connection with the receiver: "Spectrum Digital XDSPRO USB Emulator" or "Spectrum Digital XDSPRO LAN Emulator".  One of these connections should be specified in your target configuration if you are using a Pro Trace receiver.

    The XDSPRO is a super-set of the XDS560v2, so you will have success debugging with an XDSPRO connection using an XDS560v2 target configuration, but you will not be able to trace over pins.  

  • Here are the recent problems I got with xds560 on linux mint 19.3. This is a copy of the email correspondence with oliver and karim.

    ### Sent: Friday, July 30, 2021 4:05 PM

    here are some Infos for your Trace Team. Please forward it.


    I created a LinuxTrace folder and dropped some new log files and error images into.


    The TI-trace folder contains 3 soctune logs. The oldest one was messed up. I made a connection test from targetConfig, which was successful, but CCS wasn't responding anymore.


    All runs have been made with :

    export MIPI60_MAP=CTI20
    export TI_TRACE_LOGGING=6


    The other logs (which are bigger) have some amount of data.


    2.8MB log: I started directly targetConfig and debugger was connecting successfully to SoC. I initialized the SoC by running launch script and then selected SoCAnalysis->CoreTrace. After a minute or more I got the error shown in trace001_error.jpg.


    3.4MB log: I started directly targetConfig and debugger was connecting successfully to SoC. I connected and disconnected to R5_0_0 and disconnected again. I initialized the SoC by running launch script, loaded FW ELF File and then selected SoCAnalysis->CoreTrace. After a minute or more I got the error shown in trace002_error.jpg which was a different error. When trying to run the target anyway CCS crashes.


    I also added the output of the console window where I started ccstudio.

    ####Sent: Monday, August 2, 2021 9:49 AM (REPLY ON QUESTIONS)

    > Is Linux running on a VM or  physical machine?

    Runs native on physical machine. (NO VM)


    >Try a different USB port on the computer.

    I did this during our session on wednesday. I can check another USB cable…


    >Try the same XDS560PRO unit that was working on Windows

    I will try the other XDS560 from Jochen. This week.

    ####Sent: Wednesday, August 4, 2021 10:22 AM

    here are some new infos about Trace. Please forward this to your Trace Team.
     
    (also contains old files.)
     
    I written down all steps I made in file ccs_trace_steps.txt. The files .TI_trace... contain mostly the same files as I think I forgot to delete the .TI_trace folder before installing ccs freshly. The main difference is the fresh ccs 10.4 installation.
    The file xds560_targetConfig.jpg shows the config of my xds560.
     
    I will change back to my xds560 as the problem still appears with "any" xds560.

    #### from ccs_trace_steps.txt (in box.com):

    Checked Tracer from Jochen (which was running on Windows)

    -same error as in picture trace002_error.jpg

    -all other debuggers removed

    -used usb in the back of pc (USB2.0, but Tracer has USB2 anyway)

     Deinstalled all ccs versions and installed ccs10.4 freshly with newest

    ti_emupack_setup_9.5.0.00136_linux_x86_64-2021-07-28_04.34.27.bin

    Started ./ccstudio with envvars "export TI_TRACE_LOGGING=6" and "export MIPI60_MAP=CTI20".

    Setup a new target config (not in default folder) and made a "Test Connection". This was successful, but as well as all other times,

    ccs did not respond anymore. Even after several minutes. Restarted ccs.

     moved to usb hub (usb3.0)

    restarted ccs. run "test Connection" again. After successful "Test Connection" CCS was still working!

    Started TargetConfig and run launch script by hand using loadJSFile(). After this I loaded the FW binary.

    Then selected R5F_0_0->CodeAnalysis->CoreTrace. After some seconds I got the error in "trace001_error.jpg".

    CCS still working. Closed CCS.

     Restarted Tracer and BNI Board, started ccs with env. Started TargetConfig and launch script. CoreTrace Window was loaded

    and showed configuration options. after clicking OK and several seconds trace002_error.jpg appeared. No FW binary loaded.

    Restart CCS with only "export MIPI60_MAP=CTI20" set. Restarted Tracer and Board. Started TargetConfig and launch script.

    After selecting the trace options I got the same error as in trace002_error.jpg.

    ###

    ###

    ###Sent: Friday, August 13, 2021 5:47 AM
    I checked again with Jochens debugger. I also used his complete setup with usb cable and MIPI60 to cTI connector. Always the same errors. The errors are always different on the same setup. The only thing I do here is to launch the target config again.
    I also tried it on our linux build server which runs ubuntu 16.04. After I added a line in udev rules I got a connection. But also here same errors when starting core trace.
    I also did not made any changes to my usb environment.

    ### From Oliver Sohm on Mo, 16.08.2021 18:46

    Thanks for trying these different scenarios.
     
    We were actually able to success fully collect trace with CCS 10.4.0 on a Mint 19.3 distro (VM) using an XDS ProTrace pod connected to the 60-pin MIPI header on our AM243x EVM. I uploaded a video showing this.
     
    The above was without the ti_emupack_setup_9.5.0.00136_linux_x86_64-2021-07-28_04.34.27.bin and without the cTI20 adapter. I don’t really think that these differences are the root cause, but if you can try re-installing CCS 10.4 on  your Linux box without the emupack patch and upload the trace logs.  I don’t expect this to calibrate but would like to see the error message in this case.
     
    If this still doesn’t give us any clues we may have to do another webex debug session.
     
    Thanks,
    Oliver