This thread has been locked.

If you have a related question, please click the "Ask a related question" button in the top right corner. The newly created question will be automatically linked to this question.

TDA4VM: How to test the DDR bandwidth by ctoolslib

Part Number: TDA4VM
Other Parts Discussed in Thread: DRA829, , SYSBIOS

Hi, 

I want to monitor DDR bankwidth (sdk7.1)  by ctoolslib_J721E_DRA829_TDA4VM_v0.2 .

How to implement CTools lib's source code to  a part of the Linux os? I try to run prebuild tool example_ddr_cpt2_tbr.a72.out on a72 linux, but it failed

root@j7-evm:/mnt# ./example_ddr_cpt2_tbr.a72.out 

Illegal instruction
And I recompile cpt2_ddr_example.c, it failed too
root@j7-evm:/mnt# ./ddr_test 
Opening CPT2 probe...
Segmentation fault
Thanks
Alex Xin
  • Hi Alex,

    I try to run prebuild tool example_ddr_cpt2_tbr.a72.out on a72 linux, but it failed

    Is this something you picked from the SDK? If yes can you share the path?

    - Keerthy

  • Hi Keerthy

    The ctoolslib_J721E_DRA829_TDA4VM_v0.2 download from 

    https://software-dl.ti.com/emulation/esd/ctoolslib_k3/CToolsLib_K3_download.html

    and example_ddr_cpt2_tbr.a72.out local in ctoolslib_J721E_DRA829_TDA4VM_v0.2\build\dra8x9\lib\ 

    Alex

  • Hi Alex,

    Thanks for those links. I will follow up internally & get the information from the experts..

    Best Regards,
    Keerthy

  • Alex,

    The ".out" files are full programs. They are not something that can be loaded on an A72 that is running Linux.  They are an example application that contains an RTOS and makes calls to the cToolsLib libraries.  You would use a tool such as Code Composer Studio to load these applications.  You can then run them and they will capture the data to the onchip trace buffer.  

    The source code to these applications is provided as reference so that the appropriate libraries calls can be integrated into your own application.

    Regards,

    John

  • Hi John

    Can I use ctoolslib on A72 Linux or on r5 sysbios direct and do not use Code Composer Studio, is there relevant examples?

    Thanks

    Alex

  • Alex,

    The libraries can be used without Code Composer Studio. 

    The package includes the libraries, pre-built example applications and source code.  The pre-built examples can be run to see the functionality working.  The source is provided as a reference for then integrating into your own application.  I am not aware of any Linux examples.

    Regards,

    John

  • Hi John

    I try to run DDR Benchmarking Example on mcu r5, but it got stuck after call CPT2_open.

    And I found an exception occurs while r5 to access 0x90060000 address(map to COMPUTE_CLUSTER0_AGGR1(0x4c301a0000)  to read module probe id.

    The function call flow as follows:

    CPT2_open->verify_module_id->CPT2_READ_PROBE_ID->READ_MEM_32

    Where can I see more detailed description of COMPUTE_CLUSTER0_AGGR1, i do not find it from trm.

    Thanks

    Alex

  • Alex,

    I have looped in a couple of trace experts and hopefully they can help get you going.

    Regards,

    John

  • Hi John

    Is there feedback from internal?

    Thanks

    Alex

  • Alex,

    Nothing yet but one of the team should be replying soon.

    John

  • Alex,

    Lots of back and forth internally amongst the team trying to figure this out.  Nothing concrete yet but they are working on it.

    John

  • Hi Alex,

    COMPUTE_CLUSTER0_AGGR1 refers to the MSMC1 trace aggregator that has the DDR probe (probe 0) . It's mentioned in the TRM in Table 6-1 as "CPTracer 1" with start address 0x0018 0000. It corresponds to #define MSMC1_CPT2_BADDR (0x4C30180000) in ctoolslib_J721E_DRA829_TDA4VM_v0.2\build\dra8x9\device.h.

    Did you re-built the example? If yes, have you made any modifications to the project settings or code?

    The address mapping of 0x90060000  to 0x4c301a0000 is correct - it is the base address of the eCpTracer2_DDR_Probe. 

    Would you be able to check if you can access 0x4c301a0000 in the DAP System memory view in CCS? See the screenshot below. Open the Memory Browser from the View menu on the CS_DAP_0 node (to make the node visible you have to right click in the Debug view and choose "Show all cores"). You should see a valid value there. The 0x282 in the upper half identifies this register space as a CPTracer2 probe. Please let me know what value you are seeing, or if there are any error messages in the Memory Browser or the Console.

    Thanks,

    Oliver

  • Hi Oliver,

    Now, I can monitor ddr bandwidth by read read EMIF counter, but there are some problems also.

    The EMIF counter are correct when I access ddr from A72/C71, but when I access ddr from R5 or C66, the EMIF counter will be magnified, for example, I memset 0x9000000 addr (20MB) to zero, but about 160M bytes were transferred, as shown in the figure below

    On C71/A72,  about 20M bytes were transferred

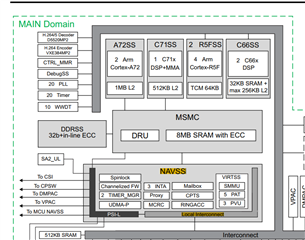
    I learned from TRM that the ddr access path of A72/C71 and C66/R5F are diffent, Is this correct ?

    Thanks

    Alex

  • Hi Alex,

    Can you help me with the commands that you ran? Did you use Linux or vision_apps to run the test?

    Please help us on how to reproduce the above?

    - Keerthy

  • Hi Keerthy

    Refer to vision_apps/utils/perf_stats, and migrate to our code , as follow

    static void ddr_read_counters(UINT32 *val0, UINT32 *val1, UINT32 *val2, UINT32 *val3)
    {
        static UINT32 is_first_time = 1;
        static volatile UINT32 *cnt_sel = (volatile UINT32 *)0x02980100;
        static volatile UINT32 *cnt0    = (volatile UINT32 *)0x02980104;
        static volatile UINT32 *cnt1    = (volatile UINT32 *)0x02980108;
        static volatile UINT32 *cnt2    = (volatile UINT32 *)0x0298010C;
        static volatile UINT32 *cnt3    = (volatile UINT32 *)0x02980110;
        static volatile UINT32 last_cnt0 = 0, last_cnt1 = 0, last_cnt2 = 0, last_cnt3 = 0;
        volatile UINT32 cur_cnt0, cur_cnt1, cur_cnt2, cur_cnt3;
        UINT32 diff_cnt0, diff_cnt1, diff_cnt2, diff_cnt3;
    
        if(is_first_time) {
            is_first_time = 0;
    
            /* cnt0 is counting reads, cnt1 is counting writes, cnt2, cnt3 not used */
            *cnt_sel = (PERF_DDR_STATS_CTR0 <<  0u) |
                       (PERF_DDR_STATS_CTR1 <<  8u) |
                       (PERF_DDR_STATS_CTR2 << 16u) |
                       (PERF_DDR_STATS_CTR3 << 24u);
    
            last_cnt0 = *cnt0;
            last_cnt1 = *cnt1;
            last_cnt2 = *cnt2;
            last_cnt3 = *cnt3;
        }
    
        cur_cnt0 = *cnt0;
        cur_cnt1 = *cnt1;
        cur_cnt2 = *cnt2;
        cur_cnt3 = *cnt3;
        
        if(cur_cnt0 < last_cnt0) 
            diff_cnt0 = (0xFFFFFFFFu - last_cnt0) + cur_cnt0; /* wrap around case */
        else    
            diff_cnt0 = cur_cnt0 - last_cnt0;
    
        debug("last_count0 = %d, count0 = %d, diff count0 = %d\n", last_cnt0, cur_cnt0, diff_cnt0 );
        
        if(cur_cnt1 < last_cnt1)        
            diff_cnt1 = (0xFFFFFFFFu - last_cnt1) + cur_cnt1; /* wrap around case */
        else
            diff_cnt1 = cur_cnt1 - last_cnt1;
    
        debug("last_count1 = %d, count1 = %d, diff count1 = %d\n", last_cnt1, cur_cnt1, diff_cnt1 );
    
        if(cur_cnt2 < last_cnt2)        
            diff_cnt2 = (0xFFFFFFFFu - last_cnt2) + cur_cnt2; /* wrap around case */
        else
            diff_cnt2 = cur_cnt2 - last_cnt2;
    
        if(cur_cnt3 < last_cnt3)
            diff_cnt3 = (0xFFFFFFFFu - last_cnt3) + cur_cnt3;
        else
            diff_cnt3 = cur_cnt3 - last_cnt3;
    
        last_cnt0 = cur_cnt0;
        last_cnt1 = cur_cnt1;
        last_cnt2 = cur_cnt2;
        last_cnt3 = cur_cnt3;
    
        *val0 = (UINT32)diff_cnt0;
        *val1 = (UINT32)diff_cnt1;
        *val2 = (UINT32)diff_cnt2;
        *val3 = (UINT32)diff_cnt3;
    }
    
    static void fill_ddr_platform_diagnosis_status(platform_ddr_info_t* ddr)
    {
        UINT64 cur_time, read_bytes, write_bytes;
    	UINT32 elapsed_time;
    	UINT32 val0 = 0, val1 = 0, val2 = 0, val3 = 0;
    	static bool initlized = false;
    	ddr_load_object_t* obj = &ddr_load_obj;
    
    	if (!initlized) {
    		obj->ddr_info.read_bw_avg   = 0;
    	    obj->ddr_info.write_bw_avg  = 0;
    	    obj->ddr_info.read_bw_peak  = 0;
    	    obj->ddr_info.write_bw_peak = 0;
    	    obj->ddr_info.total_available_bw = PERF_DDR_MHZ * PERF_DDR_BUS_WIDTH / 8;
    	    obj->total_time  = 0;
    	    obj->total_read  = 0;
    	    obj->total_write = 0;
    	    obj->last_timestamp = HAL_get_globalUs();
    	    obj->snapshot_count = PERF_SNAPSHOT_WINDOW_WIDTH;
    
    	    obj->ddr_info.counter0_total = 0;
    	    obj->ddr_info.counter1_total = 0;
    	    obj->ddr_info.counter2_total = 0;
    	    obj->ddr_info.counter3_total = 0;
    
    		initlized = true;
    		
    		return;
    	}
    		
        cur_time = HAL_get_globalUs();
    
        if(cur_time > obj->last_timestamp) {
    		elapsed_time = cur_time - obj->last_timestamp;
            if(elapsed_time == 0)
                elapsed_time = 1; /* to avoid divide by 0 */
                
            obj->total_time += elapsed_time;
    
            ddr_read_counters(&val0, &val1, &val2, &val3);
    
            write_bytes = val0 * PERF_DDR_BURST_SIZE_BYTES;
            read_bytes  = val1 * PERF_DDR_BURST_SIZE_BYTES;
    
            obj->total_read  += read_bytes;
            obj->total_write += write_bytes;
    		
            obj->ddr_info.read_bw_avg  = (obj->total_read / obj->total_time); /* in MB/s */
            obj->ddr_info.write_bw_avg = (obj->total_write /obj->total_time); /* in MB/s */
    		
            UINT32 read_bw_peak  = read_bytes / elapsed_time; /* in MB/s */
            UINT32 write_bw_peak = write_bytes / elapsed_time; /* in MB/s */
    
    		obj->ddr_info.read_bw_recently  = read_bw_peak;
    		obj->ddr_info.write_bw_recently = write_bw_peak;
            
            if(read_bw_peak > obj->ddr_info.read_bw_peak)
                obj->ddr_info.read_bw_peak = read_bw_peak;
            if(write_bw_peak > obj->ddr_info.write_bw_peak)
                obj->ddr_info.write_bw_peak = write_bw_peak;
    
            obj->ddr_info.counter0_total += val2;
            obj->ddr_info.counter1_total += val3;
    
            obj->snapshot_count -= elapsed_time;
    
            if(obj->snapshot_count <= 0) {
                obj->ddr_info.counter0_total = 0;
                obj->ddr_info.counter1_total = 0;
    
                obj->snapshot_count = PERF_SNAPSHOT_WINDOW_WIDTH;
            }
    
    		memcpy(ddr, &obj->ddr_info, sizeof(platform_ddr_info_t));		            
    	}			
    
    	obj->last_timestamp = cur_time;
    
        debug("DDR: read_bytes = %lld, write_bytes = %lld, elapsed_time = %d\n", 
        	read_bytes, write_bytes, elapsed_time);
    
        debug("DDR: READ  BW: AVG = %6d MB/s, PEAK = %6d MB/s\n",
            ddr->read_bw_avg, ddr->read_bw_peak);
        debug("DDR: WRITE BW: AVG = %6d MB/s, PEAK = %6d MB/s\n",
            ddr->write_bw_avg, ddr->write_bw_peak);	        
        debug("Recently DDR BW: READ : %6d MB/s, WRITE : %6d MB/s, TOTAL: %6d MB/s\n\n",
            ddr->read_bw_recently, ddr->write_bw_recently, ddr->read_bw_recently + ddr->write_bw_recently);	        
    
    }
    

     The function fill_ddr_platform_diagnosis_status will run every 1s on mcu3_0 to monitor ddr bandwidth.

     And A72/C71/R5F run memcpy/memset to access ddr (no-cache region) .

    Thanks

    Alex

  • Alex,

    Can you try running your DDR profiler on MCU3_0 and run the memset test on MCU2_1?

    Regards,
    Shyam

  • Hi Shyam

    Described earlier are running the DDR profiler on MCU3_0 and the memset test on MCU2_1/A72/C660

    Thanks

    Alex

  • Hi, 

    I  monitor ddr bandwidth by read write/read command every 1s. And how to convert to bytes ? 

    Refer to vision_apps/utils/perf_stats, rw bytes =  rw command * 64,

    on a72/c71 cpu, it is correct, but on r5/c66, it seems wrong, so how convert to bytes according rw command on r5/c66 ? 

    Thanks

    Alex