


Hello,
I currently try to investigate the performance of code running on one of the R5F cores using the PMU. The code itself is running from MSMC RAM.
While debugging with Lauterbach TRACE32, I've noticed an unexpected high rate of instruction stall cycles (event counter 0x40).
I then added the following test code to report the ratio of instruction stall cycles related to the overall number of executed cycles:
Init code:
/* setup PMU counters */
CSL_armR5PmuCfgCntr(0, CSL_ARM_R5_PMU_EVENT_TYPE_ICACHE_STALL);
CSL_armR5PmuCfgCntr(1, CSL_ARM_R5_PMU_EVENT_TYPE_CYCLE_CNT);
CSL_armR5PmuEnableAllCntrs(1);
Measurement code:
/* reset counters and enable them */
CSL_armR5PmuSetCntr(0,0); /* instruction stall */
CSL_armR5PmuSetCntr(1,0); /* cycle count */
CSL_armR5PmuEnableCntr(0, 1);
CSL_armR5PmuEnableCntr(1, 1);

// ... code for which the ratio is measured ...

/* get percentages of stall cylces because instruction buffer cannot deliver an instruction */
IStallCount = CSL_armR5PmuReadCntr(0);
CycleCount  = CSL_armR5PmuReadCntr(1);
lStallRatio = ((IStallCount) * 100) / CycleCount;
I then transmit IStallRatio via CAN to be independent to the debugger.
When the processor is running, the ratio is always around 1%. But when I halt the R5F with the debugger, the ratio goes up to ~60%. This even happens if the breakpoint is outside the code where the performance counters are active.
The breakpoint also effects code that runs long after the the core has been released, as it can be seen in the following CAN recording:
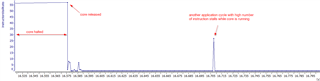
The 60% peak at the beginning is the breakpoint itself. After releasing the CPU, the ratio goes down to ~1%. The delayed peak is caused by code that is only executed every 500ms, so its exact delay depends on the point in time when I halted the core.
I see exactly the same peaks when activating the instruction cache miss counter (event 0x01), so it looks like the debugger causes a complete instruction cache invalidation.
For the breakpoint itself it would be somehow understandable. But why does this also affects code which is not related to the breakpoint?
The behavior is exactly the same no matter if I use the regular JTAG debugger or the PowerTrace / ETM debug interface. There is also no difference if the breakpoints are implemented as "Soft" or "Onchip". When running completely without debugger, I've never seen such an unexpected rise of instruction cache misses.
So the question is, why does a debug halt affect the instruction cache of code not related to the breakpoint? How big is the impact on the runtime data measured via trace / ETM?
And is this a general behavior of the debugger (also on the A72), or is it only related to the R5F?
Best regards
Thomas


