This thread has been locked.

If you have a related question, please click the "Ask a related question" button in the top right corner. The newly created question will be automatically linked to this question.

TMDSIDK574: Generating Code Coverage on Code Composer Studio

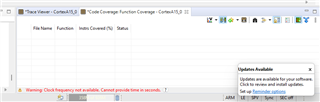
Part Number: TMDSIDK574


I am currently using Version: 10.4.0.00006. Whenever I used the Code Coverage Function, my IDE hangs.

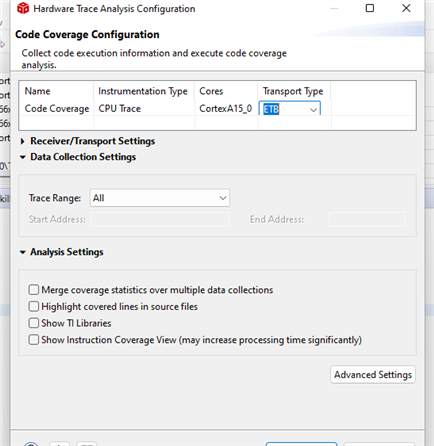
Data Collection Settings Trace Range: All

Are there any settings that needs to be set for this to work?
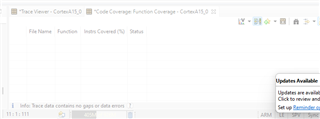
  • Hello,

    Can you enable debug server logging and then reproduce the issue? Please zip up and attach the generated log to this thread.

    https://software-dl.ti.com/ccs/esd/documents/ccs_diagnostic-logs.html

    Thanks

    ki

  • Hi Ki, attached is the generated log. Thanks.

    Edit:
    for some unknown reasons: I can't upload a file here on e2e. Here is the debug log. 

  • Thanks. 

    Which debug probe are you using? The onboard XDS100v2 or are you using an external debug probe?

  • Hi, I am using XDS100v2

  • When exactly does the hang first happen? I can reproduce the hang when I try to shut down the trace session. When do you see it?

  • I am able to start trace and collect trace/coverage data using the A15 ETB with CCS 10.4. Are you able to collect any data before the hang?

  • no I wasn't able to collect any data before the hang. are there any things that I need to do? based from the logs I sent, were you able to see the reason why mine is hanging? I also tried with an older version of Code Compose Studio 10 and it also hangs.

    I tried with function profiling and I saw that worked. However, I need the coverage data.

  • I tried with function profiling and I saw that worked. However, I need the coverage data.

    This is interesting because in regards to trace collection, both function profiling and code coverage rely on the same underlying method to collect the raw data. Hence it is not actual trace that is an issue but the coverage view. 

    Can you go to your workspace folder and delete the 'dvt' subfolder in there and then try again?

    Thanks

    ki

  • Hi Ki, Thanks for the reply.

    I deleted the dvt subfolder and it still hangs on code coverage.

    I tried this on CCS 10.4 (newly installed) and CCS 10.1 and Code Coverage hangs and doesn't work on both versions.  However, the function profiler works on both version.

    Before I start the code coverage, it gives me a warning Clock Frequency not available. Cannot provide time in seconds.

    Once I run it, I can see that it stops on the next breakpoint, but the CCS program isn't responding, There will be an info on the Code Coverage View: Info: Trace data contains no gaps or data errors.

    Are there some other things that I could try?

  • Can you:

    Start CCS with a clean new workspace folder.

    Reproduce the issue with Debug Server logging enabled.

    Zip up this new log and attach to this thread.

    Also zip up the Eclipse error log (<WORKSPACE>/.metadata/.log) and attach to this thread.

    Thanks

    ki

  • Hi,

    I followed the instructions and here are the zipped files (I placed it on OneDrive as for some reason, file attachment doesn't work here, maybe there is a limitation on the file size?)

    Here is the Debug Server Log <link removed>

    Here is the Log inside the MetaData folder  <link removed>

    Let me know, if you can access the files. Otherwise, I can send it via email as well.

    Thanks!

  • Thanks, I was able to access the files. The logs are currently being investigated by engineering. I will pass on any updates as I receive them.

  • Sorry for the delay. Engineering is still going through the logs. As soon as I get an update, I'll let you know

  • Unfortunately the logs did not reveal much useful information.

    Can you also provide a trace log?

    https://software-dl.ti.com/ccs/esd/documents/ccs_diagnostic-logs.html#ctools-trace-logging

    And would it possible to provide the actual program executable?

  • Hi Ki,

    Here is the trace log with the test "Hello World" source code used to test and program executable

    <link removed>

  • Sorry, but Ki is out today.  He will see your post on Monday.

    Thanks and regards,

    -George

  • Thanks, I was able to download the zip.

    Please note that most file share sites like onedrive, google drive, dropbox, etc are block by my company server. I need to make a special request to get temporary access each time. This slows things down a bit. In the future, ff you can simply attach the zip directly to this thread, that would be very helpful. Thanks

    ki

  • Would it be possible to try CCS 11.2? It will be good to confirm if the same issue occurs for you with the current release.

  • Hi,

    I just downloaded the latest version v12 and I created a new hello world project for AM574x and I got these errors while uploading to the IDK574x.

    CortexA15_0: GEL Output: --->>> PRUSS 1 and 2 Initialization is in progress ... <<<---
    CortexA15_0: GEL Output: --->>> PRUSS 1 and 2 Initialization is in complete ... <<<---
    CortexA15_0: File Loader: Verification failed: Values at address 0x00000020 do not match Please verify target memory and memory map.
    CortexA15_0: GEL: File: C:\Users\abc\workspace_v12\helloworld\Debug\helloworld.out: a data verification error occurred, file load failed.

    Just to ensure my hardware is ok, I tried to load a helloworld on v10.4 and I was able to upload it successfully.

  • CortexA15_0: File Loader: Verification failed: Values at address 0x00000020 do not match Please verify target memory and memory map.
    CortexA15_0: GEL: File: C:\Users\abc\workspace_v12\helloworld\Debug\helloworld.out: a data verification error occurred, file load failed.

    You are getting some sort of data verification error. Please see the below link for more details:

    https://dev.ti.com/tirex/explore/node?node=APy2XbLelxyqBB2Yz0WR.w__FUz-xrs__LATEST

    Likely some of the startup GEL files used by the device have been updated since 10.4. This could be a potential place to look.

    ki