Part Number: TDA4VM
HI Expert
Question
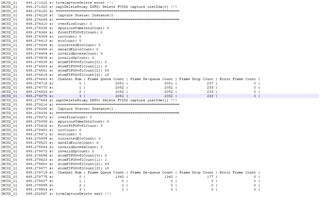
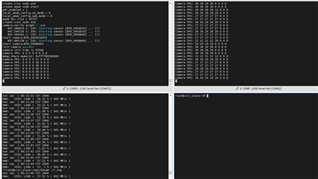
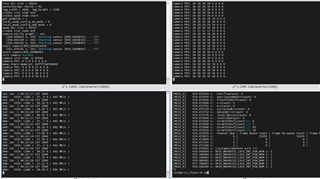
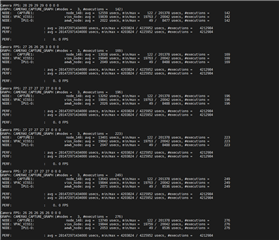
1: is there any debug method to check the ISP occupancy and usage?
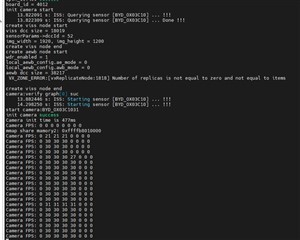
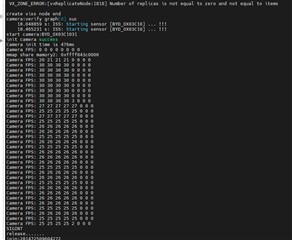
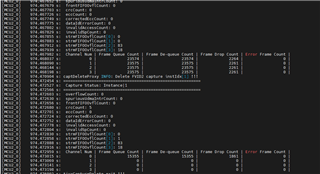
2: We use a 5-channel 2m camera (1920*1200*raw12). It is found that the frame rate is less than 30fps, and 4 channels are normal. Our calculation bandwidth is sufficient. Experts are required to give explanations. Thank you.