This thread has been locked.

If you have a related question, please click the "Ask a related question" button in the top right corner. The newly created question will be automatically linked to this question.

TDA4VM: yolov5s compiled by TIDL segmentation fault

Part Number: TDA4VM


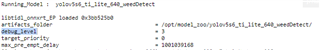
When I export a yolov5s.pt by export.py and compile the yolov5s.onnx by TIDL onnxrt_ep.py with yolov5s.prototxt, a Segmentation fault will raise. Show as below.

However, the onnx is not exported by export.py, for example, downloaded from yolov5s6_640_ti_lite_37p4_56p0.onnx, then the TIDL will compile it well, WHY??

As the Debug flow, this bug is report from ↓ in onnxrt_ep.py in edgeai-tidl-toolsexamples/osrt_python/ort

```

EP_list = ['TIDLExecutionProvider','CPUExecutionProvider']
sess = rt.InferenceSession(config['model_path'] ,providers=EP_list, provider_options=[delegate_options, {}], sess_options=so)

```

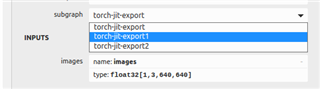
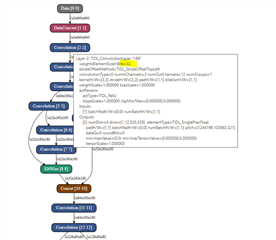
Appendix: yolov5s6 NN model onnx file with protobuf file.

onnx.rar

  • Hi,

     Did you make all the changes as mentioned here: https://github.com/TexasInstruments/edgeai-yolov5

    Can you please share the onnx model that you tried compiling? 

    Regards, Debapriya

  • Hi Debapriya,

    Yes, I completely follow the operation order according to the readme.md

    I have attached the onnx model with protobuf file in the post, please check it, thanks.

    Best regards, 

  • Hi,

    I missed the attachment. Thanks for sharing. Let me have a look.

    Regards, Debapriya

  • Hi,

    As I can see in this model, there are multiple subgraphs. This is an issue with pytorch1.10. If you can move to pytorch1.7 and reexport the model, that will solve this issue,

    Please cross-check upon export that you have a single graph as in the model shared by us. L

    Regards, Debapriya

  • Yes, it works! But I replaced the pytorch1.10 with pytorch1.8.1 since the pytorch1.7 is not torch.fx. Thanks!

    I have one more question, how to quantize the Yolov5? I follow the instruction in: 

    But there ara some issues.

  • Hi ,

    Can you please share the exact compile options that you have used?  That is I would like to know what are the value of delegate_options in line#170 of onnxrt_ep.py.

    It is possible to get close to float accuracy with Post-training quantization and mixed-precision for YOLOv5 models on the COCO dataset.  Once you share the delegate_options, We can set the exact parameters to get good accuracy.

    Reards, Debapriya

  • yolov5s6_640_ti_lite_37p4_56p0.rar

    Here is the outcome after the compile, and it can infer using onnxrt_ep.py without the -c option.

    However, when I deploy it to the TDA4, the app_edgeai.py will raise TIDL graph verifying exception. Those errors are shown as follows:

  • Hi, 

    About the TIDL graph verifying exception, I did some search in the forum, and find out that vx_app_arm_remote_log is needed, so now I attach it too.

    [MCU2_0]      3.647248 s: CIO: Init ... Done !!!
    [MCU2_0]      3.647365 s: APP: Init ... !!!
    [MCU2_0]      3.647391 s: SCICLIENT: Init ... !!!
    [MCU2_0]      3.647658 s: SCICLIENT: DMSC FW version [22.1.1--v2022.01 (Terrific Llam]
    [MCU2_0]      3.647704 s: SCICLIENT: DMSC FW revision 0x16  
    [MCU2_0]      3.647738 s: SCICLIENT: DMSC FW ABI revision 3.1
    [MCU2_0]      3.647788 s: SCICLIENT: Init ... Done !!!
    [MCU2_0]      3.647819 s: UDMA: Init ... !!!
    [MCU2_0]      3.649158 s: UDMA: Init ... Done !!!
    [MCU2_0]      3.649222 s: MEM: Init ... !!!
    [MCU2_0]      3.649265 s: MEM: Created heap (DDR_SHARED_MEM, id=0, flags=0x00000004) @ d9000000 of size 16777216 bytes !!!
    [MCU2_0]      3.649342 s: MEM: Created heap (L3_MEM, id=1, flags=0x00000000) @ 3600000 of size 262144 bytes !!!
    [MCU2_0]      3.649403 s: MEM: Init ... Done !!!
    [MCU2_0]      3.649428 s: IPC: Init ... !!!
    [MCU2_0]      3.649488 s: IPC: 6 CPUs participating in IPC !!!
    [MCU2_0]      3.649536 s: IPC: Waiting for HLOS to be ready ... !!!
    [MCU2_0]     15.137371 s: IPC: HLOS is ready !!!
    [MCU2_0]     15.153014 s: IPC: Init ... Done !!!
    [MCU2_0]     15.153088 s: APP: Syncing with 5 CPUs ... !!!
    [MCU2_0]     15.628889 s: APP: Syncing with 5 CPUs ... Done !!!
    [MCU2_0]     15.629115 s: REMOTE_SERVICE: Init ... !!!
    [MCU2_0]     15.630784 s: REMOTE_SERVICE: Init ... Done !!!
    [MCU2_0]     15.630847 s: FVID2: Init ... !!!
    [MCU2_0]     15.630925 s: FVID2: Init ... Done !!!
    [MCU2_0]     15.630958 s: VHWA: VPAC Init ... !!!
    [MCU2_0]     15.630986 s: SCICLIENT: Sciclient_pmSetModuleState module=290 state=2
    [MCU2_0]     15.631542 s: SCICLIENT: Sciclient_pmSetModuleState success
    [MCU2_0]     15.631580 s: VHWA: LDC Init ... !!!
    [MCU2_0]     15.638543 s: VHWA: LDC Init ... Done !!!
    [MCU2_0]     15.638609 s: VHWA: MSC Init ... !!!
    [MCU2_0]     15.652933 s: VHWA: MSC Init ... Done !!!
    [MCU2_0]     15.652996 s: VHWA: NF Init ... !!!
    [MCU2_0]     15.654972 s: VHWA: NF Init ... Done !!!
    [MCU2_0]     15.655036 s: VHWA: VISS Init ... !!!
    [MCU2_0]     15.665608 s: VHWA: VISS Init ... Done !!!
    [MCU2_0]     15.665679 s: VHWA: VPAC Init ... Done !!!
    [MCU2_0]     15.665728 s:  VX_ZONE_INIT:Enabled
    [MCU2_0]     15.665760 s:  VX_ZONE_ERROR:Enabled
    [MCU2_0]     15.665799 s:  VX_ZONE_WARNING:Enabled
    [MCU2_0]     15.667018 s:  VX_ZONE_INIT:[tivxPlatformCreateTargetId:54] Added target IPU1-0 
    [MCU2_0]     15.667280 s:  VX_ZONE_INIT:[tivxPlatformCreateTargetId:54] Added target VPAC_NF 
    [MCU2_0]     15.667509 s:  VX_ZONE_INIT:[tivxPlatformCreateTargetId:54] Added target VPAC_LDC1 
    [MCU2_0]     15.667731 s:  VX_ZONE_INIT:[tivxPlatformCreateTargetId:54] Added target VPAC_MSC1 
    [MCU2_0]     15.667971 s:  VX_ZONE_INIT:[tivxPlatformCreateTargetId:54] Added target VPAC_MSC2 
    [MCU2_0]     15.668288 s:  VX_ZONE_INIT:[tivxPlatformCreateTargetId:54] Added target VPAC_VISS1 
    [MCU2_0]     15.668561 s:  VX_ZONE_INIT:[tivxPlatformCreateTargetId:54] Added target CAPTURE1 
    [MCU2_0]     15.668840 s:  VX_ZONE_INIT:[tivxPlatformCreateTargetId:54] Added target CAPTURE2 
    [MCU2_0]     15.669107 s:  VX_ZONE_INIT:[tivxPlatformCreateTargetId:54] Added target DISPLAY1 
    [MCU2_0]     15.669371 s:  VX_ZONE_INIT:[tivxPlatformCreateTargetId:54] Added target DISPLAY2 
    [MCU2_0]     15.669612 s:  VX_ZONE_INIT:[tivxPlatformCreateTargetId:54] Added target CSITX 
    [MCU2_0]     15.669902 s:  VX_ZONE_INIT:[tivxPlatformCreateTargetId:54] Added target CAPTURE3 
    [MCU2_0]     15.670203 s:  VX_ZONE_INIT:[tivxPlatformCreateTargetId:54] Added target CAPTURE4 
    [MCU2_0]     15.670485 s:  VX_ZONE_INIT:[tivxPlatformCreateTargetId:54] Added target CAPTURE5 
    [MCU2_0]     15.670758 s:  VX_ZONE_INIT:[tivxPlatformCreateTargetId:54] Added target CAPTURE6 
    [MCU2_0]     15.671055 s:  VX_ZONE_INIT:[tivxPlatformCreateTargetId:54] Added target CAPTURE7 
    [MCU2_0]     15.671307 s:  VX_ZONE_INIT:[tivxPlatformCreateTargetId:54] Added target CAPTURE8 
    [MCU2_0]     15.671543 s:  VX_ZONE_INIT:[tivxPlatformCreateTargetId:54] Added target DSS_M2M1 
    [MCU2_0]     15.671782 s:  VX_ZONE_INIT:[tivxPlatformCreateTargetId:54] Added target DSS_M2M2 
    [MCU2_0]     15.672352 s: APP: OpenVX Target kernel init ... !!!
    [MCU2_0]     15.693445 s: APP: OpenVX Target kernel init ... Done !!!
    [MCU2_0]     15.693499 s: UDMA Copy: Init ... !!!
    [MCU2_0]     15.695304 s: UDMA Copy: Init ... Done !!!
    [MCU2_0]     15.695397 s: APP: Init ... Done !!!
    [MCU2_0]     15.695434 s: APP: Run ... !!!
    [MCU2_0]     15.695460 s: IPC: Starting echo test ...
    [MCU2_0]     15.698365 s: APP: Run ... Done !!!
    [MCU2_0]     15.699841 s: IPC: Echo status: mpu1_0[x] mcu2_0[s] mcu2_1[.] C66X_1[P] C66X_2[.] C7X_1[.] 
    [MCU2_0]     15.699960 s: IPC: Echo status: mpu1_0[x] mcu2_0[s] mcu2_1[P] C66X_1[P] C66X_2[.] C7X_1[.] 
    [MCU2_0]     15.700052 s: IPC: Echo status: mpu1_0[x] mcu2_0[s] mcu2_1[P] C66X_1[P] C66X_2[P] C7X_1[.] 
    [MCU2_0]     15.700146 s: IPC: Echo status: mpu1_0[x] mcu2_0[s] mcu2_1[P] C66X_1[P] C66X_2[P] C7X_1[P] 
    [MCU2_1]      3.665445 s: CIO: Init ... Done !!!
    [MCU2_1]      3.665511 s: ### CPU Frequency = 1000000000 Hz
    [MCU2_1]      3.665550 s: APP: Init ... !!!
    [MCU2_1]      3.665575 s: SCICLIENT: Init ... !!!
    [MCU2_1]      3.665821 s: SCICLIENT: DMSC FW version [22.1.1--v2022.01 (Terrific Llam]
    [MCU2_1]      3.665871 s: SCICLIENT: DMSC FW revision 0x16  
    [MCU2_1]      3.665905 s: SCICLIENT: DMSC FW ABI revision 3.1
    [MCU2_1]      3.665940 s: SCICLIENT: Init ... Done !!!
    [MCU2_1]      3.665967 s: UDMA: Init ... !!!
    [MCU2_1]      3.667320 s: UDMA: Init ... Done !!!
    [MCU2_1]      3.667381 s: MEM: Init ... !!!
    [MCU2_1]      3.667422 s: MEM: Created heap (DDR_SHARED_MEM, id=0, flags=0x00000004) @ da000000 of size 16777216 bytes !!!
    [MCU2_1]      3.667493 s: MEM: Created heap (L3_MEM, id=1, flags=0x00000001) @ 3640000 of size 262144 bytes !!!
    [MCU2_1]      3.667551 s: MEM: Init ... Done !!!
    [MCU2_1]      3.667575 s: IPC: Init ... !!!
    [MCU2_1]      3.667634 s: IPC: 6 CPUs participating in IPC !!!
    [MCU2_1]      3.667679 s: IPC: Waiting for HLOS to be ready ... !!!
    [MCU2_1]     15.613260 s: IPC: HLOS is ready !!!
    [MCU2_1]     15.628774 s: IPC: Init ... Done !!!
    [MCU2_1]     15.628839 s: APP: Syncing with 5 CPUs ... !!!
    [MCU2_1]     15.628887 s: APP: Syncing with 5 CPUs ... Done !!!
    [MCU2_1]     15.628924 s: REMOTE_SERVICE: Init ... !!!
    [MCU2_1]     15.630775 s: REMOTE_SERVICE: Init ... Done !!!
    [MCU2_1]     15.630839 s: FVID2: Init ... !!!
    [MCU2_1]     15.630911 s: FVID2: Init ... Done !!!
    [MCU2_1]     15.630944 s: VHWA: DMPAC: Init ... !!!
    [MCU2_1]     15.630982 s: SCICLIENT: Sciclient_pmSetModuleState module=48 state=2
    [MCU2_1]     15.631450 s: SCICLIENT: Sciclient_pmSetModuleState success
    [MCU2_1]     15.631489 s: SCICLIENT: Sciclient_pmSetModuleState module=305 state=2
    [MCU2_1]     15.631980 s: SCICLIENT: Sciclient_pmSetModuleState success
    [MCU2_1]     15.632016 s: VHWA: DOF Init ... !!!
    [MCU2_1]     15.642158 s: VHWA: DOF Init ... Done !!!
    [MCU2_1]     15.642221 s: VHWA: SDE Init ... !!!
    [MCU2_1]     15.646137 s: VHWA: SDE Init ... Done !!!
    [MCU2_1]     15.646195 s: VHWA: DMPAC: Init ... Done !!!
    [MCU2_1]     15.646241 s:  VX_ZONE_INIT:Enabled
    [MCU2_1]     15.646272 s:  VX_ZONE_ERROR:Enabled
    [MCU2_1]     15.646298 s:  VX_ZONE_WARNING:Enabled
    [MCU2_1]     15.647475 s:  VX_ZONE_INIT:[tivxPlatformCreateTargetId:54] Added target DMPAC_SDE 
    [MCU2_1]     15.647719 s:  VX_ZONE_INIT:[tivxPlatformCreateTargetId:54] Added target DMPAC_DOF 
    [MCU2_1]     15.647956 s:  VX_ZONE_INIT:[tivxPlatformCreateTargetId:54] Added target IPU1-1 
    [MCU2_1]     15.648024 s:  VX_ZONE_INIT:[tivxInitLocal:130] Initialization Done !!!
    [MCU2_1]     15.648061 s: APP: OpenVX Target kernel init ... !!!
    [MCU2_1]     15.648360 s: APP: OpenVX Target kernel init ... Done !!!
    [MCU2_1]     15.648402 s: UDMA Copy: Init ... !!!
    [MCU2_1]     15.650878 s: UDMA Copy: Init ... Done !!!
    [MCU2_1]     15.650942 s: APP: Init ... Done !!!
    [MCU2_1]     15.650980 s: APP: Run ... !!!
    [MCU2_1]     15.651005 s: IPC: Starting echo test ...
    [MCU2_1]     15.653571 s: APP: Run ... Done !!!
    [MCU2_1]     15.654816 s: IPC: Echo status: mpu1_0[x] mcu2_0[x] mcu2_1[s] C66X_1[P] C66X_2[.] C7X_1[.] 
    [MCU2_1]     15.654932 s: IPC: Echo status: mpu1_0[x] mcu2_0[x] mcu2_1[s] C66X_1[P] C66X_2[P] C7X_1[.] 
    [MCU2_1]     15.655040 s: IPC: Echo status: mpu1_0[x] mcu2_0[x] mcu2_1[s] C66X_1[P] C66X_2[P] C7X_1[P] 
    [MCU2_1]     15.699155 s: IPC: Echo status: mpu1_0[x] mcu2_0[P] mcu2_1[s] C66X_1[P] C66X_2[P] C7X_1[P] 
    [C6x_1 ]      3.732310 s: CIO: Init ... Done !!!
    [C6x_1 ]      3.732336 s: ### CPU Frequency = 1350000000 Hz
    [C6x_1 ]      3.732346 s: APP: Init ... !!!
    [C6x_1 ]      3.732354 s: SCICLIENT: Init ... !!!
    [C6x_1 ]      3.732564 s: SCICLIENT: DMSC FW version [22.1.1--v2022.01 (Terrific Llam]
    [C6x_1 ]      3.732578 s: SCICLIENT: DMSC FW revision 0x16  
    [C6x_1 ]      3.732587 s: SCICLIENT: DMSC FW ABI revision 3.1
    [C6x_1 ]      3.732597 s: SCICLIENT: Init ... Done !!!
    [C6x_1 ]      3.732606 s: UDMA: Init ... !!!
    [C6x_1 ]      3.734028 s: UDMA: Init ... Done !!!
    [C6x_1 ]      3.734048 s: MEM: Init ... !!!
    [C6x_1 ]      3.734061 s: MEM: Created heap (DDR_SHARED_MEM, id=0, flags=0x00000004) @ dc000000 of size 16777216 bytes !!!
    [C6x_1 ]      3.734078 s: MEM: Created heap (L2_MEM, id=2, flags=0x00000001) @ 800000 of size 229376 bytes !!!
    [C6x_1 ]      3.734093 s: MEM: Created heap (DDR_SCRATCH_MEM, id=4, flags=0x00000001) @ dd000000 of size 50331648 bytes !!!
    [C6x_1 ]      3.734109 s: MEM: Init ... Done !!!
    [C6x_1 ]      3.734117 s: IPC: Init ... !!!
    [C6x_1 ]      3.734139 s: IPC: 6 CPUs participating in IPC !!!
    [C6x_1 ]      3.734153 s: IPC: Waiting for HLOS to be ready ... !!!
    [C6x_1 ]     14.329930 s: IPC: HLOS is ready !!!
    [C6x_1 ]     14.333737 s: IPC: Init ... Done !!!
    [C6x_1 ]     14.333770 s: APP: Syncing with 5 CPUs ... !!!
    [C6x_1 ]     15.628887 s: APP: Syncing with 5 CPUs ... Done !!!
    [C6x_1 ]     15.628901 s: REMOTE_SERVICE: Init ... !!!
    [C6x_1 ]     15.629516 s: REMOTE_SERVICE: Init ... Done !!!
    [C6x_1 ]     15.629556 s:  VX_ZONE_INIT:Enabled
    [C6x_1 ]     15.629567 s:  VX_ZONE_ERROR:Enabled
    [C6x_1 ]     15.629576 s:  VX_ZONE_WARNING:Enabled
    [C6x_1 ]     15.630287 s:  VX_ZONE_INIT:[tivxInitLocal:130] Initialization Done !!!
    [C6x_1 ]     15.630305 s: APP: OpenVX Target kernel init ... !!!
    [C6x_1 ]     15.630714 s: APP: OpenVX Target kernel init ... Done !!!
    [C6x_1 ]     15.630741 s: UDMA Copy: Init ... !!!
    [C6x_1 ]     15.634835 s: UDMA Copy: Init ... Done !!!
    [C6x_1 ]     15.634854 s: APP: Init ... Done !!!
    [C6x_1 ]     15.636070 s: APP: Run ... !!!
    [C6x_1 ]     15.636082 s: IPC: Starting echo test ...
    [C6x_1 ]     15.637203 s: APP: Run ... Done !!!
    [C6x_1 ]     15.637544 s: IPC: Echo status: mpu1_0[x] mcu2_0[x] mcu2_1[x] C66X_1[s] C66X_2[.] C7X_1[P] 
    [C6x_1 ]     15.637579 s: IPC: Echo status: mpu1_0[x] mcu2_0[x] mcu2_1[x] C66X_1[s] C66X_2[P] C7X_1[P] 
    [C6x_1 ]     15.654550 s: IPC: Echo status: mpu1_0[x] mcu2_0[x] mcu2_1[P] C66X_1[s] C66X_2[P] C7X_1[P] 
    [C6x_1 ]     15.699009 s: IPC: Echo status: mpu1_0[x] mcu2_0[P] mcu2_1[P] C66X_1[s] C66X_2[P] C7X_1[P] 
    [C6x_2 ]      3.823706 s: CIO: Init ... Done !!!
    [C6x_2 ]      3.823733 s: ### CPU Frequency = 1350000000 Hz
    [C6x_2 ]      3.823744 s: APP: Init ... !!!
    [C6x_2 ]      3.823752 s: SCICLIENT: Init ... !!!
    [C6x_2 ]      3.823981 s: SCICLIENT: DMSC FW version [22.1.1--v2022.01 (Terrific Llam]
    [C6x_2 ]      3.823993 s: SCICLIENT: DMSC FW revision 0x16  
    [C6x_2 ]      3.824003 s: SCICLIENT: DMSC FW ABI revision 3.1
    [C6x_2 ]      3.824013 s: SCICLIENT: Init ... Done !!!
    [C6x_2 ]      3.824022 s: UDMA: Init ... !!!
    [C6x_2 ]      3.825463 s: UDMA: Init ... Done !!!
    [C6x_2 ]      3.825484 s: MEM: Init ... !!!
    [C6x_2 ]      3.825498 s: MEM: Created heap (DDR_SHARED_MEM, id=0, flags=0x00000004) @ e0000000 of size 16777216 bytes !!!
    [C6x_2 ]      3.825515 s: MEM: Created heap (L2_MEM, id=2, flags=0x00000001) @ 800000 of size 229376 bytes !!!
    [C6x_2 ]      3.825530 s: MEM: Created heap (DDR_SCRATCH_MEM, id=4, flags=0x00000001) @ e1000000 of size 50331648 bytes !!!
    [C6x_2 ]      3.825546 s: MEM: Init ... Done !!!
    [C6x_2 ]      3.825554 s: IPC: Init ... !!!
    [C6x_2 ]      3.825578 s: IPC: 6 CPUs participating in IPC !!!
    [C6x_2 ]      3.825593 s: IPC: Waiting for HLOS to be ready ... !!!
    [C6x_2 ]     14.435667 s: IPC: HLOS is ready !!!
    [C6x_2 ]     14.439277 s: IPC: Init ... Done !!!
    [C6x_2 ]     14.439307 s: APP: Syncing with 5 CPUs ... !!!
    [C6x_2 ]     15.628887 s: APP: Syncing with 5 CPUs ... Done !!!
    [C6x_2 ]     15.628902 s: REMOTE_SERVICE: Init ... !!!
    [C6x_2 ]     15.629532 s: REMOTE_SERVICE: Init ... Done !!!
    [C6x_2 ]     15.629569 s:  VX_ZONE_INIT:Enabled
    [C6x_2 ]     15.629580 s:  VX_ZONE_ERROR:Enabled
    [C6x_2 ]     15.629590 s:  VX_ZONE_WARNING:Enabled
    [C6x_2 ]     15.630306 s:  VX_ZONE_INIT:[tivxInitLocal:130] Initialization Done !!!
    [C6x_2 ]     15.630323 s: APP: OpenVX Target kernel init ... !!!
    [C6x_2 ]     15.630703 s: APP: OpenVX Target kernel init ... Done !!!
    [C6x_2 ]     15.630728 s: UDMA Copy: Init ... !!!
    [C6x_2 ]     15.634699 s: UDMA Copy: Init ... Done !!!
    [C6x_2 ]     15.634718 s: APP: Init ... Done !!!
    [C6x_2 ]     15.635956 s: APP: Run ... !!!
    [C6x_2 ]     15.635966 s: IPC: Starting echo test ...
    [C6x_2 ]     15.637011 s: APP: Run ... Done !!!
    [C6x_2 ]     15.637357 s: IPC: Echo status: mpu1_0[x] mcu2_0[x] mcu2_1[x] C66X_1[x] C66X_2[s] C7X_1[P] 
    [C6x_2 ]     15.637546 s: IPC: Echo status: mpu1_0[x] mcu2_0[x] mcu2_1[x] C66X_1[P] C66X_2[s] C7X_1[P] 
    [C6x_2 ]     15.654572 s: IPC: Echo status: mpu1_0[x] mcu2_0[x] mcu2_1[P] C66X_1[P] C66X_2[s] C7X_1[P] 
    [C6x_2 ]     15.699033 s: IPC: Echo status: mpu1_0[x] mcu2_0[P] mcu2_1[P] C66X_1[P] C66X_2[s] C7X_1[P] 
    [C7x_1 ]      4.398682 s: CIO: Init ... Done !!!
    [C7x_1 ]      4.398696 s: ### CPU Frequency = 1000000000 Hz
    [C7x_1 ]      4.398707 s: APP: Init ... !!!
    [C7x_1 ]      4.398715 s: SCICLIENT: Init ... !!!
    [C7x_1 ]      4.398932 s: SCICLIENT: DMSC FW version [22.1.1--v2022.01 (Terrific Llam]
    [C7x_1 ]      4.398947 s: SCICLIENT: DMSC FW revision 0x16  
    [C7x_1 ]      4.398957 s: SCICLIENT: DMSC FW ABI revision 3.1
    [C7x_1 ]      4.398968 s: SCICLIENT: Init ... Done !!!
    [C7x_1 ]      4.398977 s: UDMA: Init ... !!!
    [C7x_1 ]      4.400067 s: UDMA: Init ... Done !!!
    [C7x_1 ]      4.400078 s: MEM: Init ... !!!
    [C7x_1 ]      4.400089 s: MEM: Created heap (DDR_SHARED_MEM, id=0, flags=0x00000004) @ 100000000 of size 268435456 bytes !!!
    [C7x_1 ]      4.400110 s: MEM: Created heap (L3_MEM, id=1, flags=0x00000001) @ 70020000 of size 8159232 bytes !!!
    [C7x_1 ]      4.400128 s: MEM: Created heap (L2_MEM, id=2, flags=0x00000001) @ 64800000 of size 458752 bytes !!!
    [C7x_1 ]      4.400145 s: MEM: Created heap (L1_MEM, id=3, flags=0x00000001) @ 64e00000 of size 16384 bytes !!!
    [C7x_1 ]      4.400162 s: MEM: Created heap (DDR_SCRATCH_MEM, id=4, flags=0x00000001) @ e4000000 of size 385875968 bytes !!!
    [C7x_1 ]      4.400180 s: MEM: Init ... Done !!!
    [C7x_1 ]      4.400188 s: IPC: Init ... !!!
    [C7x_1 ]      4.400201 s: IPC: 6 CPUs participating in IPC !!!
    [C7x_1 ]      4.400216 s: IPC: Waiting for HLOS to be ready ... !!!
    [C7x_1 ]     14.762495 s: IPC: HLOS is ready !!!
    [C7x_1 ]     14.764438 s: IPC: Init ... Done !!!
    [C7x_1 ]     14.764453 s: APP: Syncing with 5 CPUs ... !!!
    [C7x_1 ]     15.628889 s: APP: Syncing with 5 CPUs ... Done !!!
    [C7x_1 ]     15.628905 s: REMOTE_SERVICE: Init ... !!!
    [C7x_1 ]     15.629058 s: REMOTE_SERVICE: Init ... Done !!!
    [C7x_1 ]     15.629080 s:  VX_ZONE_INIT:Enabled
    [C7x_1 ]     15.629090 s:  VX_ZONE_ERROR:Enabled
    [C7x_1 ]     15.629100 s:  VX_ZONE_WARNING:Enabled
    [C7x_1 ]     15.629290 s:  VX_ZONE_INIT:[tivxPlatformCreateTargetId:59] Added target DSP_C7-1 
    [C7x_1 ]     15.629380 s:  VX_ZONE_INIT:[tivxPlatformCreateTargetId:59] Added target DSP_C7-1_PRI_2 
    [C7x_1 ]     15.629474 s:  VX_ZONE_INIT:[tivxPlatformCreateTargetId:59] Added target DSP_C7-1_PRI_3 
    [C7x_1 ]     15.629548 s:  VX_ZONE_INIT:[tivxPlatformCreateTargetId:59] Added target DSP_C7-1_PRI_4 
    [C7x_1 ]     15.629626 s:  VX_ZONE_INIT:[tivxPlatformCreateTargetId:59] Added target DSP_C7-1_PRI_5 
    [C7x_1 ]     15.629739 s:  VX_ZONE_INIT:[tivxPlatformCreateTargetId:59] Added target DSP_C7-1_PRI_6 
    [C7x_1 ]     15.629803 s:  VX_ZONE_INIT:[tivxPlatformCreateTargetId:59] Added target DSP_C7-1_PRI_7 
    [C7x_1 ]     15.629865 s:  VX_ZONE_INIT:[tivxPlatformCreateTargetId:59] Added target DSP_C7-1_PRI_8 
    [C7x_1 ]     15.629887 s:  VX_ZONE_INIT:[tivxInitLocal:130] Initialization Done !!!
    [C7x_1 ]     15.629899 s: APP: OpenVX Target kernel init ... !!!
    [C7x_1 ]     15.630086 s: APP: OpenVX Target kernel init ... Done !!!
    [C7x_1 ]     15.630099 s: APP: Init ... Done !!!
    [C7x_1 ]     15.630108 s: APP: Run ... !!!
    [C7x_1 ]     15.630117 s: IPC: Starting echo test ...
    [C7x_1 ]     15.630270 s: APP: Run ... Done !!!
    [C7x_1 ]     15.637363 s: IPC: Echo status: mpu1_0[x] mcu2_0[x] mcu2_1[x] C66X_1[.] C66X_2[P] C7X_1[s] 
    [C7x_1 ]     15.637544 s: IPC: Echo status: mpu1_0[x] mcu2_0[x] mcu2_1[x] C66X_1[P] C66X_2[P] C7X_1[s] 
    [C7x_1 ]     15.654596 s: IPC: Echo status: mpu1_0[x] mcu2_0[x] mcu2_1[P] C66X_1[P] C66X_2[P] C7X_1[s] 
    [C7x_1 ]     15.699083 s: IPC: Echo status: mpu1_0[x] mcu2_0[P] mcu2_1[P] C66X_1[P] C66X_2[P] C7X_1[s] 
    [C7x_1 ]    913.614284 s:  VX_ZONE_ERROR:[tivxAlgiVisionCreate:316] Calling ialg.algInit failed with status = -1111
    [C7x_1 ]    913.614482 s:  VX_ZONE_ERROR:[tivxKernelTIDLCreate:659] tivxAlgiVisionCreate returned NULL
    [C7x_1 ]    914.169149 s:  VX_ZONE_ERROR:[tivxAlgiVisionCreate:316] Calling ialg.algInit failed with status = -1111
    [C7x_1 ]    914.169347 s:  VX_ZONE_ERROR:[tivxKernelTIDLCreate:659] tivxAlgiVisionCreate returned NULL
    [C7x_1 ]    915.164496 s:  VX_ZONE_ERROR:[tivxAlgiVisionCreate:316] Calling ialg.algInit failed with status = -1111
    [C7x_1 ]    915.164698 s:  VX_ZONE_ERROR:[tivxKernelTIDLCreate:659] tivxAlgiVisionCreate returned NULL
    [C7x_1 ]    916.169881 s:  VX_ZONE_ERROR:[tivxAlgiVisionCreate:316] Calling ialg.algInit failed with status = -1111
    [C7x_1 ]    916.170082 s:  VX_ZONE_ERROR:[tivxKernelTIDLCreate:659] tivxAlgiVisionCreate returned NULL
    [C7x_1 ]    917.164825 s:  VX_ZONE_ERROR:[tivxAlgiVisionCreate:316] Calling ialg.algInit failed with status = -1111
    [C7x_1 ]    917.165022 s:  VX_ZONE_ERROR:[tivxKernelTIDLCreate:659] tivxAlgiVisionCreate returned NULL
    [C7x_1 ]    918.164039 s:  VX_ZONE_ERROR:[tivxAlgiVisionCreate:316] Calling ialg.algInit failed with status = -1111
    [C7x_1 ]    918.164237 s:  VX_ZONE_ERROR:[tivxKernelTIDLCreate:659] tivxAlgiVisionCreate returned NULL
    [C7x_1 ]    919.164581 s:  VX_ZONE_ERROR:[tivxAlgiVisionCreate:316] Calling ialg.algInit failed with status = -1111
    [C7x_1 ]    919.164779 s:  VX_ZONE_ERROR:[tivxKernelTIDLCreate:659] tivxAlgiVisionCreate returned NULL
    [C7x_1 ]    920.163848 s:  VX_ZONE_ERROR:[tivxAlgiVisionCreate:316] Calling ialg.algInit failed with status = -1111
    [C7x_1 ]    920.164046 s:  VX_ZONE_ERROR:[tivxKernelTIDLCreate:659] tivxAlgiVisionCreate returned NULL
    [C7x_1 ]    921.170169 s:  VX_ZONE_ERROR:[tivxAlgiVisionCreate:316] Calling ialg.algInit failed with status = -1111
    [C7x_1 ]    921.170365 s:  VX_ZONE_ERROR:[tivxKernelTIDLCreate:659] tivxAlgiVisionCreate returned NULL
    [C7x_1 ]    922.163907 s:  VX_ZONE_ERROR:[tivxAlgiVisionCreate:316] Calling ialg.algInit failed with status = -1111
    [C7x_1 ]    922.164104 s:  VX_ZONE_ERROR:[tivxKernelTIDLCreate:659] tivxAlgiVisionCreate returned NULL
    [C7x_1 ]    923.164279 s:  VX_ZONE_ERROR:[tivxAlgiVisionCreate:316] Calling ialg.algInit failed with status = -1111
    [C7x_1 ]    923.164475 s:  VX_ZONE_ERROR:[tivxKernelTIDLCreate:659] tivxAlgiVisionCreate returned NULL
    [C7x_1 ]    924.164125 s:  VX_ZONE_ERROR:[tivxAlgiVisionCreate:316] Calling ialg.algInit failed with status = -1111
    [C7x_1 ]    924.164323 s:  VX_ZONE_ERROR:[tivxKernelTIDLCreate:659] tivxAlgiVisionCreate returned NULL
    [C7x_1 ]    925.164441 s:  VX_ZONE_ERROR:[tivxAlgiVisionCreate:316] Calling ialg.algInit failed with status = -1111
    [C7x_1 ]    925.164644 s:  VX_ZONE_ERROR:[tivxKernelTIDLCreate:659] tivxAlgiVisionCreate returned NULL
    [C7x_1 ]    926.169470 s:  VX_ZONE_ERROR:[tivxAlgiVisionCreate:316] Calling ialg.algInit failed with status = -1111
    [C7x_1 ]    926.169679 s:  VX_ZONE_ERROR:[tivxKernelTIDLCreate:659] tivxAlgiVisionCreate returned NULL
    [C7x_1 ]    927.164790 s:  VX_ZONE_ERROR:[tivxAlgiVisionCreate:316] Calling ialg.algInit failed with status = -1111
    [C7x_1 ]    927.164987 s:  VX_ZONE_ERROR:[tivxKernelTIDLCreate:659] tivxAlgiVisionCreate returned NULL
    [C7x_1 ]    928.163986 s:  VX_ZONE_ERROR:[tivxAlgiVisionCreate:316] Calling ialg.algInit failed with status = -1111
    [C7x_1 ]    928.164183 s:  VX_ZONE_ERROR:[tivxKernelTIDLCreate:659] tivxAlgiVisionCreate returned NULL
    [C7x_1 ]    929.164569 s:  VX_ZONE_ERROR:[tivxAlgiVisionCreate:316] Calling ialg.algInit failed with status = -1111
    [C7x_1 ]    929.164767 s:  VX_ZONE_ERROR:[tivxKernelTIDLCreate:659] tivxAlgiVisionCreate returned NULL
    [C7x_1 ]    930.163965 s:  VX_ZONE_ERROR:[tivxAlgiVisionCreate:316] Calling ialg.algInit failed with status = -1111
    [C7x_1 ]    930.164161 s:  VX_ZONE_ERROR:[tivxKernelTIDLCreate:659] tivxAlgiVisionCreate returned NULL
    [C7x_1 ]    931.164525 s:  VX_ZONE_ERROR:[tivxAlgiVisionCreate:316] Calling ialg.algInit failed with status = -1111
    [C7x_1 ]    931.164727 s:  VX_ZONE_ERROR:[tivxKernelTIDLCreate:659] tivxAlgiVisionCreate returned NULL
    [C7x_1 ]    932.163655 s:  VX_ZONE_ERROR:[tivxAlgiVisionCreate:316] Calling ialg.algInit failed with status = -1111
    [C7x_1 ]    932.163854 s:  VX_ZONE_ERROR:[tivxKernelTIDLCreate:659] tivxAlgiVisionCreate returned NULL
    [C7x_1 ]    933.164879 s:  VX_ZONE_ERROR:[tivxAlgiVisionCreate:316] Calling ialg.algInit failed with status = -1111
    [C7x_1 ]    933.165075 s:  VX_ZONE_ERROR:[tivxKernelTIDLCreate:659] tivxAlgiVisionCreate returned NULL
    [C7x_1 ]   3057.706412 s:  VX_ZONE_ERROR:[tivxAlgiVisionCreate:316] Calling ialg.algInit failed with status = -1111
    [C7x_1 ]   3057.706616 s:  VX_ZONE_ERROR:[tivxKernelTIDLCreate:659] tivxAlgiVisionCreate returned NULL
    [C7x_1 ]   3057.964210 s:  VX_ZONE_ERROR:[tivxAlgiVisionCreate:316] Calling ialg.algInit failed with status = -1111
    [C7x_1 ]   3057.964408 s:  VX_ZONE_ERROR:[tivxKernelTIDLCreate:659] tivxAlgiVisionCreate returned NULL
    [C7x_1 ]   3058.962802 s:  VX_ZONE_ERROR:[tivxAlgiVisionCreate:316] Calling ialg.algInit failed with status = -1111
    [C7x_1 ]   3058.963001 s:  VX_ZONE_ERROR:[tivxKernelTIDLCreate:659] tivxAlgiVisionCreate returned NULL
    [C7x_1 ]   3059.962705 s:  VX_ZONE_ERROR:[tivxAlgiVisionCreate:316] Calling ialg.algInit failed with status = -1111
    [C7x_1 ]   3059.962904 s:  VX_ZONE_ERROR:[tivxKernelTIDLCreate:659] tivxAlgiVisionCreate returned NULL
    [C7x_1 ]   3060.962645 s:  VX_ZONE_ERROR:[tivxAlgiVisionCreate:316] Calling ialg.algInit failed with status = -1111
    [C7x_1 ]   3060.962844 s:  VX_ZONE_ERROR:[tivxKernelTIDLCreate:659] tivxAlgiVisionCreate returned NULL
    [C7x_1 ]   3061.962575 s:  VX_ZONE_ERROR:[tivxAlgiVisionCreate:316] Calling ialg.algInit failed with status = -1111
    [C7x_1 ]   3061.962772 s:  VX_ZONE_ERROR:[tivxKernelTIDLCreate:659] tivxAlgiVisionCreate returned NULL
    [C7x_1 ]   3062.962446 s:  VX_ZONE_ERROR:[tivxAlgiVisionCreate:316] Calling ialg.algInit failed with status = -1111
    [C7x_1 ]   3062.962649 s:  VX_ZONE_ERROR:[tivxKernelTIDLCreate:659] tivxAlgiVisionCreate returned NULL
    [C7x_1 ]   3063.962608 s:  VX_ZONE_ERROR:[tivxAlgiVisionCreate:316] Calling ialg.algInit failed with status = -1111
    [C7x_1 ]   3063.962804 s:  VX_ZONE_ERROR:[tivxKernelTIDLCreate:659] tivxAlgiVisionCreate returned NULL
    [C7x_1 ]   3064.962403 s:  VX_ZONE_ERROR:[tivxAlgiVisionCreate:316] Calling ialg.algInit failed with status = -1111
    [C7x_1 ]   3064.962606 s:  VX_ZONE_ERROR:[tivxKernelTIDLCreate:659] tivxAlgiVisionCreate returned NULL
    [C7x_1 ]   3065.962522 s:  VX_ZONE_ERROR:[tivxAlgiVisionCreate:316] Calling ialg.algInit failed with status = -1111
    [C7x_1 ]   3065.962724 s:  VX_ZONE_ERROR:[tivxKernelTIDLCreate:659] tivxAlgiVisionCreate returned NULL
    [C7x_1 ]   3066.962847 s:  VX_ZONE_ERROR:[tivxAlgiVisionCreate:316] Calling ialg.algInit failed with status = -1111
    [C7x_1 ]   3066.963045 s:  VX_ZONE_ERROR:[tivxKernelTIDLCreate:659] tivxAlgiVisionCreate returned NULL
    [C7x_1 ]   3067.962590 s:  VX_ZONE_ERROR:[tivxAlgiVisionCreate:316] Calling ialg.algInit failed with status = -1111
    [C7x_1 ]   3067.962788 s:  VX_ZONE_ERROR:[tivxKernelTIDLCreate:659] tivxAlgiVisionCreate returned NULL
    [C7x_1 ]   3068.962518 s:  VX_ZONE_ERROR:[tivxAlgiVisionCreate:316] Calling ialg.algInit failed with status = -1111
    [C7x_1 ]   3068.962720 s:  VX_ZONE_ERROR:[tivxKernelTIDLCreate:659] tivxAlgiVisionCreate returned NULL
    [C7x_1 ]   3069.962406 s:  VX_ZONE_ERROR:[tivxAlgiVisionCreate:316] Calling ialg.algInit failed with status = -1111
    [C7x_1 ]   3069.962609 s:  VX_ZONE_ERROR:[tivxKernelTIDLCreate:659] tivxAlgiVisionCreate returned NULL
    [C7x_1 ]   3070.962690 s:  VX_ZONE_ERROR:[tivxAlgiVisionCreate:316] Calling ialg.algInit failed with status = -1111
    [C7x_1 ]   3070.962888 s:  VX_ZONE_ERROR:[tivxKernelTIDLCreate:659] tivxAlgiVisionCreate returned NULL
    [C7x_1 ]   3071.962390 s:  VX_ZONE_ERROR:[tivxAlgiVisionCreate:316] Calling ialg.algInit failed with status = -1111
    [C7x_1 ]   3071.962593 s:  VX_ZONE_ERROR:[tivxKernelTIDLCreate:659] tivxAlgiVisionCreate returned NULL
    [C7x_1 ]   3072.963112 s:  VX_ZONE_ERROR:[tivxAlgiVisionCreate:316] Calling ialg.algInit failed with status = -1111
    [C7x_1 ]   3072.963309 s:  VX_ZONE_ERROR:[tivxKernelTIDLCreate:659] tivxAlgiVisionCreate returned NULL
    [C7x_1 ]   3073.962435 s:  VX_ZONE_ERROR:[tivxAlgiVisionCreate:316] Calling ialg.algInit failed with status = -1111
    [C7x_1 ]   3073.962637 s:  VX_ZONE_ERROR:[tivxKernelTIDLCreate:659] tivxAlgiVisionCreate returned NULL
    [C7x_1 ]   3074.962721 s:  VX_ZONE_ERROR:[tivxAlgiVisionCreate:316] Calling ialg.algInit failed with status = -1111
    [C7x_1 ]   3074.962920 s:  VX_ZONE_ERROR:[tivxKernelTIDLCreate:659] tivxAlgiVisionCreate returned NULL
    [C7x_1 ]   3075.962704 s:  VX_ZONE_ERROR:[tivxAlgiVisionCreate:316] Calling ialg.algInit failed with status = -1111
    [C7x_1 ]   3075.962903 s:  VX_ZONE_ERROR:[tivxKernelTIDLCreate:659] tivxAlgiVisionCreate returned NULL
    [C7x_1 ]   3076.962748 s:  VX_ZONE_ERROR:[tivxAlgiVisionCreate:316] Calling ialg.algInit failed with status = -1111
    [C7x_1 ]   3076.962947 s:  VX_ZONE_ERROR:[tivxKernelTIDLCreate:659] tivxAlgiVisionCreate returned NULL
    [C7x_1 ]   3123.221738 s:  VX_ZONE_ERROR:[tivxAlgiVisionCreate:316] Calling ialg.algInit failed with status = -1111
    [C7x_1 ]   3123.221937 s:  VX_ZONE_ERROR:[tivxKernelTIDLCreate:659] tivxAlgiVisionCreate returned NULL
    [C7x_1 ]   3123.471524 s:  VX_ZONE_ERROR:[tivxAlgiVisionCreate:316] Calling ialg.algInit failed with status = -1111
    [C7x_1 ]   3123.471727 s:  VX_ZONE_ERROR:[tivxKernelTIDLCreate:659] tivxAlgiVisionCreate returned NULL
    [C7x_1 ]   3124.470178 s:  VX_ZONE_ERROR:[tivxAlgiVisionCreate:316] Calling ialg.algInit failed with status = -1111
    [C7x_1 ]   3124.470375 s:  VX_ZONE_ERROR:[tivxKernelTIDLCreate:659] tivxAlgiVisionCreate returned NULL
    [C7x_1 ]   3125.470512 s:  VX_ZONE_ERROR:[tivxAlgiVisionCreate:316] Calling ialg.algInit failed with status = -1111
    [C7x_1 ]   3125.470715 s:  VX_ZONE_ERROR:[tivxKernelTIDLCreate:659] tivxAlgiVisionCreate returned NULL
    [C7x_1 ]   3126.470432 s:  VX_ZONE_ERROR:[tivxAlgiVisionCreate:316] Calling ialg.algInit failed with status = -1111
    [C7x_1 ]   3126.470635 s:  VX_ZONE_ERROR:[tivxKernelTIDLCreate:659] tivxAlgiVisionCreate returned NULL
    [C7x_1 ]   3137.479171 s:  VX_ZONE_ERROR:[tivxAlgiVisionCreate:316] Calling ialg.algInit failed with status = -1111
    [C7x_1 ]   3137.479370 s:  VX_ZONE_ERROR:[tivxKernelTIDLCreate:659] tivxAlgiVisionCreate returned NULL
    [C7x_1 ]   3137.747807 s:  VX_ZONE_ERROR:[tivxAlgiVisionCreate:316] Calling ialg.algInit failed with status = -1111
    [C7x_1 ]   3137.748006 s:  VX_ZONE_ERROR:[tivxKernelTIDLCreate:659] tivxAlgiVisionCreate returned NULL
    [C7x_1 ]   3584.663777 s:  VX_ZONE_ERROR:[tivxAlgiVisionCreate:316] Calling ialg.algInit failed with status = -1111
    [C7x_1 ]   3584.663973 s:  VX_ZONE_ERROR:[tivxKernelTIDLCreate:659] tivxAlgiVisionCreate returned NULL
    [C7x_1 ]   3584.928388 s:  VX_ZONE_ERROR:[tivxAlgiVisionCreate:316] Calling ialg.algInit failed with status = -1111
    [C7x_1 ]   3584.928589 s:  VX_ZONE_ERROR:[tivxKernelTIDLCreate:659] tivxAlgiVisionCreate returned NUL

  • Hi Jeff,

    it can infer using onnxrt_ep.py without the -c option.

        Can  you confirm whether you ran this script on EVM or PC? 


    Regards,
    Anshu

  • Hi Anshu,

    I ran onnxrt_ep.py without the -c option on my PC.

    Best regards,

  • Hi Jeff,

          Thanks for the quick response. From the error logs it looks like there was some error during compilation of the model. Can you share the logs of onnxrt_ep.py -c ( this has  be run from PC only)

    Regards,

    Anshu

  • Hi Anshu, 

    This is the logs of   onnxrt_ep.py -c please check it, thanks.

    export.log

    Best regards,

  • Hi Jeff,

         Can you now run onnxrt_ep.py without -c ( i.e. without the compile option) on EVM ( please make sure that you are are updating the artifact paths in this script). Let us know if you are able to run with this script.

    Regards,

    Anshu

  • Hi Aushu,

    This may talk a while since I have not yet deployed the edgai-tidl-tools in the EVM. I will upload the result with the log tomorrow, thank you.

    Previously, I modified the config file and ran the model using app_edgeai.py.

  • Jeff,

        If you are trying to run app_edgeai.py then you should already be having edgeai-tidl-tools and as such no extra setup should be required if you are using edgeai SDK


    Regards,

    Anshu

  • Hi Anshu,

    You are correct, unconsciously I neglect the edgeai-tidl-tools in the /opt folder.

    Here is the result running by onnxrt_ep.py without -c on EVM please check it, thanks.

    Available execution providers :  ['TIDLExecutionProvider', 'TIDLCompilationProvider', 'CPUExecutionProvider']
    
    Running 1 Models - ['yolov5s6_ti_lite_640_weedDetect']
    
    
    Running_Model :  yolov5s6_ti_lite_640_weedDetect  
    
    libtidl_onnxrt_EP loaded 0x3bb525b0 
    artifacts_folder                                = /opt/model_zoo/yolov5s6_ti_lite_640_weedDetect/ 
    debug_level                                     = 3 
    target_priority                                 = 0 
    max_pre_empt_delay                              = 1001039168 
    Final number of subgraphs created are : 1, - Offloaded Nodes - 295, Total Nodes - 295 
    In TIDL_createStateInfer 
    Compute on node : TIDLExecutionProvider_TIDL_0_0
    ************ in TIDL_subgraphRtCreate ************ 
     APP: Init ... !!!
    MEM: Init ... !!!
    MEM: Initialized DMA HEAP (fd=4) !!!
    MEM: Init ... Done !!!
    IPC: Init ... !!!
    IPC: Init ... Done !!!
    REMOTE_SERVICE: Init ... !!!
    REMOTE_SERVICE: Init ... Done !!!
      5050.265836 s: GTC Frequency = 200 MHz
    APP: Init ... Done !!!
      5050.270076 s:  VX_ZONE_INIT:Enabled
      5050.270082 s:  VX_ZONE_ERROR:Enabled
      5050.270085 s:  VX_ZONE_WARNING:Enabled
      5050.276421 s:  VX_ZONE_INIT:[tivxInitLocal:130] Initialization Done !!!
      5050.279073 s:  VX_ZONE_INIT:[tivxHostInitLocal:86] Initialization Done for HOST !!!
      5050.446832 s:  VX_ZONE_ERROR:[ownContextSendCmd:815] Command ack message returned failure cmd_status: -1
      5050.446839 s:  VX_ZONE_ERROR:[ownContextSendCmd:851] tivxEventWait() failed.
      5050.446843 s:  VX_ZONE_ERROR:[ownNodeKernelInit:538] Target kernel, TIVX_CMD_NODE_CREATE failed for node TIDLNode
      5050.446847 s:  VX_ZONE_ERROR:[ownNodeKernelInit:539] Please be sure the target callbacks have been registered for this core
      5050.446849 s:  VX_ZONE_ERROR:[ownNodeKernelInit:540] If the target callbacks have been registered, please ensure no errors are occurring within the create callback of this kernel
      5050.446853 s:  VX_ZONE_ERROR:[ownGraphNodeKernelInit:583] kernel init for node 0, kernel com.ti.tidl ... failed !!!
      5050.446859 s:  VX_ZONE_ERROR:[vxVerifyGraph:2055] Node kernel init failed
      5050.446862 s:  VX_ZONE_ERROR:[vxVerifyGraph:2109] Graph verify failed
    TIDL_RT_OVX: ERROR: Verifying TIDL graph ... Failed !!!
    TIDL_RT_OVX: ERROR: Verify OpenVX graph failed
    ************ TIDL_subgraphRtCreate done ************ 
     *******   In TIDL_subgraphRtInvoke  ******** 
      5050.722006 s:  VX_ZONE_ERROR:[ownContextSendCmd:815] Command ack message returned failure cmd_status: -1
      5050.722013 s:  VX_ZONE_ERROR:[ownContextSendCmd:851] tivxEventWait() failed.
      5050.722017 s:  VX_ZONE_ERROR:[ownNodeKernelInit:538] Target kernel, TIVX_CMD_NODE_CREATE failed for node TIDLNode
      5050.722020 s:  VX_ZONE_ERROR:[ownNodeKernelInit:539] Please be sure the target callbacks have been registered for this core
      5050.722023 s:  VX_ZONE_ERROR:[ownNodeKernelInit:540] If the target callbacks have been registered, please ensure no errors are occurring within the create callback of this kernel
      5050.722027 s:  VX_ZONE_ERROR:[ownGraphNodeKernelInit:583] kernel init for node 0, kernel com.ti.tidl ... failed !!!
      5050.722033 s:  VX_ZONE_ERROR:[vxVerifyGraph:2055] Node kernel init failed
      5050.722036 s:  VX_ZONE_ERROR:[vxVerifyGraph:2109] Graph verify failed
      5050.722148 s:  VX_ZONE_ERROR:[ownGraphScheduleGraphWrapper:820] graph is not in a state required to be scheduled
      5050.722151 s:  VX_ZONE_ERROR:[vxProcessGraph:755] schedule graph failed
      5050.722153 s:  VX_ZONE_ERROR:[vxProcessGraph:760] wait graph failed
    ERROR: Running TIDL graph ... Failed !!!
      5050.722162 s:  VX_ZONE_ERROR:[tivx_utils_tidl_trace_write:105] TIDL Trace Buffer empty
    Sub Graph Stats 1696.000000 85507.000000 11225801428054584.000000 
    *******  TIDL_subgraphRtInvoke done  ******** 
    *******   In TIDL_subgraphRtInvoke  ******** 
      5050.903371 s:  VX_ZONE_ERROR:[ownContextSendCmd:815] Command ack message returned failure cmd_status: -1
      5050.903378 s:  VX_ZONE_ERROR:[ownContextSendCmd:851] tivxEventWait() failed.
      5050.903383 s:  VX_ZONE_ERROR:[ownNodeKernelInit:538] Target kernel, TIVX_CMD_NODE_CREATE failed for node TIDLNode
      5050.903386 s:  VX_ZONE_ERROR:[ownNodeKernelInit:539] Please be sure the target callbacks have been registered for this core
      5050.903389 s:  VX_ZONE_ERROR:[ownNodeKernelInit:540] If the target callbacks have been registered, please ensure no errors are occurring within the create callback of this kernel
      5050.903478 s:  VX_ZONE_ERROR:[ownGraphNodeKernelInit:583] kernel init for node 0, kernel com.ti.tidl ... failed !!!
      5050.903485 s:  VX_ZONE_ERROR:[vxVerifyGraph:2055] Node kernel init failed
      5050.903488 s:  VX_ZONE_ERROR:[vxVerifyGraph:2109] Graph verify failed
      5050.903601 s:  VX_ZONE_ERROR:[ownGraphScheduleGraphWrapper:820] graph is not in a state required to be scheduled
      5050.903604 s:  VX_ZONE_ERROR:[vxProcessGraph:755] schedule graph failed
      5050.903607 s:  VX_ZONE_ERROR:[vxProcessGraph:760] wait graph failed
    ERROR: Running TIDL graph ... Failed !!!
      5050.903615 s:  VX_ZONE_ERROR:[tivx_utils_tidl_trace_write:105] TIDL Trace Buffer empty
    Sub Graph Stats 1711.000000 85754.000000 11225801428054584.000000 
    *******  TIDL_subgraphRtInvoke done  ******** 
    *******   In TIDL_subgraphRtInvoke  ******** 
      5051.086148 s:  VX_ZONE_ERROR:[ownContextSendCmd:815] Command ack message returned failure cmd_status: -1
      5051.086156 s:  VX_ZONE_ERROR:[ownContextSendCmd:851] tivxEventWait() failed.
      5051.086160 s:  VX_ZONE_ERROR:[ownNodeKernelInit:538] Target kernel, TIVX_CMD_NODE_CREATE failed for node TIDLNode
      5051.086163 s:  VX_ZONE_ERROR:[ownNodeKernelInit:539] Please be sure the target callbacks have been registered for this core
      5051.086166 s:  VX_ZONE_ERROR:[ownNodeKernelInit:540] If the target callbacks have been registered, please ensure no errors are occurring within the create callback of this kernel
      5051.086171 s:  VX_ZONE_ERROR:[ownGraphNodeKernelInit:583] kernel init for node 0, kernel com.ti.tidl ... failed !!!
      5051.086177 s:  VX_ZONE_ERROR:[vxVerifyGraph:2055] Node kernel init failed
      5051.086180 s:  VX_ZONE_ERROR:[vxVerifyGraph:2109] Graph verify failed
      5051.086291 s:  VX_ZONE_ERROR:[ownGraphScheduleGraphWrapper:820] graph is not in a state required to be scheduled
      5051.086294 s:  VX_ZONE_ERROR:[vxProcessGraph:755] schedule graph failed
      5051.086297 s:  VX_ZONE_ERROR:[vxProcessGraph:760] wait graph failed
    ERROR: Running TIDL graph ... Failed !!!
      5051.086307 s:  VX_ZONE_ERROR:[tivx_utils_tidl_trace_write:105] TIDL Trace Buffer empty
    Sub Graph Stats 1757.000000 85746.000000 11225801428054584.000000 
    *******  TIDL_subgraphRtInvoke done  ******** 
    *******   In TIDL_subgraphRtInvoke  ******** 
      5051.268311 s:  VX_ZONE_ERROR:[ownContextSendCmd:815] Command ack message returned failure cmd_status: -1
      5051.268318 s:  VX_ZONE_ERROR:[ownContextSendCmd:851] tivxEventWait() failed.
      5051.268323 s:  VX_ZONE_ERROR:[ownNodeKernelInit:538] Target kernel, TIVX_CMD_NODE_CREATE failed for node TIDLNode
      5051.268325 s:  VX_ZONE_ERROR:[ownNodeKernelInit:539] Please be sure the target callbacks have been registered for this core
      5051.268328 s:  VX_ZONE_ERROR:[ownNodeKernelInit:540] If the target callbacks have been registered, please ensure no errors are occurring within the create callback of this kernel
      5051.268333 s:  VX_ZONE_ERROR:[ownGraphNodeKernelInit:583] kernel init for node 0, kernel com.ti.tidl ... failed !!!
      5051.268339 s:  VX_ZONE_ERROR:[vxVerifyGraph:2055] Node kernel init failed
      5051.268342 s:  VX_ZONE_ERROR:[vxVerifyGraph:2109] Graph verify failed
      5051.268453 s:  VX_ZONE_ERROR:[ownGraphScheduleGraphWrapper:820] graph is not in a state required to be scheduled
      5051.268456 s:  VX_ZONE_ERROR:[vxProcessGraph:755] schedule graph failed
      5051.268459 s:  VX_ZONE_ERROR:[vxProcessGraph:760] wait graph failed
    ERROR: Running TIDL graph ... Failed !!!
      5051.268469 s:  VX_ZONE_ERROR:[tivx_utils_tidl_trace_write:105] TIDL Trace Buffer empty
    Sub Graph Stats 1707.000000 86440.000000 11225801428054584.000000 
    *******  TIDL_subgraphRtInvoke done  ******** 
    *******   In TIDL_subgraphRtInvoke  ******** 
      5051.452020 s:  VX_ZONE_ERROR:[ownContextSendCmd:815] Command ack message returned failure cmd_status: -1
      5051.452027 s:  VX_ZONE_ERROR:[ownContextSendCmd:851] tivxEventWait() failed.
      5051.452031 s:  VX_ZONE_ERROR:[ownNodeKernelInit:538] Target kernel, TIVX_CMD_NODE_CREATE failed for node TIDLNode
      5051.452113 s:  VX_ZONE_ERROR:[ownNodeKernelInit:539] Please be sure the target callbacks have been registered for this core
      5051.452117 s:  VX_ZONE_ERROR:[ownNodeKernelInit:540] If the target callbacks have been registered, please ensure no errors are occurring within the create callback of this kernel
      5051.452121 s:  VX_ZONE_ERROR:[ownGraphNodeKernelInit:583] kernel init for node 0, kernel com.ti.tidl ... failed !!!
      5051.452127 s:  VX_ZONE_ERROR:[vxVerifyGraph:2055] Node kernel init failed
      5051.452130 s:  VX_ZONE_ERROR:[vxVerifyGraph:2109] Graph verify failed
      5051.452245 s:  VX_ZONE_ERROR:[ownGraphScheduleGraphWrapper:820] graph is not in a state required to be scheduled
      5051.452248 s:  VX_ZONE_ERROR:[vxProcessGraph:755] schedule graph failed
      5051.452250 s:  VX_ZONE_ERROR:[vxProcessGraph:760] wait graph failed
    ERROR: Running TIDL graph ... Failed !!!
      5051.452259 s:  VX_ZONE_ERROR:[tivx_utils_tidl_trace_write:105] TIDL Trace Buffer empty
    Sub Graph Stats 1708.000000 85633.000000 11225801428054584.000000 
    *******  TIDL_subgraphRtInvoke done  ******** 
    *******   In TIDL_subgraphRtInvoke  ******** 
      5051.634857 s:  VX_ZONE_ERROR:[ownContextSendCmd:815] Command ack message returned failure cmd_status: -1
      5051.634864 s:  VX_ZONE_ERROR:[ownContextSendCmd:851] tivxEventWait() failed.
      5051.634870 s:  VX_ZONE_ERROR:[ownNodeKernelInit:538] Target kernel, TIVX_CMD_NODE_CREATE failed for node TIDLNode
      5051.634873 s:  VX_ZONE_ERROR:[ownNodeKernelInit:539] Please be sure the target callbacks have been registered for this core
      5051.634876 s:  VX_ZONE_ERROR:[ownNodeKernelInit:540] If the target callbacks have been registered, please ensure no errors are occurring within the create callback of this kernel
      5051.634880 s:  VX_ZONE_ERROR:[ownGraphNodeKernelInit:583] kernel init for node 0, kernel com.ti.tidl ... failed !!!
      5051.634886 s:  VX_ZONE_ERROR:[vxVerifyGraph:2055] Node kernel init failed
      5051.634889 s:  VX_ZONE_ERROR:[vxVerifyGraph:2109] Graph verify failed
      5051.634999 s:  VX_ZONE_ERROR:[ownGraphScheduleGraphWrapper:820] graph is not in a state required to be scheduled
      5051.635002 s:  VX_ZONE_ERROR:[vxProcessGraph:755] schedule graph failed
      5051.635005 s:  VX_ZONE_ERROR:[vxProcessGraph:760] wait graph failed
    ERROR: Running TIDL graph ... Failed !!!
      5051.635015 s:  VX_ZONE_ERROR:[tivx_utils_tidl_trace_write:105] TIDL Trace Buffer empty
    Sub Graph Stats 1667.000000 86186.000000 11225801428054584.000000 
    *******  TIDL_subgraphRtInvoke done  ******** 
    *******   In TIDL_subgraphRtInvoke  ******** 
      5051.817416 s:  VX_ZONE_ERROR:[ownContextSendCmd:815] Command ack message returned failure cmd_status: -1
      5051.817423 s:  VX_ZONE_ERROR:[ownContextSendCmd:851] tivxEventWait() failed.
      5051.817428 s:  VX_ZONE_ERROR:[ownNodeKernelInit:538] Target kernel, TIVX_CMD_NODE_CREATE failed for node TIDLNode
      5051.817431 s:  VX_ZONE_ERROR:[ownNodeKernelInit:539] Please be sure the target callbacks have been registered for this core
      5051.817434 s:  VX_ZONE_ERROR:[ownNodeKernelInit:540] If the target callbacks have been registered, please ensure no errors are occurring within the create callback of this kernel
      5051.817439 s:  VX_ZONE_ERROR:[ownGraphNodeKernelInit:583] kernel init for node 0, kernel com.ti.tidl ... failed !!!
      5051.817445 s:  VX_ZONE_ERROR:[vxVerifyGraph:2055] Node kernel init failed
      5051.817447 s:  VX_ZONE_ERROR:[vxVerifyGraph:2109] Graph verify failed
      5051.817585 s:  VX_ZONE_ERROR:[ownGraphScheduleGraphWrapper:820] graph is not in a state required to be scheduled
      5051.817589 s:  VX_ZONE_ERROR:[vxProcessGraph:755] schedule graph failed
      5051.817591 s:  VX_ZONE_ERROR:[vxProcessGraph:760] wait graph failed
    ERROR: Running TIDL graph ... Failed !!!
      5051.817601 s:  VX_ZONE_ERROR:[tivx_utils_tidl_trace_write:105] TIDL Trace Buffer empty
    Sub Graph Stats 1662.000000 86299.000000 11225801428054584.000000 
    *******  TIDL_subgraphRtInvoke done  ******** 
    *******   In TIDL_subgraphRtInvoke  ******** 
      5052.002335 s:  VX_ZONE_ERROR:[ownContextSendCmd:815] Command ack message returned failure cmd_status: -1
      5052.002417 s:  VX_ZONE_ERROR:[ownContextSendCmd:851] tivxEventWait() failed.
      5052.002422 s:  VX_ZONE_ERROR:[ownNodeKernelInit:538] Target kernel, TIVX_CMD_NODE_CREATE failed for node TIDLNode
      5052.002425 s:  VX_ZONE_ERROR:[ownNodeKernelInit:539] Please be sure the target callbacks have been registered for this core
      5052.002427 s:  VX_ZONE_ERROR:[ownNodeKernelInit:540] If the target callbacks have been registered, please ensure no errors are occurring within the create callback of this kernel
      5052.002431 s:  VX_ZONE_ERROR:[ownGraphNodeKernelInit:583] kernel init for node 0, kernel com.ti.tidl ... failed !!!
      5052.002438 s:  VX_ZONE_ERROR:[vxVerifyGraph:2055] Node kernel init failed
      5052.002441 s:  VX_ZONE_ERROR:[vxVerifyGraph:2109] Graph verify failed
      5052.002559 s:  VX_ZONE_ERROR:[ownGraphScheduleGraphWrapper:820] graph is not in a state required to be scheduled
      5052.002562 s:  VX_ZONE_ERROR:[vxProcessGraph:755] schedule graph failed
      5052.002565 s:  VX_ZONE_ERROR:[vxProcessGraph:760] wait graph failed
    ERROR: Running TIDL graph ... Failed !!!
      5052.002574 s:  VX_ZONE_ERROR:[tivx_utils_tidl_trace_write:105] TIDL Trace Buffer empty
    Sub Graph Stats 1892.000000 86776.000000 11225801428054584.000000 
    *******  TIDL_subgraphRtInvoke done  ******** 
    *******   In TIDL_subgraphRtInvoke  ******** 
      5052.186542 s:  VX_ZONE_ERROR:[ownContextSendCmd:815] Command ack message returned failure cmd_status: -1
      5052.186549 s:  VX_ZONE_ERROR:[ownContextSendCmd:851] tivxEventWait() failed.
      5052.186552 s:  VX_ZONE_ERROR:[ownNodeKernelInit:538] Target kernel, TIVX_CMD_NODE_CREATE failed for node TIDLNode
      5052.186555 s:  VX_ZONE_ERROR:[ownNodeKernelInit:539] Please be sure the target callbacks have been registered for this core
      5052.186558 s:  VX_ZONE_ERROR:[ownNodeKernelInit:540] If the target callbacks have been registered, please ensure no errors are occurring within the create callback of this kernel
      5052.186562 s:  VX_ZONE_ERROR:[ownGraphNodeKernelInit:583] kernel init for node 0, kernel com.ti.tidl ... failed !!!
      5052.186568 s:  VX_ZONE_ERROR:[vxVerifyGraph:2055] Node kernel init failed
      5052.186571 s:  VX_ZONE_ERROR:[vxVerifyGraph:2109] Graph verify failed
      5052.186686 s:  VX_ZONE_ERROR:[ownGraphScheduleGraphWrapper:820] graph is not in a state required to be scheduled
      5052.186689 s:  VX_ZONE_ERROR:[vxProcessGraph:755] schedule graph failed
      5052.186692 s:  VX_ZONE_ERROR:[vxProcessGraph:760] wait graph failed
    ERROR: Running TIDL graph ... Failed !!!
      5052.186702 s:  VX_ZONE_ERROR:[tivx_utils_tidl_trace_write:105] TIDL Trace Buffer empty
    Sub Graph Stats 1666.000000 85714.000000 11225801428054584.000000 
    *******  TIDL_subgraphRtInvoke done  ******** 
    *******   In TIDL_subgraphRtInvoke  ******** 
      5052.369033 s:  VX_ZONE_ERROR:[ownContextSendCmd:815] Command ack message returned failure cmd_status: -1
      5052.369039 s:  VX_ZONE_ERROR:[ownContextSendCmd:851] tivxEventWait() failed.
      5052.369044 s:  VX_ZONE_ERROR:[ownNodeKernelInit:538] Target kernel, TIVX_CMD_NODE_CREATE failed for node TIDLNode
      5052.369047 s:  VX_ZONE_ERROR:[ownNodeKernelInit:539] Please be sure the target callbacks have been registered for this core
      5052.369050 s:  VX_ZONE_ERROR:[ownNodeKernelInit:540] If the target callbacks have been registered, please ensure no errors are occurring within the create callback of this kernel
      5052.369054 s:  VX_ZONE_ERROR:[ownGraphNodeKernelInit:583] kernel init for node 0, kernel com.ti.tidl ... failed !!!
      5052.369060 s:  VX_ZONE_ERROR:[vxVerifyGraph:2055] Node kernel init failed
      5052.369063 s:  VX_ZONE_ERROR:[vxVerifyGraph:2109] Graph verify failed
      5052.369174 s:  VX_ZONE_ERROR:[ownGraphScheduleGraphWrapper:820] graph is not in a state required to be scheduled
      5052.369177 s:  VX_ZONE_ERROR:[vxProcessGraph:755] schedule graph failed
      5052.369180 s:  VX_ZONE_ERROR:[vxProcessGraph:760] wait graph failed
    ERROR: Running TIDL graph ... Failed !!!
      5052.369189 s:  VX_ZONE_ERROR:[tivx_utils_tidl_trace_write:105] TIDL Trace Buffer empty
    Sub Graph Stats 1708.000000 86749.000000 11225801428054584.000000 
    *******  TIDL_subgraphRtInvoke done  ******** 
    *******   In TIDL_subgraphRtInvoke  ******** 
      5052.552993 s:  VX_ZONE_ERROR:[ownContextSendCmd:815] Command ack message returned failure cmd_status: -1
      5052.553001 s:  VX_ZONE_ERROR:[ownContextSendCmd:851] tivxEventWait() failed.
      5052.553005 s:  VX_ZONE_ERROR:[ownNodeKernelInit:538] Target kernel, TIVX_CMD_NODE_CREATE failed for node TIDLNode
      5052.553008 s:  VX_ZONE_ERROR:[ownNodeKernelInit:539] Please be sure the target callbacks have been registered for this core
      5052.553011 s:  VX_ZONE_ERROR:[ownNodeKernelInit:540] If the target callbacks have been registered, please ensure no errors are occurring within the create callback of this kernel
      5052.553015 s:  VX_ZONE_ERROR:[ownGraphNodeKernelInit:583] kernel init for node 0, kernel com.ti.tidl ... failed !!!
      5052.553021 s:  VX_ZONE_ERROR:[vxVerifyGraph:2055] Node kernel init failed
      5052.553024 s:  VX_ZONE_ERROR:[vxVerifyGraph:2109] Graph verify failed
      5052.553140 s:  VX_ZONE_ERROR:[ownGraphScheduleGraphWrapper:820] graph is not in a state required to be scheduled
      5052.553143 s:  VX_ZONE_ERROR:[vxProcessGraph:755] schedule graph failed
      5052.553145 s:  VX_ZONE_ERROR:[vxProcessGraph:760] wait graph failed
    ERROR: Running TIDL graph ... Failed !!!
      5052.553155 s:  VX_ZONE_ERROR:[tivx_utils_tidl_trace_write:105] TIDL Trace Buffer empty
    Sub Graph Stats 1669.000000 85604.000000 11225801428054584.000000 
    *******  TIDL_subgraphRtInvoke done  ******** 
    *******   In TIDL_subgraphRtInvoke  ******** 
      5052.735182 s:  VX_ZONE_ERROR:[ownContextSendCmd:815] Command ack message returned failure cmd_status: -1
      5052.735190 s:  VX_ZONE_ERROR:[ownContextSendCmd:851] tivxEventWait() failed.
      5052.735195 s:  VX_ZONE_ERROR:[ownNodeKernelInit:538] Target kernel, TIVX_CMD_NODE_CREATE failed for node TIDLNode
      5052.735198 s:  VX_ZONE_ERROR:[ownNodeKernelInit:539] Please be sure the target callbacks have been registered for this core
      5052.735201 s:  VX_ZONE_ERROR:[ownNodeKernelInit:540] If the target callbacks have been registered, please ensure no errors are occurring within the create callback of this kernel
      5052.735205 s:  VX_ZONE_ERROR:[ownGraphNodeKernelInit:583] kernel init for node 0, kernel com.ti.tidl ... failed !!!
      5052.735212 s:  VX_ZONE_ERROR:[vxVerifyGraph:2055] Node kernel init failed
      5052.735215 s:  VX_ZONE_ERROR:[vxVerifyGraph:2109] Graph verify failed
      5052.735326 s:  VX_ZONE_ERROR:[ownGraphScheduleGraphWrapper:820] graph is not in a state required to be scheduled
      5052.735329 s:  VX_ZONE_ERROR:[vxProcessGraph:755] schedule graph failed
      5052.735332 s:  VX_ZONE_ERROR:[vxProcessGraph:760] wait graph failed
    ERROR: Running TIDL graph ... Failed !!!
      5052.735342 s:  VX_ZONE_ERROR:[tivx_utils_tidl_trace_write:105] TIDL Trace Buffer empty
    Sub Graph Stats 1667.000000 86328.000000 11225801428054584.000000 
    *******  TIDL_subgraphRtInvoke done  ******** 
    *******   In TIDL_subgraphRtInvoke  ******** 
      5052.919416 s:  VX_ZONE_ERROR:[ownContextSendCmd:815] Command ack message returned failure cmd_status: -1
      5052.919423 s:  VX_ZONE_ERROR:[ownContextSendCmd:851] tivxEventWait() failed.
      5052.919428 s:  VX_ZONE_ERROR:[ownNodeKernelInit:538] Target kernel, TIVX_CMD_NODE_CREATE failed for node TIDLNode
      5052.919431 s:  VX_ZONE_ERROR:[ownNodeKernelInit:539] Please be sure the target callbacks have been registered for this core
      5052.919434 s:  VX_ZONE_ERROR:[ownNodeKernelInit:540] If the target callbacks have been registered, please ensure no errors are occurring within the create callback of this kernel
      5052.919438 s:  VX_ZONE_ERROR:[ownGraphNodeKernelInit:583] kernel init for node 0, kernel com.ti.tidl ... failed !!!
      5052.919445 s:  VX_ZONE_ERROR:[vxVerifyGraph:2055] Node kernel init failed
      5052.919447 s:  VX_ZONE_ERROR:[vxVerifyGraph:2109] Graph verify failed
      5052.919559 s:  VX_ZONE_ERROR:[ownGraphScheduleGraphWrapper:820] graph is not in a state required to be scheduled
      5052.919562 s:  VX_ZONE_ERROR:[vxProcessGraph:755] schedule graph failed
      5052.919565 s:  VX_ZONE_ERROR:[vxProcessGraph:760] wait graph failed
    ERROR: Running TIDL graph ... Failed !!!
      5052.919649 s:  VX_ZONE_ERROR:[tivx_utils_tidl_trace_write:105] TIDL Trace Buffer empty
    Sub Graph Stats 1665.000000 86862.000000 11225801428054584.000000 
    *******  TIDL_subgraphRtInvoke done  ******** 
    *******   In TIDL_subgraphRtInvoke  ******** 
      5053.106625 s:  VX_ZONE_ERROR:[ownContextSendCmd:815] Command ack message returned failure cmd_status: -1
      5053.106632 s:  VX_ZONE_ERROR:[ownContextSendCmd:851] tivxEventWait() failed.
      5053.106637 s:  VX_ZONE_ERROR:[ownNodeKernelInit:538] Target kernel, TIVX_CMD_NODE_CREATE failed for node TIDLNode
      5053.106640 s:  VX_ZONE_ERROR:[ownNodeKernelInit:539] Please be sure the target callbacks have been registered for this core
      5053.106643 s:  VX_ZONE_ERROR:[ownNodeKernelInit:540] If the target callbacks have been registered, please ensure no errors are occurring within the create callback of this kernel
      5053.106647 s:  VX_ZONE_ERROR:[ownGraphNodeKernelInit:583] kernel init for node 0, kernel com.ti.tidl ... failed !!!
      5053.106654 s:  VX_ZONE_ERROR:[vxVerifyGraph:2055] Node kernel init failed
      5053.106656 s:  VX_ZONE_ERROR:[vxVerifyGraph:2109] Graph verify failed
      5053.106767 s:  VX_ZONE_ERROR:[ownGraphScheduleGraphWrapper:820] graph is not in a state required to be scheduled
      5053.106771 s:  VX_ZONE_ERROR:[vxProcessGraph:755] schedule graph failed
      5053.106773 s:  VX_ZONE_ERROR:[vxProcessGraph:760] wait graph failed
    ERROR: Running TIDL graph ... Failed !!!
      5053.106783 s:  VX_ZONE_ERROR:[tivx_utils_tidl_trace_write:105] TIDL Trace Buffer empty
    Sub Graph Stats 1898.000000 86696.000000 11225801428054584.000000 
    *******  TIDL_subgraphRtInvoke done  ******** 
    *******   In TIDL_subgraphRtInvoke  ******** 
      5053.290941 s:  VX_ZONE_ERROR:[ownContextSendCmd:815] Command ack message returned failure cmd_status: -1
      5053.290949 s:  VX_ZONE_ERROR:[ownContextSendCmd:851] tivxEventWait() failed.
      5053.290954 s:  VX_ZONE_ERROR:[ownNodeKernelInit:538] Target kernel, TIVX_CMD_NODE_CREATE failed for node TIDLNode
      5053.290957 s:  VX_ZONE_ERROR:[ownNodeKernelInit:539] Please be sure the target callbacks have been registered for this core
      5053.290960 s:  VX_ZONE_ERROR:[ownNodeKernelInit:540] If the target callbacks have been registered, please ensure no errors are occurring within the create callback of this kernel
      5053.290964 s:  VX_ZONE_ERROR:[ownGraphNodeKernelInit:583] kernel init for node 0, kernel com.ti.tidl ... failed !!!
      5053.290971 s:  VX_ZONE_ERROR:[vxVerifyGraph:2055] Node kernel init failed
      5053.290974 s:  VX_ZONE_ERROR:[vxVerifyGraph:2109] Graph verify failed
      5053.291091 s:  VX_ZONE_ERROR:[ownGraphScheduleGraphWrapper:820] graph is not in a state required to be scheduled
      5053.291094 s:  VX_ZONE_ERROR:[vxProcessGraph:755] schedule graph failed
      5053.291096 s:  VX_ZONE_ERROR:[vxProcessGraph:760] wait graph failed
    ERROR: Running TIDL graph ... Failed !!!
      5053.291106 s:  VX_ZONE_ERROR:[tivx_utils_tidl_trace_write:105] TIDL Trace Buffer empty
    Sub Graph Stats 1794.000000 86826.000000 11225801428054584.000000 
    *******  TIDL_subgraphRtInvoke done  ******** 
    *******   In TIDL_subgraphRtInvoke  ******** 
      5053.473569 s:  VX_ZONE_ERROR:[ownContextSendCmd:815] Command ack message returned failure cmd_status: -1
      5053.473576 s:  VX_ZONE_ERROR:[ownContextSendCmd:851] tivxEventWait() failed.
      5053.473580 s:  VX_ZONE_ERROR:[ownNodeKernelInit:538] Target kernel, TIVX_CMD_NODE_CREATE failed for node TIDLNode
      5053.473584 s:  VX_ZONE_ERROR:[ownNodeKernelInit:539] Please be sure the target callbacks have been registered for this core
      5053.473587 s:  VX_ZONE_ERROR:[ownNodeKernelInit:540] If the target callbacks have been registered, please ensure no errors are occurring within the create callback of this kernel
      5053.473591 s:  VX_ZONE_ERROR:[ownGraphNodeKernelInit:583] kernel init for node 0, kernel com.ti.tidl ... failed !!!
      5053.473597 s:  VX_ZONE_ERROR:[vxVerifyGraph:2055] Node kernel init failed
      5053.473599 s:  VX_ZONE_ERROR:[vxVerifyGraph:2109] Graph verify failed
      5053.473710 s:  VX_ZONE_ERROR:[ownGraphScheduleGraphWrapper:820] graph is not in a state required to be scheduled
      5053.473786 s:  VX_ZONE_ERROR:[vxProcessGraph:755] schedule graph failed
      5053.473789 s:  VX_ZONE_ERROR:[vxProcessGraph:760] wait graph failed
    ERROR: Running TIDL graph ... Failed !!!
      5053.473798 s:  VX_ZONE_ERROR:[tivx_utils_tidl_trace_write:105] TIDL Trace Buffer empty
    Sub Graph Stats 1668.000000 85824.000000 11225801428054584.000000 
    *******  TIDL_subgraphRtInvoke done  ******** 
    *******   In TIDL_subgraphRtInvoke  ******** 
      5053.657796 s:  VX_ZONE_ERROR:[ownContextSendCmd:815] Command ack message returned failure cmd_status: -1
      5053.657803 s:  VX_ZONE_ERROR:[ownContextSendCmd:851] tivxEventWait() failed.
      5053.657807 s:  VX_ZONE_ERROR:[ownNodeKernelInit:538] Target kernel, TIVX_CMD_NODE_CREATE failed for node TIDLNode
      5053.657810 s:  VX_ZONE_ERROR:[ownNodeKernelInit:539] Please be sure the target callbacks have been registered for this core
      5053.657813 s:  VX_ZONE_ERROR:[ownNodeKernelInit:540] If the target callbacks have been registered, please ensure no errors are occurring within the create callback of this kernel
      5053.657818 s:  VX_ZONE_ERROR:[ownGraphNodeKernelInit:583] kernel init for node 0, kernel com.ti.tidl ... failed !!!
      5053.657824 s:  VX_ZONE_ERROR:[vxVerifyGraph:2055] Node kernel init failed
      5053.657827 s:  VX_ZONE_ERROR:[vxVerifyGraph:2109] Graph verify failed
      5053.657938 s:  VX_ZONE_ERROR:[ownGraphScheduleGraphWrapper:820] graph is not in a state required to be scheduled
      5053.657940 s:  VX_ZONE_ERROR:[vxProcessGraph:755] schedule graph failed
      5053.657943 s:  VX_ZONE_ERROR:[vxProcessGraph:760] wait graph failed
    ERROR: Running TIDL graph ... Failed !!!
      5053.657953 s:  VX_ZONE_ERROR:[tivx_utils_tidl_trace_write:105] TIDL Trace Buffer empty
    Sub Graph Stats 1672.000000 85802.000000 11225801428054584.000000 
    *******  TIDL_subgraphRtInvoke done  ******** 
    *******   In TIDL_subgraphRtInvoke  ******** 
      5053.847113 s:  VX_ZONE_ERROR:[ownContextSendCmd:815] Command ack message returned failure cmd_status: -1
      5053.847121 s:  VX_ZONE_ERROR:[ownContextSendCmd:851] tivxEventWait() failed.
      5053.847126 s:  VX_ZONE_ERROR:[ownNodeKernelInit:538] Target kernel, TIVX_CMD_NODE_CREATE failed for node TIDLNode
      5053.847129 s:  VX_ZONE_ERROR:[ownNodeKernelInit:539] Please be sure the target callbacks have been registered for this core
      5053.847132 s:  VX_ZONE_ERROR:[ownNodeKernelInit:540] If the target callbacks have been registered, please ensure no errors are occurring within the create callback of this kernel
      5053.847136 s:  VX_ZONE_ERROR:[ownGraphNodeKernelInit:583] kernel init for node 0, kernel com.ti.tidl ... failed !!!
      5053.847142 s:  VX_ZONE_ERROR:[vxVerifyGraph:2055] Node kernel init failed
      5053.847145 s:  VX_ZONE_ERROR:[vxVerifyGraph:2109] Graph verify failed
      5053.847256 s:  VX_ZONE_ERROR:[ownGraphScheduleGraphWrapper:820] graph is not in a state required to be scheduled
      5053.847259 s:  VX_ZONE_ERROR:[vxProcessGraph:755] schedule graph failed
      5053.847261 s:  VX_ZONE_ERROR:[vxProcessGraph:760] wait graph failed
    ERROR: Running TIDL graph ... Failed !!!
      5053.847271 s:  VX_ZONE_ERROR:[tivx_utils_tidl_trace_write:105] TIDL Trace Buffer empty
    Sub Graph Stats 1909.000000 92621.000000 11225801428054584.000000 
    *******  TIDL_subgraphRtInvoke done  ******** 
    *******   In TIDL_subgraphRtInvoke  ******** 
      5054.029378 s:  VX_ZONE_ERROR:[ownContextSendCmd:815] Command ack message returned failure cmd_status: -1
      5054.029385 s:  VX_ZONE_ERROR:[ownContextSendCmd:851] tivxEventWait() failed.
      5054.029389 s:  VX_ZONE_ERROR:[ownNodeKernelInit:538] Target kernel, TIVX_CMD_NODE_CREATE failed for node TIDLNode
      5054.029392 s:  VX_ZONE_ERROR:[ownNodeKernelInit:539] Please be sure the target callbacks have been registered for this core
      5054.029395 s:  VX_ZONE_ERROR:[ownNodeKernelInit:540] If the target callbacks have been registered, please ensure no errors are occurring within the create callback of this kernel
      5054.029399 s:  VX_ZONE_ERROR:[ownGraphNodeKernelInit:5Available execution providers :  ['TIDLExecutionProvider', 'TIDLCompilationProvider', 'CPUExecutionProvider']
    
    Running 1 Models - ['yolov5s6_ti_lite_640_weedDetect']
    
    
    Running_Model :  yolov5s6_ti_lite_640_weedDetect  
    
    83] kernel init for node 0, kernel com.ti.tidl ... failed !!!
      5054.029482 s:  VX_ZONE_ERROR:[vxVerifyGraph:2055] Node kernel init failed
      5054.029498 s:  VX_ZONE_ERROR:[vxVerifyGraph:2109] Graph verify failed
      5054.029610 s:  VX_ZONE_ERROR:[ownGraphScheduleGraphWrapper:820] graph is not in a state required to be scheduled
      5054.029613 s:  VX_ZONE_ERROR:[vxProcessGraph:755] schedule graph failed
      5054.029615 s:  VX_ZONE_ERROR:[vxProcessGraph:760] wait graph failed
    ERROR: Running TIDL graph ... Failed !!!
      5054.029625 s:  VX_ZONE_ERROR:[tivx_utils_tidl_trace_write:105] TIDL Trace Buffer empty
    Sub Graph Stats 1685.000000 85735.000000 11225801428054584.000000 
    *******  TIDL_subgraphRtInvoke done  ******** 
    *******   In TIDL_subgraphRtInvoke  ******** 
      5054.212058 s:  VX_ZONE_ERROR:[ownContextSendCmd:815] Command ack message returned failure cmd_status: -1
      5054.212065 s:  VX_ZONE_ERROR:[ownContextSendCmd:851] tivxEventWait() failed.
      5054.212069 s:  VX_ZONE_ERROR:[ownNodeKernelInit:538] Target kernel, TIVX_CMD_NODE_CREATE failed for node TIDLNode
      5054.212072 s:  VX_ZONE_ERROR:[ownNodeKernelInit:539] Please be sure the target callbacks have been registered for this core
      5054.212075 s:  VX_ZONE_ERROR:[ownNodeKernelInit:540] If the target callbacks have been registered, please ensure no errors are occurring within the create callback of this kernel
      5054.212080 s:  VX_ZONE_ERROR:[ownGraphNodeKernelInit:583] kernel init for node 0, kernel com.ti.tidl ... failed !!!
      5054.212086 s:  VX_ZONE_ERROR:[vxVerifyGraph:2055] Node kernel init failed
      5054.212089 s:  VX_ZONE_ERROR:[vxVerifyGraph:2109] Graph verify failed
      5054.212199 s:  VX_ZONE_ERROR:[ownGraphScheduleGraphWrapper:820] graph is not in a state required to be scheduled
      5054.212202 s:  VX_ZONE_ERROR:[vxProcessGraph:755] schedule graph failed
      5054.212204 s:  VX_ZONE_ERROR:[vxProcessGraph:760] wait graph failed
    ERROR: Running TIDL graph ... Failed !!!
      5054.212214 s:  VX_ZONE_ERROR:[tivx_utils_tidl_trace_write:105] TIDL Trace Buffer empty
    Sub Graph Stats 1701.000000 85627.000000 11225801428054584.000000 
    *******  TIDL_subgraphRtInvoke done  ******** 
    *******   In TIDL_subgraphRtInvoke  ******** 
      5054.395026 s:  VX_ZONE_ERROR:[ownContextSendCmd:815] Command ack message returned failure cmd_status: -1
      5054.395033 s:  VX_ZONE_ERROR:[ownContextSendCmd:851] tivxEventWait() failed.
      5054.395037 s:  VX_ZONE_ERROR:[ownNodeKernelInit:538] Target kernel, TIVX_CMD_NODE_CREATE failed for node TIDLNode
      5054.395040 s:  VX_ZONE_ERROR:[ownNodeKernelInit:539] Please be sure the target callbacks have been registered for this core
      5054.395043 s:  VX_ZONE_ERROR:[ownNodeKernelInit:540] If the target callbacks have been registered, please ensure no errors are occurring within the create callback of this kernel
      5054.395048 s:  VX_ZONE_ERROR:[ownGraphNodeKernelInit:583] kernel init for node 0, kernel com.ti.tidl ... failed !!!
      5054.395054 s:  VX_ZONE_ERROR:[vxVerifyGraph:2055] Node kernel init failed
      5054.395057 s:  VX_ZONE_ERROR:[vxVerifyGraph:2109] Graph verify failed
      5054.395167 s:  VX_ZONE_ERROR:[ownGraphScheduleGraphWrapper:820] graph is not in a state required to be scheduled
      5054.395170 s:  VX_ZONE_ERROR:[vxProcessGraph:755] schedule graph failed
      5054.395173 s:  VX_ZONE_ERROR:[vxProcessGraph:760] wait graph failed
    ERROR: Running TIDL graph ... Failed !!!
      5054.395183 s:  VX_ZONE_ERROR:[tivx_utils_tidl_trace_write:105] TIDL Trace Buffer empty
    Sub Graph Stats 1675.000000 86328.000000 11225801428054584.000000 
    *******  TIDL_subgraphRtInvoke done  ******** 
    ************ in TIDL_subgraphRtDelete ************ 
       5054.437005 s:  VX_ZONE_INIT:[tivxHostDeInitLocal:100] De-Initialization Done for HOST !!!
      5054.441351 s:  VX_ZONE_INIT:[tivxDeInitLocal:193] De-Initialization Done !!!
    APP: Deinit ... !!!
    REMOTE_SERVICE: Deinit ... !!!
    REMOTE_SERVICE: Deinit ... Done !!!
    IPC: Deinit ... !!!
    IPC: DeInit ... Done !!!
    MEM: Deinit ... !!!
    MEM: Alloc's: 8 alloc's of 323357804 bytes 
    MEM: Free's : 8 free's  of 323357804 bytes 
    MEM: Open's : 0 allocs  of 0 bytes 
    MEM: Deinit ... Done !!!
    APP: Deinit ... Done !!!
    

    Best regards,

  • Hi Jeff,

        Can you also enable the verbose log by setting debug_level = 3 option in runtime options and again share the log? Following is the option :

    https://github.com/TexasInstruments/edgeai-tidl-tools/blob/843a5df669a2468332cef3450e6aeda5055814fe/examples/osrt_python/common_utils.py#L62

    Regards,
    Anshu

  • Jeff,

        Also if you can share the final model which you are running then it would help us to reproduce the issue at our end.


    Regards,

    Anshu

  • Hi Anshu,

    In the previous uploaded log "j7Run.log", the debug_level has already been set to 3.

    Regards,

    Jeff

  • Hi Anshu,

    This is the final model compiled by TIDL.

    yolov5s6_ti_lite_640_weedDetect.rar

    Regards,

    Jeff

  • Hi Jeff,

    Will you please share the prototxt as well for the model that you shared.

    Regards, Debapriya

  • Hi Debapriya,

    Sure, I forget about it. Here it is.

    name: "yolo_v3"
    tidl_yolo {
      yolo_param {
        input: "370"
        anchor_width: 19.0
        anchor_width: 44.0
        anchor_width: 38.0
        anchor_height: 27.0
        anchor_height: 40.0
        anchor_height: 94.0
      }
      yolo_param {
        input: "432"
        anchor_width: 96.0
        anchor_width: 86.0
        anchor_width: 180.0
        anchor_height: 68.0
        anchor_height: 152.0
        anchor_height: 137.0
      }
      yolo_param {
        input: "494"
        anchor_width: 140.0
        anchor_width: 303.0
        anchor_width: 238.0
        anchor_height: 301.0
        anchor_height: 264.0
        anchor_height: 542.0
      }
      yolo_param {
        input: "556"
        anchor_width: 436.0
        anchor_width: 739.0
        anchor_width: 925.0
        anchor_height: 615.0
        anchor_height: 380.0
        anchor_height: 792.0
      }
      detection_output_param {
        num_classes: 2
        share_location: true
        background_label_id: -1
        nms_param {
          nms_threshold: 0.65
          top_k: 30000
        }
        code_type: CODE_TYPE_YOLO_V5
        keep_top_k: 300
        confidence_threshold: 0.005
      }
      name: "yolo_v3"
      in_width: 640
      in_height: 640
      output: "detections"
    }
    

    Regards,

    Jeff

  • Hi Jeff,

    We were able to run the exact same model that you shared on EVM. Hence, the model seems to be fine.

    In order to make sure that there is no setup issue, please run the script with the default options. You can select any of the default model from the list.  

    In order to flush out any simple mistakes that might have been made in the process, can you please run both compilation and inference in EVM for the model that you shared.

    python onnxrt_ep.py -c   

    python onnxrt_ep.py

    Please share the log after you have executed each of the commands.

    Regards, Debapriya

  • Hi Debapriya,

    I am trying to run the  python onnxrt_ep.py -c  in the EVM, however, it will raise an error:

    Error -   /opt/edgeai-tidl-tools/tidl_tools/tidl_model_import_onnx.so: cannot open shared object file: No such file or directory 

    which confuses me, since I have run the setup.sh in the edgeai-tidl-tools folder and make sure the LD_LIBRARY_PATH is correct.

    Regards,

    Jeff

  • The model compilation is only supported in PC (-c option). Only ineferce is supported on EVM.

  • Hi Debapriya,

    I ran the cl-ort-resnet18-v1 in the model list with the default options ( python onnxrt_ep.py ), and everything looks good.

    Here is the log.

    Available execution providers :  ['TIDLExecutionProvider', 'TIDLCompilationProvider', 'CPUExecutionProvider']
    
    Running 1 Models - ['cl-ort-resnet18-v1']
    
    
    Running_Model :  cl-ort-resnet18-v1  
    
    libtidl_onnxrt_EP loaded 0x3aa5e040 
    artifacts_folder                                = /opt/model_zoo/cl-ort-resnet18-v1/ 
    debug_level                                     = 3 
    target_priority                                 = 0 
    max_pre_empt_delay                              = 983781952 
    Final number of subgraphs created are : 1, - Offloaded Nodes - 52, Total Nodes - 52 
    In TIDL_createStateInfer 
    Compute on node : TIDLExecutionProvider_TIDL_0_0
    ************ in TIDL_subgraphRtCreate ************ 
     APP: Init ... !!!
    MEM: Init ... !!!
    MEM: Initialized DMA HEAP (fd=4) !!!
    MEM: Init ... Done !!!
    IPC: Init ... !!!
    IPC: Init ... Done !!!
    REMOTE_SERVICE: Init ... !!!
    REMOTE_SERVICE: Init ... Done !!!
       795.026487 s: GTC Frequency = 200 MHz
    APP: Init ... Done !!!
       795.037095 s:  VX_ZONE_INIT:Enabled
       795.037104 s:  VX_ZONE_ERROR:Enabled
       795.037106 s:  VX_ZONE_WARNING:Enabled
       795.040164 s:  VX_ZONE_INIT:[tivxInitLocal:130] Initialization Done !!!
       795.043805 s:  VX_ZONE_INIT:[tivxHostInitLocal:86] Initialization Done for HOST !!!
    ************ TIDL_subgraphRtCreate done ************ 
     *******   In TIDL_subgraphRtInvoke  ******** 
    Sub Graph Stats 83.000000 903792.000000 33.000000 
    *******  TIDL_subgraphRtInvoke done  ******** 
    *******   In TIDL_subgraphRtInvoke  ******** 
    Sub Graph Stats 73.000000 903569.000000 20.000000 
    *******  TIDL_subgraphRtInvoke done  ******** 
    *******   In TIDL_subgraphRtInvoke  ******** 
    Sub Graph Stats 63.000000 902365.000000 26.000000 
    *******  TIDL_subgraphRtInvoke done  ******** 
    *******   In TIDL_subgraphRtInvoke  ******** 
    Sub Graph Stats 69.000000 904221.000000 20.000000 
    *******  TIDL_subgraphRtInvoke done  ******** 
    *******   In TIDL_subgraphRtInvoke  ******** 
    Sub Graph Stats 90.000000 902830.000000 18.000000 
    *******  TIDL_subgraphRtInvoke done  ******** 
    *******   In TIDL_subgraphRtInvoke  ******** 
    Sub Graph Stats 70.000000 902182.000000 18.000000 
    *******  TIDL_subgraphRtInvoke done  ******** 
    *******   In TIDL_subgraphRtInvoke  ******** 
    Sub Graph Stats 72.000000 904946.000000 24.000000 
    *******  TIDL_subgraphRtInvoke done  ******** 
    *******   In TIDL_subgraphRtInvoke  ******** 
    Sub Graph Stats 77.000000 902922.000000 19.000000 
    *******  TIDL_subgraphRtInvoke done  ******** 
    *******   In TIDL_subgraphRtInvoke  ******** 
    Sub Graph Stats 74.000000 903850.000000 18.000000 
    *******  TIDL_subgraphRtInvoke done  ******** 
    *******   In TIDL_subgraphRtInvoke  ******** 
    Sub Graph Stats 72.000000 902238.000000 18.000000 
    *******  TIDL_subgraphRtInvoke done  ******** 
    *******   In TIDL_subgraphRtInvoke  ******** 
    Sub Graph Stats 72.000000 903694.000000 20.000000 
    *******  TIDL_subgraphRtInvoke done  ******** 
    *******   In TIDL_subgraphRtInvoke  ******** 
    Sub Graph Stats 72.000000 903712.000000 18.000000 
    *******  TIDL_subgraphRtInvoke done  ******** 
    ************ in TIDL_subgraphRtDelete ************ 
        806.922931 s:  VX_ZONE_INIT:[tivxHostDeInitLocal:100] De-Initialization Done for HOST !!!
       806.923292 s:  VX_ZONE_INIT:[tivxDeInitLocal:193] De-Initialization Done !!!
    APP: Deinit ... !!!
    REMOTE_SERVICE: Deinit ... !!!
    REMOTE_SERVICE: Deinit ... Done !!!
    IPC: Deinit ... !!!
    IPC: DeInit ... Done !!!
    MEM: Deinit ... !!!
    MEM: Alloc's: 8 alloc's of 281205076 bytes 
    MEM: Free's : 8 free's  of 281205076 bytes 
    MEM: Open's : 0 allocs  of 0 bytes 
    MEM: Deinit ... Done !!!
    APP: Deinit ... Done !!!
    

    And I run python onnxrt_ep.py -c again for my model on the PC and deploy it on the EVM using python onnxrt_ep.py, unfortunately, the result remains still as here.

    Here is the result running by onnxrt_ep.py without -c on EVM please check it, thanks.

    That is so upsetting......

    Regards,

    Jeff

  • Hi Debapriya,

    Here are all the params used to compiled the yolov5s6_ti_lite_640_weedDetect,

    Hopefully, it can help you to analyze the problem.

    tensor_bits = 8
    debug_level = 3
    max_num_subgraphs = 16
    accuracy_level = 1
    calibration_frames = 2
    calibration_iterations = 5
    output_feature_16bit_names_list = "370, 680, 990, 1300"#"conv1_2, fire9/concat_1"
    params_16bit_names_list = "" #"fire3/squeeze1x1_2"
    
    quantization_scale_type = 0
    high_resolution_optimization = 0
    pre_batchnorm_fold = 1
    ti_internal_nc_flag = 1601
    
    #set to default accuracy_level 1
    activation_clipping = 1
    weight_clipping = 1
    bias_calibration = 1
    channel_wise_quantization = 0
    
    
    models_configs = {
        # ONNX RT OOB Models
        'yolov5s6_ti_lite_640_weedDetect' : {
            'model_path' : os.path.join(modelmyself_path, 'yolov5s6_ti_lite_640_weedDetect/best.onnx'),
            'mean': [0, 0, 0],
            'std' : [0.003921568627,0.003921568627,0.003921568627],
            'num_images' : numImages,
            'num_classes': 2,
            'model_type': 'od',
            'od_type' : 'YoloV5',
            'framework' : '',
            'meta_layers_names_list' : os.path.join(modelmyself_path, 'yolov5s6_ti_lite_640_weedDetect/best.prototxt'),
            'session_name' : 'onnxrt' ,
            'meta_arch_type' : 6
        }
    }


    Regards,

    Jeff

  • Hi Debapriya,
    Meanwhile, I attach the ./vx_app_arm_remote_log.out execution output for you, hopefully it is helpful.

    vx_app_arm_remote_log_2.txt

    And, may I ask which PyTorch and onnx version you are using on the PC? 

    my PyTorch version is 1.9.1 and the env used to compile the model is shown as below:

    Regards,

    Jeff

  • Hi Jeff,

    I think the model compilation didn't happen correctly as the model in the artifact is still in float. Can you please share the import log from PC?

    Regards, Debapriya

  • Hi Debapriya,

    This is the log running the onnxrt_ep.py -c on the PC.

    compileLog.txt

    Regards,

    Jeff

  • Hi Debapriya,

    You mention that :

    the model in the artifact is still in float

    Is the model need to be quantized before being compiled ??

    Since after the training, the model is exported directly to onnx. This onnx then is compiled by TIDL.

  • Hi jeff,

     I was checking the svg file that you shared as part of the yolov5s6_ti_lite_640_weedDetect.rar . There, I can see the model weights in 32 bits. 

    I didn't mean "the model need to be quantized before being compiled "?  The model will be quantized during compilation.

    Regards, Debapriya

  • Hi Jeff,

    • PFA a simple script to run import and inference. Please try it out on PC and share the import and inference log. PFA the the log as well for reference.
    • You can just run python yolo_onnx_inference_tidl.py.

    Regards, Debapriya

    /user/a0132471/Apps/anaconda2/envs/tidlrt/bin/python /user/a0132471/Files/bit-bucket/utils/yolov5_onnx_weed_detector/yolo_onnx_inference_tidl.py
    TIDL Meta PipeLine (Proto) File  : ./yolov5s6_ti_lite_640_weedDetect.prototxt  
    yolo_v3
    yolo_v3
    Number of OD backbone nodes = 192 
    Size of odBackboneNodeIds = 192 
    
    Preliminary subgraphs created = 1 
    Final number of subgraphs created are : 1, - Offloaded Nodes - 295, Total Nodes - 295 
    TIDL Meta PipeLine (Proto) File  : ./yolov5s6_ti_lite_640_weedDetect.prototxt  
    yolo_v3
    yolo_v3
    
     ************** Frame index 1 : Running float import ************* 
    INFORMATION: [TIDL_ResizeLayer] Resize_107 Any resize ratio which is power of 2 and greater than 4 will be placed by combination of 4x4 resize layer and 2x2 resize layer. For example a 8x8 resize will be replaced by 4x4 resize followed by 2x2 resize.
    INFORMATION: [TIDL_ResizeLayer] Resize_123 Any resize ratio which is power of 2 and greater than 4 will be placed by combination of 4x4 resize layer and 2x2 resize layer. For example a 8x8 resize will be replaced by 4x4 resize followed by 2x2 resize.
    INFORMATION: [TIDL_ResizeLayer] Resize_139 Any resize ratio which is power of 2 and greater than 4 will be placed by combination of 4x4 resize layer and 2x2 resize layer. For example a 8x8 resize will be replaced by 4x4 resize followed by 2x2 resize.
    WARNING: [TIDL_E_DATAFLOW_INFO_NULL] ti_cnnperfsim.out fails to allocate memory in MSMC. Please look into perfsim log. This model can only be used on PC emulation, it will get fault on target.
    ****************************************************
    **          4 WARNINGS          0 ERRORS          **
    ****************************************************
     0.0s:  VX_ZONE_INIT:Enabled
     0.8s:  VX_ZONE_ERROR:Enabled
     0.10s:  VX_ZONE_WARNING:Enabled
     0.475s:  VX_ZONE_INIT:[tivxInit:178] Initialization Done !!!
    
    **********  Frame Index 1 : Running float inference **********
    
    **********  Frame Index 2 : Running fixed point mode for calibration **********
    
    ~~~~~Running TIDL in PC emulation mode to collect Activations range for each layer~~~~~
    
    Processing config file #0 : /data/hdd_data1/a0132471/Files/bit-bucket/utils/yolov5_onnx_weed_detector/artifacts/tempDir/detections_tidl_io_.qunat_stats_config.txt 
     ----------------------- TIDL Process with REF_ONLY FLOW ------------------------
    
    #    0 . .. T     522.20  .... ..... ... .... .....
    #    1 . .. T     308.56  .... ..... ... .... .....
    ~~~~~Running TIDL in PC emulation mode to collect Activations range for each layer~~~~~
    
    Processing config file #0 : /data/hdd_data1/a0132471/Files/bit-bucket/utils/yolov5_onnx_weed_detector/artifacts/tempDir/detections_tidl_io_.qunat_stats_config.txt 
     ----------------------- TIDL Process with REF_ONLY FLOW ------------------------
    
    #    0 . .. T     616.70  .... ..... ... .... .....
    #    1 . .. T     431.99  .... ..... ... .... .....
     
     
     *****************   Calibration iteration number 0 completed ************************ 


    ~~~~~Running TIDL in PC emulation mode to collect Activations range for each layer~~~~~
    
    Processing config file #0 : /data/hdd_data1/a0132471/Files/bit-bucket/utils/yolov5_onnx_weed_detector/artifacts/tempDir/detections_tidl_io_.qunat_stats_config.txt 
     ----------------------- TIDL Process with REF_ONLY FLOW ------------------------
    
    #    0 . .. T     533.83  .... ..... ... .... .....
    #    1 . .. T     373.12  .... ..... ... .... .....
     
     
     *****************   Calibration iteration number 1 completed ************************ 


    ~~~~~Running TIDL in PC emulation mode to collect Activations range for each layer~~~~~
    
    Processing config file #0 : /data/hdd_data1/a0132471/Files/bit-bucket/utils/yolov5_onnx_weed_detector/artifacts/tempDir/detections_tidl_io_.qunat_stats_config.txt 
     ----------------------- TIDL Process with REF_ONLY FLOW ------------------------
    
    #    0 . .. T     559.46  .... ..... ... .... .....
    #    1 . .. T     460.85  .... ..... ... .... .....
     
     
     *****************   Calibration iteration number 2 completed ************************ 


    ~~~~~Running TIDL in PC emulation mode to collect Activations range for each layer~~~~~
    
    Processing config file #0 : /data/hdd_data1/a0132471/Files/bit-bucket/utils/yolov5_onnx_weed_detector/artifacts/tempDir/detections_tidl_io_.qunat_stats_config.txt 
     ----------------------- TIDL Process with REF_ONLY FLOW ------------------------
    
    #    0 . .. T     544.86  .... ..... ... .... .....
    #    1 . .. T     380.33  .... ..... ... .... .....
     
     
     *****************   Calibration iteration number 3 completed ************************ 


    ~~~~~Running TIDL in PC emulation mode to collect Activations range for each layer~~~~~
    
    Processing config file #0 : /data/hdd_data1/a0132471/Files/bit-bucket/utils/yolov5_onnx_weed_detector/artifacts/tempDir/detections_tidl_io_.qunat_stats_config.txt 
     ----------------------- TIDL Process with REF_ONLY FLOW ------------------------
    
    #    0 . .. T     565.80  .... ..... ... .... .....
    #    1 . .. T     411.45  .... ..... ... .... .....
     
     
     *****************   Calibration iteration number 4 completed ************************ 


    ------------------ Network Compiler Traces -----------------------------
    successful Memory allocation
    substitute string tidl_net_ not found
    INFORMATION: [TIDL_ResizeLayer] Resize_107 Any resize ratio which is power of 2 and greater than 4 will be placed by combination of 4x4 resize layer and 2x2 resize layer. For example a 8x8 resize will be replaced by 4x4 resize followed by 2x2 resize.
    INFORMATION: [TIDL_ResizeLayer] Resize_123 Any resize ratio which is power of 2 and greater than 4 will be placed by combination of 4x4 resize layer and 2x2 resize layer. For example a 8x8 resize will be replaced by 4x4 resize followed by 2x2 resize.
    INFORMATION: [TIDL_ResizeLayer] Resize_139 Any resize ratio which is power of 2 and greater than 4 will be placed by combination of 4x4 resize layer and 2x2 resize layer. For example a 8x8 resize will be replaced by 4x4 resize followed by 2x2 resize.
    ****************************************************
    **          3 WARNINGS          0 ERRORS          **
    ****************************************************
    libtidl_onnxrt_EP loaded 0x5571e5845e80 
    Final number of subgraphs created are : 1, - Offloaded Nodes - 295, Total Nodes - 295 
     16.614467s:  VX_ZONE_INIT:Enabled
     16.614474s:  VX_ZONE_ERROR:Enabled
     16.614475s:  VX_ZONE_WARNING:Enabled
     16.614883s:  VX_ZONE_INIT:[tivxInit:178] Initialization Done !!!
    Starting Inference
    1/8
    2/8
    3/8
    4/8
    5/8
    6/8
    7/8
    8/8
    
    Process finished with exit code 0
    
    
    yolov5_onnx_weed_detector.zip

  • Hi Debapriya,

    Thank you for your marvelous work, I follow the pattern as your instruction, and everything goes well. Now the model runs properly in the TDA4.

    Here is the log in compiling and running. 

    Processing config file #0 : /home/jeff/XAG_working/TI/edgeai-tidl-tools/model-artifacts/yolov5_onnx_weed_detector/artifacts/tempDir/detections_tidl_io_.qunat_stats_config.txt 
     ----------------------- TIDL Process with REF_ONLY FLOW ------------------------
    
    #    0 . .. T    6922.02  .... ..... ... .... .....
    #    1 . .. T    6883.35  .... ..... ... .... .....
    Processing config file #0 : /home/jeff/XAG_working/TI/edgeai-tidl-tools/model-artifacts/yolov5_onnx_weed_detector/artifacts/tempDir/detections_tidl_io_.qunat_stats_config.txt 
     ----------------------- TIDL Process with REF_ONLY FLOW ------------------------
    
    #    0 . .. T    4203.22  .... ..... ... .... .....
    #    1 . .. T    4208.92  .... ..... ... .... .....
    Processing config file #0 : /home/jeff/XAG_working/TI/edgeai-tidl-tools/model-artifacts/yolov5_onnx_weed_detector/artifacts/tempDir/detections_tidl_io_.qunat_stats_config.txt 
     ----------------------- TIDL Process with REF_ONLY FLOW ------------------------
    
    #    0 . .. T    4204.95  .... ..... ... .... .....
    #    1 . .. T    4213.08  .... ..... ... .... .....
    Processing config file #0 : /home/jeff/XAG_working/TI/edgeai-tidl-tools/model-artifacts/yolov5_onnx_weed_detector/artifacts/tempDir/detections_tidl_io_.qunat_stats_config.txt 
     ----------------------- TIDL Process with REF_ONLY FLOW ------------------------
    
    #    0 . .. T    4170.32  .... ..... ... .... .....
    #    1 . .. T    4210.19  .... ..... ... .... .....
    Processing config file #0 : /home/jeff/XAG_working/TI/edgeai-tidl-tools/model-artifacts/yolov5_onnx_weed_detector/artifacts/tempDir/detections_tidl_io_.qunat_stats_config.txt 
     ----------------------- TIDL Process with REF_ONLY FLOW ------------------------
    
    #    0 . .. T    4171.88  .... ..... ... .... .....
    #    1 . .. T    4194.27  .... ..... ... .... .....
    Processing config file #0 : /home/jeff/XAG_working/TI/edgeai-tidl-tools/model-artifacts/yolov5_onnx_weed_detector/artifacts/tempDir/detections_tidl_io_.qunat_stats_config.txt 
     ----------------------- TIDL Process with REF_ONLY FLOW ------------------------
    
    #    0 . .. T    4225.68  .... ..... ... .... .....
    #    1 . .. T    4210.80  .... ..... ... .... .....
    ------------------ Network Compiler Traces -----------------------------
    successful Memory allocation
    TIDL Meta PipeLine (Proto) File  : ./yolov5s6_ti_lite_640_weedDetect.prototxt  
    yolo_v3
    yolo_v3
    Number of OD backbone nodes = 192 
    Size of odBackboneNodeIds = 192 
    
    Preliminary subgraphs created = 1 
    Final number of subgraphs created are : 1, - Offloaded Nodes - 295, Total Nodes - 295 
    TIDL Meta PipeLine (Proto) File  : ./yolov5s6_ti_lite_640_weedDetect.prototxt  
    yolo_v3
    yolo_v3
    
     ************** Frame index 1 : Running float import ************* 
    INFORMATION: [TIDL_ResizeLayer] Resize_107 Any resize ratio which is power of 2 and greater than 4 will be placed by combination of 4x4 resize layer and 2x2 resize layer. For example a 8x8 resize will be replaced by 4x4 resize followed by 2x2 resize.
    INFORMATION: [TIDL_ResizeLayer] Resize_123 Any resize ratio which is power of 2 and greater than 4 will be placed by combination of 4x4 resize layer and 2x2 resize layer. For example a 8x8 resize will be replaced by 4x4 resize followed by 2x2 resize.
    INFORMATION: [TIDL_ResizeLayer] Resize_139 Any resize ratio which is power of 2 and greater than 4 will be placed by combination of 4x4 resize layer and 2x2 resize layer. For example a 8x8 resize will be replaced by 4x4 resize followed by 2x2 resize.
    WARNING: [TIDL_E_DATAFLOW_INFO_NULL] ti_cnnperfsim.out fails to allocate memory in MSMC. Please look into perfsim log. This model can only be used on PC emulation, it will get fault on target.
    ****************************************************
    **          4 WARNINGS          0 ERRORS          **
    ****************************************************
     0.0s:  VX_ZONE_INIT:Enabled
     0.5s:  VX_ZONE_ERROR:Enabled
     0.6s:  VX_ZONE_WARNING:Enabled
     0.613s:  VX_ZONE_INIT:[tivxInit:178] Initialization Done !!!
    
    **********  Frame Index 1 : Running float inference **********
    
    **********  Frame Index 2 : Running fixed point mode for calibration **********
    
    ~~~~~Running TIDL in PC emulation mode to collect Activations range for each layer~~~~~
    
    ~~~~~Running TIDL in PC emulation mode to collect Activations range for each layer~~~~~


     *****************   Calibration iteration number 0 completed ************************ 


    ~~~~~Running TIDL in PC emulation mode to collect Activations range for each layer~~~~~


     *****************   Calibration iteration number 1 completed ************************ 


    ~~~~~Running TIDL in PC emulation mode to collect Activations range for each layer~~~~~


     *****************   Calibration iteration number 2 completed ************************ 


    ~~~~~Running TIDL in PC emulation mode to collect Activations range for each layer~~~~~


     *****************   Calibration iteration number 3 completed ************************ 


    ~~~~~Running TIDL in PC emulation mode to collect Activations range for each layer~~~~~


     *****************   Calibration iteration number 4 completed ************************ 


    substitute string tidl_net_ not found
    INFORMATION: [TIDL_ResizeLayer] Resize_107 Any resize ratio which is power of 2 and greater than 4 will be placed by combination of 4x4 resize layer and 2x2 resize layer. For example a 8x8 resize will be replaced by 4x4 resize followed by 2x2 resize.
    INFORMATION: [TIDL_ResizeLayer] Resize_123 Any resize ratio which is power of 2 and greater than 4 will be placed by combination of 4x4 resize layer and 2x2 resize layer. For example a 8x8 resize will be replaced by 4x4 resize followed by 2x2 resize.
    INFORMATION: [TIDL_ResizeLayer] Resize_139 Any resize ratio which is power of 2 and greater than 4 will be placed by combination of 4x4 resize layer and 2x2 resize layer. For example a 8x8 resize will be replaced by 4x4 resize followed by 2x2 resize.
    ****************************************************
    **          3 WARNINGS          0 ERRORS          **
    ****************************************************
    libtidl_onnxrt_EP loaded 0x560cc28fc110 
    Final number of subgraphs created are : 1, - Offloaded Nodes - 295, Total Nodes - 295 
     76.972109s:  VX_ZONE_INIT:Enabled
     76.972115s:  VX_ZONE_ERROR:Enabled
     76.972116s:  VX_ZONE_WARNING:Enabled
     76.972625s:  VX_ZONE_INIStarting Inference
    1/9
    2/9
    3/9
    4/9
    5/9
    6/9
    7/9
    8/9
    9/9
    T:[tivxInit:178] Initialization Done !!!
    
    Available execution providers :  ['TIDLExecutionProvider', 'TIDLCompilationProvider', 'CPUExecutionProvider']
    
    Running 1 Models - ['yolov5_onnx_weed_detector']
    
    
    Running_Model :  yolov5_onnx_weed_detector  
    
    numFrames:  1
    optue: [array([[[[ 1.8659174e+02,  2.0541983e+02,  2.4650377e+02,
               2.7065768e+02,  4.4135869e-01,  0.0000000e+00],
             [ 5.5508661e+02,  2.0827055e+02,  5.8994672e+02,
               2.3296309e+02,  1.6037476e-01,  0.0000000e+00],
             [ 5.4986395e+02,  6.2248132e+02,  5.9225391e+02,
               6.4024835e+02,  5.2186653e-02,  0.0000000e+00],
             ...,
             [-1.0000000e+00, -1.0000000e+00, -1.0000000e+00,
              -1.0000000e+00,  0.0000000e+00, -1.0000000e+00],
             [-1.0000000e+00, -1.0000000e+00, -1.0000000e+00,
              -1.0000000e+00,  0.0000000e+00, -1.0000000e+00],
             [-1.0000000e+00, -1.0000000e+00, -1.0000000e+00,
              -1.0000000e+00,  0.0000000e+00, -1.0000000e+00]]]],
          dtype=float32)]
    
    Saving image to  /opt/edgeai-tidl-tools/output_images
    
     
    Completed_Model :     1, Name : yolov5_onnx_weed_detector                         , Total time :    8244.47, Offload Time :    8140.66 , DDR RW MBs : 0, Output File : py_out_yolov5_onnx_weed_detector_000115.png 
     
     
    libtidl_onnxrt_EP loaded 0x4382420 
    artifacts_folder                                = /opt/model_zoo/yolov5_onnx_weed_detector/ 
    debug_level                                     = 3 
    target_priority                                 = 0 
    max_pre_empt_delay                              = 63968624 
    Final number of subgraphs created are : 1, - Offloaded Nodes - 295, Total Nodes - 295 
    In TIDL_createStateInfer 
    Compute on node : TIDLExecutionProvider_TIDL_0_0
    ************ in TIDL_subgraphRtCreate ************ 
     APP: Init ... !!!
    MEM: Init ... !!!
    MEM: Initialized DMA HEAP (fd=4) !!!
    MEM: Init ... Done !!!
    IPC: Init ... !!!
    IPC: Init ... Done !!!
    REMOTE_SERVICE: Init ... !!!
    REMOTE_SERVICE: Init ... Done !!!
     24577.236662 s: GTC Frequency = 200 MHz
    APP: Init ... Done !!!
     24577.236693 s:  VX_ZONE_INIT:Enabled
     24577.236695 s:  VX_ZONE_ERROR:Enabled
     24577.236698 s:  VX_ZONE_WARNING:Enabled
     24577.237188 s:  VX_ZONE_INIT:[tivxInitLocal:130] Initialization Done !!!
     24577.237371 s:  VX_ZONE_INIT:[tivxHostInitLocal:86] Initialization Done for HOST !!!
    ************ TIDL_subgraphRtCreate done ************ 
     *******   In TIDL_subgraphRtInvoke  ******** 
    Sub Graph Stats 1872.000000 8140664.000000 36.000000 
    *******  TIDL_subgraphRtInvoke done  ******** 
    ************ in TIDL_subgraphRtDelete ************ 
      24585.753901 s:  VX_ZONE_INIT:[tivxHostDeInitLocal:100] De-Initialization Done for HOST !!!
     24585.757245 s:  VX_ZONE_INIT:[tivxDeInitLocal:193] De-Initialization Done !!!
    APP: Deinit ... !!!
    REMOTE_SERVICE: Deinit ... !!!
    REMOTE_SERVICE: Deinit ... Done !!!
    IPC: Deinit ... !!!
    IPC: DeInit ... Done !!!
    MEM: Deinit ... !!!
    MEM: Alloc's: 8 alloc's of 283784437 bytes 
    MEM: Free's : 8 free's  of 283784437 bytes 
    MEM: Open's : 0 allocs  of 0 bytes 
    MEM: Deinit ... Done !!!
    APP: Deinit ... Done !!!
    Available execution providers :  ['TIDLExecutionProvider', 'TIDLCompilationProvider', 'CPUExecutionProvider']
    
    Running 1 Models - ['yolov5_onnx_weed_detector']
    
    
    Running_Model :  yolov5_onnx_weed_detector  
    
    numFrames:  1
    optue: [array([[[[ 1.8659174e+02,  2.0541983e+02,  2.4650377e+02,
               2.7065768e+02,  4.4135869e-01,  0.0000000e+00],
             [ 5.5508661e+02,  2.0827055e+02,  5.8994672e+02,
               2.3296309e+02,  1.6037476e-01,  0.0000000e+00],
             [ 5.4986395e+02,  6.2248132e+02,  5.9225391e+02,
               6.4024835e+02,  5.2186653e-02,  0.0000000e+00],
             ...,
             [-1.0000000e+00, -1.0000000e+00, -1.0000000e+00,
              -1.0000000e+00,  0.0000000e+00, -1.0000000e+00],
             [-1.0000000e+00, -1.0000000e+00, -1.0000000e+00,
              -1.0000000e+00,  0.0000000e+00, -1.0000000e+00],
             [-1.0000000e+00, -1.0000000e+00, -1.0000000e+00,
              -1.0000000e+00,  0.0000000e+00, -1.0000000e+00]]]],
          dtype=float32)]
    
    Saving image to  /opt/edgeai-tidl-tools/output_images
    
     
    Completed_Model :     1, Name : yolov5_onnx_weed_detector                         , Total time :    8257.40, Offload Time :    8145.63 , DDR RW MBs : 0, Output File : py_out_yolov5_onnx_weed_detector_000115.png 
     
     
    libtidl_onnxrt_EP loaded 0x29ac2390 
    artifacts_folder                                = /opt/model_zoo/yolov5_onnx_weed_detector/ 
    debug_level                                     = 3 
    target_priority                                 = 0 
    max_pre_empt_delay                              = 692327648 
    Final number of subgraphs created are : 1, - Offloaded Nodes - 295, Total Nodes - 295 
    In TIDL_createStateInfer 
    Compute on node : TIDLExecutionProvider_TIDL_0_0
    ************ in TIDL_subgraphRtCreate ************ 
     APP: Init ... !!!
    MEM: Init ... !!!
    MEM: Initialized DMA HEAP (fd=4) !!!
    MEM: Init ... Done !!!
    IPC: Init ... !!!
    IPC: Init ... Done !!!
    REMOTE_SERVICE: Init ... !!!
    REMOTE_SERVICE: Init ... Done !!!
     24630.875858 s: GTC Frequency = 200 MHz
    APP: Init ... Done !!!
     24630.875880 s:  VX_ZONE_INIT:Enabled
     24630.875883 s:  VX_ZONE_ERROR:Enabled
     24630.875885 s:  VX_ZONE_WARNING:Enabled
     24630.876305 s:  VX_ZONE_INIT:[tivxInitLocal:130] Initialization Done !!!
     24630.876499 s:  VX_ZONE_INIT:[tivxHostInitLocal:86] Initialization Done for HOST !!!
    ************ TIDL_subgraphRtCreate done ************ 
     *******   In TIDL_subgraphRtInvoke  ******** 
    Sub Graph Stats 1817.000000 8145627.000000 37.000000 
    *******  TIDL_subgraphRtInvoke done  ******** 
    ************ in TIDL_subgraphRtDelete ************ 
      24639.406824 s:  VX_ZONE_INIT:[tivxHostDeInitLocal:100] De-Initialization Done for HOST !!!
     24639.411123 s:  VX_ZONE_INIT:[tivxDeInitLocal:193] De-Initialization Done !!!
    APP: Deinit ... !!!
    REMOTE_SERVICE: Deinit ... !!!
    REMOTE_SERVICE: Deinit ... Done !!!
    IPC: Deinit ... !!!
    IPC: DeInit ... Done !!!
    MEM: Deinit ... !!!
    MEM: Alloc's: 8 alloc's of 283784437 bytes 
    MEM: Free's : 8 free's  of 283784437 bytes 
    MEM: Open's : 0 allocs  of 0 bytes 
    MEM: Deinit ... Done !!!
    APP: Deinit ... Done !!!
    
    vxRunning.log

    I dig out furthermore, and the issue is due to the problem that onnx model is not quantized before deployment. And the reason is that the list of calib_images in onnxrt_ep.py, its length, should match the value, calibration_frames, in common_utils.py, since which the quantization fails to execute.

    Regards,

    Jeff

  • Hi Debapriya,

    I still have a question, I want to measure the model's accuracy after the quantization by the TIDL. Is the onnx model in the export folder can be used ?

    Can yolov5 do a QAT training? Since the quantization conducted by TIDL is a post-training calibration method.

    Regards,

    Jeff

  • Hi Jeff,

    We were able to achieve close to float accuracy(~1.2% drop) with mixed precision quantization using post-training quantization. That's why we didn't try with QAT. You need to set the following parameters to quantize the model properly:

    "advanced_options:calibration_frames": 50,
    "advanced_options:calibration_iterations": 50,

    You can use 50 calibration frames from your training dataset. You need to run calibration on PC and then use those artifacts to run inference on EVM.

    In order to measure the accuracy, you can follow this repository:  https://github.com/TexasInstruments/edgeai-benchmark .It has support for evaluating YOLOV5 models trained on COCO dataset. Or, you can build on top of the script "yolo_onnx_inference_tidl.py" as you can run inference with this script. 

    Regards, Debapriya