This thread has been locked.

If you have a related question, please click the "Ask a related question" button in the top right corner. The newly created question will be automatically linked to this question.

TDA4VM: Camera frame does not update sometimes when using writeMosaicOutput

Part Number: TDA4VM

Hi Experts,

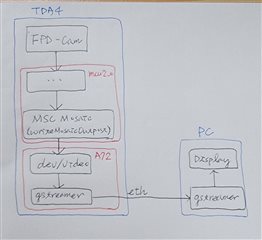
Our goal: Passing camera video frames to linux virtual video device.

Modification: I changed  writeMosaicOutput funtion to copying frame data to /dev/video instead of copying frame data to sd card.

Outcome: The dispay freezed occasionally.

I have tried to increase frame buffer size for writeMosaicOutput and remove display node from graph but those did not help much.

As you can see in the log, FILEIO and TOTAL recoreds are well in the acceptable range.

I also set timeout to 34 ms in the gstreamer. The updating frame interval did not exceed timeout, so it probably dequed the same frame and wrote the same frame to /dev/video repeadly.

Summary of CPU load,
====================

CPU: mpu1_0: TOTAL LOAD =  21.95 % ( HWI =   0.42 %, SWI =   0.79 % )
CPU: mcu2_0: TOTAL LOAD =   7. 0 % ( HWI =   0. 0 %, SWI =   0. 0 % )
CPU: mcu2_1: TOTAL LOAD =   1. 0 % ( HWI =   0. 0 %, SWI =   0. 0 % )
CPU:  c6x_1: TOTAL LOAD =   1. 0 % ( HWI =   0. 0 %, SWI =   0. 0 % )
CPU:  c6x_2: TOTAL LOAD =   1. 0 % ( HWI =   0. 0 %, SWI =   0. 0 % )
CPU:  c7x_1: TOTAL LOAD =   1. 0 % ( HWI =   0. 0 %, SWI =   0. 0 % )


HWA performance statistics,
===========================

HWA:   MSC0: LOAD =   7.99 % ( 61 MP/s )


DDR performance statistics,
===========================

DDR: READ  BW: AVG =    466 MB/s, PEAK =   3316 MB/s
DDR: WRITE BW: AVG =    315 MB/s, PEAK =   3407 MB/s
DDR: TOTAL BW: AVG =    781 MB/s, PEAK =   6723 MB/s


Detailed CPU performance/memory statistics,
===========================================

CPU: mcu2_0: TASK:           IPC_RX:   0.31 %
CPU: mcu2_0: TASK:       REMOTE_SRV:   0. 0 %
CPU: mcu2_0: TASK:        LOAD_TEST:   0. 0 %
CPU: mcu2_0: TASK:       TIVX_CPU_0:   0. 0 %
CPU: mcu2_0: TASK:          TIVX_NF:   0. 0 %
CPU: mcu2_0: TASK:        TIVX_LDC1:   0. 0 %
CPU: mcu2_0: TASK:        TIVX_MSC1:   1.54 %
CPU: mcu2_0: TASK:        TIVX_MSC2:   0. 0 %
CPU: mcu2_0: TASK:       TIVX_VISS1:   0. 0 %
CPU: mcu2_0: TASK:       TIVX_CAPT1:   0.93 %
CPU: mcu2_0: TASK:       TIVX_CAPT2:   0. 0 %
CPU: mcu2_0: TASK:       TIVX_DISP1:   1.74 %
CPU: mcu2_0: TASK:       TIVX_DISP2:   0. 0 %
CPU: mcu2_0: TASK:       TIVX_CSITX:   0. 0 %
CPU: mcu2_0: TASK:       TIVX_CAPT3:   0. 0 %
CPU: mcu2_0: TASK:       TIVX_CAPT4:   0. 0 %
CPU: mcu2_0: TASK:       TIVX_CAPT5:   0. 0 %
CPU: mcu2_0: TASK:       TIVX_CAPT6:   0. 0 %
CPU: mcu2_0: TASK:       TIVX_CAPT7:   0. 0 %
CPU: mcu2_0: TASK:       TIVX_CAPT8:   0. 0 %
CPU: mcu2_0: TASK:      TIVX_DISP_M:   1.59 %
CPU: mcu2_0: TASK:      TIVX_DISP_M:   0. 0 %

CPU: mcu2_0: HEAP:   DDR_SHARED_MEM: size =   16777216 B, free =   16701440 B ( 99 % unused)
CPU: mcu2_0: HEAP:           L3_MEM: size =     262144 B, free =     261888 B ( 99 % unused)

CPU: mcu2_1: TASK:           IPC_RX:   0. 0 %
CPU: mcu2_1: TASK:       REMOTE_SRV:   0. 0 %
CPU: mcu2_1: TASK:        LOAD_TEST:   0. 0 %
CPU: mcu2_1: TASK:         TIVX_SDE:   0. 0 %
CPU: mcu2_1: TASK:         TIVX_DOF:   0. 0 %
CPU: mcu2_1: TASK:       TIVX_CPU_1:   0. 0 %
CPU: mcu2_1: TASK:      IPC_TEST_RX:   0. 0 %
CPU: mcu2_1: TASK:      IPC_TEST_TX:   0. 0 %

CPU: mcu2_1: HEAP:   DDR_SHARED_MEM: size =   16777216 B, free =   16773376 B ( 99 % unused)
CPU: mcu2_1: HEAP:           L3_MEM: size =     262144 B, free =     262144 B (100 % unused)

CPU:  c6x_1: TASK:           IPC_RX:   0. 0 %
CPU:  c6x_1: TASK:       REMOTE_SRV:   0. 0 %
CPU:  c6x_1: TASK:        LOAD_TEST:   0. 0 %
CPU:  c6x_1: TASK:         TIVX_CPU:   0. 0 %
CPU:  c6x_1: TASK:      IPC_TEST_RX:   0. 0 %
CPU:  c6x_1: TASK:      IPC_TEST_TX:   0. 0 %

CPU:  c6x_1: HEAP:   DDR_SHARED_MEM: size =   16777216 B, free =   16773376 B ( 99 % unused)
CPU:  c6x_1: HEAP:           L2_MEM: size =     229376 B, free =     229376 B (100 % unused)
CPU:  c6x_1: HEAP:  DDR_SCRATCH_MEM: size =   50331648 B, free =   50331648 B (100 % unused)

CPU:  c6x_2: TASK:           IPC_RX:   0. 0 %
CPU:  c6x_2: TASK:       REMOTE_SRV:   0. 0 %
CPU:  c6x_2: TASK:        LOAD_TEST:   0. 0 %
CPU:  c6x_2: TASK:         TIVX_CPU:   0. 0 %
CPU:  c6x_2: TASK:      IPC_TEST_RX:   0. 0 %
CPU:  c6x_2: TASK:      IPC_TEST_TX:   0. 0 %

CPU:  c6x_2: HEAP:   DDR_SHARED_MEM: size =   16777216 B, free =   16773376 B ( 99 % unused)
CPU:  c6x_2: HEAP:           L2_MEM: size =     229376 B, free =     229376 B (100 % unused)
CPU:  c6x_2: HEAP:  DDR_SCRATCH_MEM: size =   50331648 B, free =   50331648 B (100 % unused)

CPU:  c7x_1: TASK:           IPC_RX:   0. 0 %
CPU:  c7x_1: TASK:       REMOTE_SRV:   0. 0 %
CPU:  c7x_1: TASK:        LOAD_TEST:   0. 0 %
CPU:  c7x_1: TASK:      TIVX_CPU_PR:   0. 0 %
CPU:  c7x_1: TASK:      IPC_TEST_RX:   0. 0 %
CPU:  c7x_1: TASK:      IPC_TEST_TX:   0. 0 %

CPU:  c7x_1: HEAP:   DDR_SHARED_MEM: size =  268435456 B, free =  268435200 B ( 99 % unused)
CPU:  c7x_1: HEAP:           L3_MEM: size =    8159232 B, free =    8159232 B (100 % unused)
CPU:  c7x_1: HEAP:           L2_MEM: size =     458752 B, free =     458752 B (100 % unused)
CPU:  c7x_1: HEAP:           L1_MEM: size =      16384 B, free =      16384 B (100 % unused)
CPU:  c7x_1: HEAP:  DDR_SCRATCH_MEM: size =  385875968 B, free =  385875968 B (100 % unused)


GRAPH: app_multi_cam_graph (#nodes =   4, #executions =    839)
 NODE:       CAPTURE1:             capture_node: avg =  19902 usecs, min/max =   3254 /  44525 usecs9
 NODE:       DSS_M2M1:              FmtConvNode: avg =   2126 usecs, min/max =   2114 /   2152 usecs9
 NODE:      VPAC_MSC1:              mosaic_node: avg =   2938 usecs, min/max =   2861 /  14112 usecs9
 NODE:       DISPLAY1:              DisplayNode: avg =   6685 usecs, min/max =     74 /  11974 usecs9

 PERF:           FILEIO: avg =   1133 usecs, min/max =   1005 /   1664 usecs, #executions =        88
 PERF:            TOTAL: avg =  33332 usecs, min/max =  33140 /  33513 usecs, #executions =        50

 PERF:            TOTAL:   30. 0 FPS


 =========================
 Demo : Camera Demo
 =========================

 s: Save CSIx, VISS and LDC outputs

 p: Print performance statistics

 x: Exit

 Enter Choice: 


 =========================
 Demo : Camera Demo
 =========================

 s: Save CSIx, VISS and LDC outputs

 p: Print performance statistics

 x: Exit

 Enter Choice: [MCU2_0]    261.761782 s: ==========================================================
[MCU2_0]    261.761878 s:  Capture Status: Instance|0
[MCU2_0]    261.761914 s: ==========================================================
[MCU2_0]    261.761959 s:  overflowCount: 0
[MCU2_0]    261.761994 s:  spuriousUdmaIntrCount: 0
[MCU2_0]    261.762029 s:  frontFIFOOvflCount: 0
[MCU2_0]    261.762062 s:  crcCount: 0
[MCU2_0]    261.762092 s:  eccCount: 0
[MCU2_0]    261.762125 s:  correctedEccCount: 0
[MCU2_0]    261.762159 s:  dataIdErrorCount: 0
[MCU2_0]    261.762206 s:  invalidAccessCount: 0
[MCU2_0]    261.762240 s:  invalidSpCount: 0
[MCU2_0]    261.762277 s:  strmFIFOOvflCount[0]: 0
[MCU2_0]    261.762306 s:  Channel Num | Frame Queue Count | Frame De-queue Count | Frame Drop Count|
[MCU2_0]    261.762383 s:            0 |               842 |                  840 |                0|

vx_status gst_writeMosaicOutput(char* file_name, vx_image out_img, FILE *fpp)
 {
     vx_status status;
     vx_int32 j;
     static uint8_t i_buffer[SIZE] = {0};

     status = vxGetStatus((vx_reference)out_img);

     if(status == VX_SUCCESS)
     {
         rewind(fpp);
         //if(fp == NULL)
         {
           //  printf("Unable to open file %s \n", file_name);
           //  return (VX_FAILURE);
         }

         {
             vx_rectangle_t rect;
             vx_imagepatch_addressing_t image_addr;
             vx_map_id map_id;
             void * data_ptr;
             vx_uint32  img_width;
             vx_uint32  img_height;
             vx_uint32  num_bytes = 0;

             vxQueryImage(out_img, VX_IMAGE_WIDTH, &img_width, sizeof(vx_uint32));
             vxQueryImage(out_img, VX_IMAGE_HEIGHT, &img_height, sizeof(vx_uint32));

             rect.start_x = 0;
             rect.start_y = 0;
             rect.end_x = img_width;
             rect.end_y = img_height;
             status = vxMapImagePatch(out_img,
                                    &rect,
                                    0,
                                    &map_id,
                                    &image_addr,
                                    &data_ptr,
                                    VX_READ_ONLY,
                                    VX_MEMORY_TYPE_HOST,
                                    VX_NOGAP_X);

             /* Copy Luma */
             for (j = 0; j < img_height; j++)
             {
                 //num_bytes += fwrite(data_ptr, 1, img_width, fp);
                 memcpy(i_buffer + num_bytes, data_ptr, img_width);
                 num_bytes += img_width;
                 //fwrite(data_ptr, 1, img_width, fpp);
                 data_ptr += image_addr.stride_y;
             }

             if(num_bytes != (img_width*img_height))
             {
                 printf("Luma bytes written = %d, expected = %d", num_bytes, img_width*img_height);
             }

             vxUnmapImagePatch(out_img, map_id);

             status = vxMapImagePatch(out_img,
                                    &rect,
                                    1,
                                    &map_id,
                                    &image_addr,
                                    &data_ptr,
                                    VX_READ_ONLY,
                                    VX_MEMORY_TYPE_HOST,
                                    VX_NOGAP_X);

             /* Copy CbCr */
             num_bytes = 0;
             for (j = 0; j < img_height/2; j++)
             {
                 //num_bytes += fwrite(data_ptr, 1, img_width, fp);
                 memcpy(i_buffer + num_bytes + FRAME_SIZE, data_ptr, img_width);
                 num_bytes += img_width;
                 //fwrite(data_ptr, 1, img_width, fpp);
                 data_ptr += image_addr.stride_y;
             }

             if(num_bytes != (img_width*img_height/2))
             {
                 printf("CbCr bytes written = %d, expected = %d", num_bytes, img_width*img_height/2);
             }

             vxUnmapImagePatch(out_img, map_id);

             fwrite(i_buffer, SIZE, 1, fpp);
             fsync(fileno(fpp));
         }

         //fclose(fp);
     }

     return(status);
 }

Thanks 

Michael

  • Hi all:

    A. This is Gstreamer transmission by using Ethernet.

        Left side is TDA4 Display.

        Right side is coming from PC display.

        This movie posted is pure Video, no sound transfer yet.

    B. Please draw a system environment setup topology.

    C. If using the Iperf to test the sending from left side to the right side, is the iperf smooth?

         According the meeting, you have verified the 2-way T/RX, there is no any jitter.


    D. This is testing based on TSN?

         This testing is not using the TSN yet, it's pure ethernet transferring.

    E. Do you have the sniffer log? (WE need this to check if "re-transmssion" occurs.

    BR Rio

  • Hi all,

    Please find responses to your qustions below.

    B. Please draw a system environment setup topology.

    C. If using the Iperf to test the sending from left side to the right side, is the iperf smooth?

    TDA4(Client)

    root@j7-evm:/opt/vision_apps# iperf3 -u -c 192.168.1.2 -i 1 -b 1G
    Connecting to host 192.168.1.2, port 5201
    [  5] local 192.168.1.10 port 53774 connected to 192.168.1.2 port 5201
    [ ID] Interval           Transfer     Bitrate         Total Datagrams
    [  5]   0.00-1.00   sec   103 MBytes   865 Mbits/sec  74681  
    [  5]   1.00-2.00   sec   103 MBytes   865 Mbits/sec  74695  
    [  5]   2.00-3.00   sec   103 MBytes   863 Mbits/sec  74511  
    [  5]   3.00-4.00   sec   103 MBytes   866 Mbits/sec  74723  
    [  5]   4.00-5.00   sec   103 MBytes   866 Mbits/sec  74729  
    [  5]   5.00-6.00   sec   104 MBytes   871 Mbits/sec  75154  
    [  5]   6.00-7.00   sec   104 MBytes   873 Mbits/sec  75358  
    [  5]   7.00-8.00   sec   105 MBytes   877 Mbits/sec  75697  
    [  5]   8.00-9.00   sec   103 MBytes   868 Mbits/sec  74935  
    [  5]   9.00-10.00  sec   104 MBytes   869 Mbits/sec  75039  
    - - - - - - - - - - - - - - - - - - - - - - - - -
    [ ID] Interval           Transfer     Bitrate         Jitter    Lost/Total Datagrams
    [  5]   0.00-10.00  sec  1.01 GBytes   868 Mbits/sec  0.000 ms  0/749522 (0%)  sender
    [  5]   0.00-10.00  sec  1.01 GBytes   868 Mbits/sec  0.001 ms  67/749522 (0.0089%)  receiver

    PC(Server)

    -----------------------------------------------------------
    Server listening on 5201
    -----------------------------------------------------------
    Accepted connection from 192.168.1.10, port 41852
    [  5] local 192.168.1.2 port 5201 connected to 192.168.1.10 port 53774
    [ ID] Interval           Transfer     Bandwidth       Jitter    Lost/Total Datagrams
    [  5]   0.00-1.00   sec   103 MBytes   865 Mbits/sec  0.002 ms  0/74670 (0%)  
    [  5]   1.00-2.00   sec   103 MBytes   865 Mbits/sec  0.001 ms  0/74694 (0%)  
    [  5]   2.00-3.00   sec   103 MBytes   863 Mbits/sec  0.001 ms  0/74510 (0%)  
    [  5]   3.00-4.00   sec   103 MBytes   866 Mbits/sec  0.001 ms  0/74722 (0%)  
    [  5]   4.00-5.00   sec   103 MBytes   865 Mbits/sec  0.002 ms  37/74727 (0.05%)  
    [  5]   5.00-6.00   sec   104 MBytes   871 Mbits/sec  0.001 ms  0/75154 (0%)  
    [  5]   6.00-7.00   sec   104 MBytes   873 Mbits/sec  0.001 ms  30/75356 (0.04%)  
    [  5]   7.00-8.00   sec   105 MBytes   877 Mbits/sec  0.001 ms  0/75696 (0%)  
    [  5]   8.00-9.00   sec   103 MBytes   868 Mbits/sec  0.004 ms  0/74934 (0%)  
    [  5]   9.00-10.00  sec   104 MBytes   869 Mbits/sec  0.001 ms  0/75038 (0%)  
    [  5]  10.00-10.00  sec  29.7 KBytes   757 Mbits/sec  0.001 ms  0/21 (0%)  
    - - - - - - - - - - - - - - - - - - - - - - - - -
    [ ID] Interval           Transfer     Bandwidth       Jitter    Lost/Total Datagrams
    [  5]   0.00-10.00  sec  0.00 Bytes  0.00 bits/sec  0.001 ms  67/749522 (0.0089%)  
    

    E. Do you have the sniffer log? (WE need this to check if "re-transmssion" occurs.

    https://drive.google.com/file/d/1ucpRaMWhxj_beVRR2rhpd9TASdKy3gch/view?usp=sharing

    Thanks 

    Michael

  • Hi Michael:

    Sorry, we cannot access the google drive in TI network.

    Can you attached here?

    Thanks.

    BR Rio

  • Hi Rio,

    The uploading process was interrupted in the middle.

    The file size is around 114 MB. 

    Thanks

    Michael

  • Hi Michael:

    Jay ever used this TI Box, please upload the sniffer onto this:

    https://txn.account.box.com/login?redirect_url=%2Ffolder%2F153790055786

    BR Rio

  • Hi RIO

    Please attach the sniffer log here

    https://txn.box.com/s/pusrr4urz9rwv9j7iz560ivrb9kqatz3

    BR

    Jay

  • Hi Michael:

    #1. I have read the entire sniffer log.

    No any re-transmission, this is good.

    But,  contains lots of "malformed packet". 

    please read this:

    1、wireshark提示malformed packet。expert info (error/malformed):malformed pachet (exception occurred)----https://zhidao.baidu.com/question/1447371686056458540.html?qbl=relate_question_1&word=Malformed%20Packet:USB

    2、为什么会有malformed packet----https://zhidao.baidu.com/question/169428900.html

    3、malformed packet:DNS 是怎么回事呢----https://www.zhihu.com/question/398471654/answer/1263003077


    就是包不太对劲,按照协议解析有问题,比如有长度字段的,但是长度不是正常范围的。这种有可能是协议版本不兼容

    #2. I also saw the "YAMI protocol".

         So, can you cross check both size YAMI protocol that runs on the top of UDP?

    THanks.

    BR Rio

  • Hi Rio,

    Please point out where the malformed packet is. I do not see any abnormal packet.

    I have checked that the frames dequed from the pipe are all correct.

    The frozen screen barely happens now.

    I will keep you posted.

    Thanks

    Michael  

  • Hi Michal:

    If you check every frame, it will show the red color item which is pointing as "malformed packet: YAMI".

  • This fail rate is about 10%.

    Plz provide the TOPS log.

    The Gstreamer will take 35% TOPS.

  • Hi Rio,

    1. Please check the log below.

    2. I have tried to transmit 2 camera channels over gstreamer, and the result was unusable.

    The screen kept freezing and running incessantly. 

    The CPU usage reached to 60-80 % and the resolution was 1080x1344.

    3. I am wondering that will TI provide hardware-accelerated encoding/decoding support for gstreamer?

    Thanks

    Michael

  • Hi TI Champs:

    Here is the detail information of this E2E.

    1. 2 cameras trans stuck.
    2. Both Cameras are same model / same resolution.
    3. Multi-cam.
    4. Camera - Sensor ISX019 / 1280x720 --> zoom out --> 1080x672.....Using multi-app : scalar node to compress. (HW: DSP).
    5. 1 camera works normally most of the time, but 5% rate to lag

    BR Rio

  • HI TI Champs:

    Any feedback?

    BR Rio

  • Hi Rio,

    Does it work fine if writemosaic is disabled? 

    As such there is no dependency of write_mosaic in capture node, but may be write is delaying capture..

    Regards,

    Brijesh

  • Hi Brijesh,

    If writemosaic is disabled, the frame data can not be sent to remote display.

    Local display works fine all the time, so I guess there is nothing wrong in capture node.

    Virtual video device never gets time-out, so mosaic node writes frame data in time everytime.

    Based on this infomation, I suppose that gstreamer is the bottleneck.

    Thanks 

    Michael 

  • Hi Michael,

    Since the left display is working fine, i dont see any issue in the OpenVX graph, ie it is not getting stuck/stalled anywhere to create frame freeze. 

    In the code you have shared, i see you are mapping the image buffer and then copying it into another buffer and probably after this, you are sending it out. So in this case,

    - how are you getting image buffer? Is it enabled using graph parameters? 

    - why are you copying mapped buffer to another buffer? Is it really required to send the image to the output?

    Regards,

    Brijesh

  • Hi Brijesh,

    I agree with you that OpenVX graph works fine.

    - how are you getting image buffer? Is it enabled using graph parameters? 

    That image buffer is coming from linux video device which is created by v4l2loopback.

    - why are you copying mapped buffer to another buffer? Is it really required to send the image to the output?

    This is because I want to use gstreamer to stream camera video to demonstarte TSN funtionality.

    Thanks

    Michael

  • Hi Michael,

    That image buffer is coming from linux video device which is created by v4l2loopback.

    vx_image buffer (vx_image out_img) cannot come from the Linux video device. It must be allocated by the OpenVX Framework. I wanted to check from where this image buffer is coming. Are you using Mosaic output as graph parameter and then dequeueing it from the mosaic? 

    This is because I want to use gstreamer to stream camera video to demonstarte TSN funtionality.

    ok, but depending on the CPU load, this might take more time and could potentially delay the transmit of data, and i am not exactly sure what happens on the RX side if the buffer gets delayed. Typically on our drivers, if the buffer gets delayed, it would just repeat the last frame, so we would see freeze momentarily.

    Regards,

    Brijesh

  • Hi Brijesh:

    -->i am not exactly sure what happens on the RX side if the buffer gets delayed. Typically on our drivers, if the buffer gets delayed, it would just repeat the last frame, so we would see freeze momentarily.

    So, there is no way to improve?

    Or we can add more logs to check where is the bottleneck inside the buffer?

    BR Rio

  • Brijesh, 

    Please let Rio know if you want to have a meeting with the customer directly and Rio can work to arrange it.

    Regards
    Karthik

  • Hi Rio,

    ok, can we first confirm that temporary freeze is due to memory copy? Can you please measure the time around memory copy for 10000 frames and analyze it to see if it is taking more than 33ms anytime? 

    Regards,

    Brijesh

  • Hi Brijesh:

    Okay, plz wait our investigation.

    BR Rio

  • Hi Brijesh,

    vx_image buffer (vx_image out_img) cannot come from the Linux video device. It must be allocated by the OpenVX Framework. I wanted to check from where this image buffer is coming. Are you using Mosaic output as graph parameter and then dequeueing it from the mosaic? 

    Yes, it works as you say. I use vx_image array as image buffer and then dequeue it from the mosaic.

    static vx_status app_run_graph_for_one_frame_pipeline(AppObj *obj, vx_int32 frame_id, FILE *fp)
    {
        vx_status status = VX_SUCCESS;
    
        APP_PRINTF("app_run_graph_for_one_pipeline: frame %d beginning\n", frame_id);
        appPerfPointBegin(&obj->total_perf);
    
        ImgMosaicObj *imgMosaicObj = &obj->imgMosaicObj;
        CaptureObj *captureObj = &obj->captureObj;
    
        /* checksum_actual is the checksum determined by the realtime test
            checksum_expected is the checksum that is expected to be the pipeline output */
        uint32_t checksum_actual = 0;
    
        /* This is the number of frames required for the pipeline AWB and AE algorithms to stabilize
            (note that 15 is only required for the 6-8 camera use cases - others converge quicker) */
        uint8_t stability_frame = 15;
    
        if(obj->pipeline < 0)
        {
            /* Enqueue outpus */
            if ((obj->en_out_img_write == 1) || (obj->test_mode == 1))
            {
                status = vxGraphParameterEnqueueReadyRef(obj->graph, imgMosaicObj->graph_parameter_index, (vx_reference*)&imgMosaicObj->output_image[obj->enqueueCnt], 1);
            }
    
            /* Enqueue inputs during pipeup dont execute */
            if (status == VX_SUCCESS)
            {
                status = vxGraphParameterEnqueueReadyRef(obj->graph, captureObj->graph_parameter_index, (vx_reference*)&obj->captureObj.raw_image_arr[obj->enqueueCnt], 1);
            }
            obj->enqueueCnt++;
            obj->enqueueCnt   = (obj->enqueueCnt  >= APP_BUFFER_Q_DEPTH)? 0 : obj->enqueueCnt;
            obj->pipeline++;
        }
    
        if((obj->pipeline == 0) && (status == VX_SUCCESS))
        {
            if((obj->en_out_img_write == 1) || (obj->test_mode == 1))
            {
                status = vxGraphParameterEnqueueReadyRef(obj->graph, imgMosaicObj->graph_parameter_index, (vx_reference*)&imgMosaicObj->output_image[obj->enqueueCnt], 1);
            }
    
            /* Execute 1st frame */
            if(status == VX_SUCCESS)
            {
                status = vxGraphParameterEnqueueReadyRef(obj->graph, captureObj->graph_parameter_index, (vx_reference*)&obj->captureObj.raw_image_arr[obj->enqueueCnt], 1);
            }
            obj->enqueueCnt++;
            obj->enqueueCnt   = (obj->enqueueCnt  >= APP_BUFFER_Q_DEPTH)? 0 : obj->enqueueCnt;
            obj->pipeline++;
        }
    
        if((obj->pipeline > 0) && (status == VX_SUCCESS))
        {
            vx_object_array capture_input_arr;
            vx_image mosaic_output_image[4];
            static uint8_t output_swap = 0;
            uint32_t num_refs;
    
            /* Dequeue input */
            status = vxGraphParameterDequeueDoneRef(obj->graph, captureObj->graph_parameter_index, (vx_reference*)&capture_input_arr, 1, &num_refs);
            if((obj->en_out_img_write == 1) || (obj->test_mode == 1))
            {
                vx_char output_file_name[APP_MAX_FILE_PATH];
    
                /* Dequeue output */
                if (status == VX_SUCCESS)
                {
                    output_swap = output_swap >= 3 ? 0 : output_swap + 1;
                    status = vxGraphParameterDequeueDoneRef(obj->graph, imgMosaicObj->graph_parameter_index, (vx_reference*)&mosaic_output_image[output_swap], 1, &num_refs);
                }
                if ((status == VX_SUCCESS) && (obj->test_mode == 1) && (frame_id > TEST_BUFFER))
                {
                    /* calculate the checksum of the mosaic output */
                    if ((app_test_check_image(mosaic_output_image[output_swap], checksums_expected[obj->sensorObj.sensor_index][obj->sensorObj.num_cameras_enabled-1],
                                            &checksum_actual) != vx_true_e) && (frame_id > stability_frame))
                    {
                        test_result = vx_false_e;
                        /* in case test fails and needs to change */
                        populate_gatherer(obj->sensorObj.sensor_index, obj->sensorObj.num_cameras_enabled-1, checksum_actual);
                    }
                }
    
                if (obj->en_out_img_write == 1) {
                    appPerfPointBegin(&obj->fileio_perf);
                    if (status == VX_SUCCESS)
                    {
                        status = gst_writeMosaicOutput(output_file_name, mosaic_output_image[output_swap], fp);
                    }
                    appPerfPointEnd(&obj->fileio_perf);
                }
                /* Enqueue output */
                if (status == VX_SUCCESS)
                {
                    status = vxGraphParameterEnqueueReadyRef(obj->graph, imgMosaicObj->graph_parameter_index, (vx_reference*)&mosaic_output_image[output_swap], 1);
                }
            }
    
            /* Enqueue input - start execution */
            if (status == VX_SUCCESS)
            {
                status = vxGraphParameterEnqueueReadyRef(obj->graph, captureObj->graph_parameter_index, (vx_reference*)&capture_input_arr, 1);
            }
            obj->enqueueCnt++;
            obj->dequeueCnt++;
    
            obj->enqueueCnt = (obj->enqueueCnt >= APP_BUFFER_Q_DEPTH)? 0 : obj->enqueueCnt;
            obj->dequeueCnt = (obj->dequeueCnt >= APP_BUFFER_Q_DEPTH)? 0 : obj->dequeueCnt;
        }
    
        appPerfPointEnd(&obj->total_perf);
        return status;
    }
    

    ok, but depending on the CPU load, this might take more time and could potentially delay the transmit of data, and i am not exactly sure what happens on the RX side if the buffer gets delayed. Typically on our drivers, if the buffer gets delayed, it would just repeat the last frame, so we would see freeze momentarily.

    As the statistic log  on my first post, FILEIO time stays below 2 ms, so the reason causes freezing screen probably coming from gstreamer and PC Rx.

    There are some test case I have tried.

    1. TDA4 (camera resolution: 1080x672) ---> PC 

        TDA4 gstreamer cpu usage is around 28%. On the Rx side, screen freezes momentarily.

    2. TDA4 (camera resolution: 1080x672) ---> TDA4

        TDA4 gstreamer cpu usage is around 28%. On the Rx side, FPS keeps around 30 most of time.

    3. TDA4 (camera resolution: 1080x1344) ---> PC 

        TDA4 gstreamer cpu usage is around 80%. On the Rx side, screen freezes frequently.

    4.  TDA4 (camera resolution: 1080x1344) ---> TDA4

        Kernel panic.

    Tahnks 

    Michael

  • Hi Brijesh,

    Please check performance statistic log below. It ran more than 10000 frames for 1080x672 camera resolution.

    Summary of CPU load,
    ====================
    
    CPU: mpu1_0: TOTAL LOAD =  12.34 % ( HWI =   0.24 %, SWI =   0.48 % )
    CPU: mcu2_0: TOTAL LOAD =   7. 0 % ( HWI =   0. 0 %, SWI =   0. 0 % )
    CPU: mcu2_1: TOTAL LOAD =   1. 0 % ( HWI =   0. 0 %, SWI =   0. 0 % )
    CPU:  c6x_1: TOTAL LOAD =   0. 0 % ( HWI =   0. 0 %, SWI =   0. 0 % )
    CPU:  c6x_2: TOTAL LOAD =   0. 0 % ( HWI =   0. 0 %, SWI =   0. 0 % )
    CPU:  c7x_1: TOTAL LOAD =   0. 0 % ( HWI =   0. 0 %, SWI =   0. 0 % )
    
    
    HWA performance statistics,
    ===========================
    
    HWA:   MSC0: LOAD =   5.84 % ( 44 MP/s )
    
    
    DDR performance statistics,
    ===========================
    
    DDR: READ  BW: AVG =    653 MB/s, PEAK =  11740 MB/s
    DDR: WRITE BW: AVG =    263 MB/s, PEAK =   3478 MB/s
    DDR: TOTAL BW: AVG =    916 MB/s, PEAK =  15218 MB/s
    
    
    Detailed CPU performance/memory statistics,
    ===========================================
    
    CPU: mcu2_0: TASK:           IPC_RX:   0. 8 %
    CPU: mcu2_0: TASK:       REMOTE_SRV:   0.48 %
    CPU: mcu2_0: TASK:        LOAD_TEST:   0. 0 %
    CPU: mcu2_0: TASK:       TIVX_CPU_0:   0. 0 %
    CPU: mcu2_0: TASK:          TIVX_NF:   0. 0 %
    CPU: mcu2_0: TASK:        TIVX_LDC1:   0. 0 %
    CPU: mcu2_0: TASK:        TIVX_MSC1:   3.23 %
    CPU: mcu2_0: TASK:        TIVX_MSC2:   0. 0 %
    CPU: mcu2_0: TASK:       TIVX_VISS1:   0. 0 %
    CPU: mcu2_0: TASK:       TIVX_CAPT1:   0.80 %
    CPU: mcu2_0: TASK:       TIVX_CAPT2:   0. 0 %
    CPU: mcu2_0: TASK:       TIVX_DISP1:   0.59 %
    CPU: mcu2_0: TASK:       TIVX_DISP2:   0. 0 %
    CPU: mcu2_0: TASK:       TIVX_CSITX:   0. 0 %
    CPU: mcu2_0: TASK:       TIVX_CAPT3:   0. 0 %
    CPU: mcu2_0: TASK:       TIVX_CAPT4:   0. 0 %
    CPU: mcu2_0: TASK:       TIVX_CAPT5:   0. 0 %
    CPU: mcu2_0: TASK:       TIVX_CAPT6:   0. 0 %
    CPU: mcu2_0: TASK:       TIVX_CAPT7:   0. 0 %
    CPU: mcu2_0: TASK:       TIVX_CAPT8:   0. 0 %
    CPU: mcu2_0: TASK:      TIVX_DISP_M:   1.10 %
    CPU: mcu2_0: TASK:      TIVX_DISP_M:   0. 0 %
    CPU: mcu2_0: TASK:      TIVX_DISP_M:   0. 0 %
    CPU: mcu2_0: TASK:      TIVX_DISP_M:   0. 0 %
    
    CPU: mcu2_0: HEAP:   DDR_SHARED_MEM: size =   16777216 B, free =   16693248 B ( 99 % unused)
    CPU: mcu2_0: HEAP:           L3_MEM: size =     262144 B, free =     261888 B ( 99 % unused)
    
    CPU: mcu2_1: TASK:           IPC_RX:   0. 0 %
    CPU: mcu2_1: TASK:       REMOTE_SRV:   0.11 %
    CPU: mcu2_1: TASK:        LOAD_TEST:   0. 0 %
    CPU: mcu2_1: TASK:         TIVX_SDE:   0. 0 %
    CPU: mcu2_1: TASK:         TIVX_DOF:   0. 0 %
    CPU: mcu2_1: TASK:       TIVX_CPU_1:   0. 0 %
    CPU: mcu2_1: TASK:      IPC_TEST_RX:   0. 0 %
    CPU: mcu2_1: TASK:      IPC_TEST_TX:   0. 0 %
    CPU: mcu2_1: TASK:      IPC_TEST_TX:   0. 0 %
    CPU: mcu2_1: TASK:      IPC_TEST_TX:   0. 0 %
    CPU: mcu2_1: TASK:      IPC_TEST_TX:   0. 0 %
    CPU: mcu2_1: TASK:      IPC_TEST_TX:   0. 0 %
    
    CPU: mcu2_1: HEAP:   DDR_SHARED_MEM: size =   16777216 B, free =   16773376 B ( 99 % unused)
    CPU: mcu2_1: HEAP:           L3_MEM: size =     262144 B, free =     262144 B (100 % unused)
    
    CPU:  c6x_1: TASK:           IPC_RX:   0. 0 %
    CPU:  c6x_1: TASK:       REMOTE_SRV:   0. 0 %
    CPU:  c6x_1: TASK:        LOAD_TEST:   0. 0 %
    CPU:  c6x_1: TASK:         TIVX_CPU:   0. 0 %
    CPU:  c6x_1: TASK:      IPC_TEST_RX:   0. 0 %
    CPU:  c6x_1: TASK:      IPC_TEST_TX:   0. 0 %
    CPU:  c6x_1: TASK:      IPC_TEST_TX:   0. 0 %
    CPU:  c6x_1: TASK:      IPC_TEST_TX:   0. 0 %
    CPU:  c6x_1: TASK:      IPC_TEST_TX:   0. 0 %
    CPU:  c6x_1: TASK:      IPC_TEST_TX:   0. 0 %
    
    CPU:  c6x_1: HEAP:   DDR_SHARED_MEM: size =   16777216 B, free =   16773376 B ( 99 % unused)
    CPU:  c6x_1: HEAP:           L2_MEM: size =     229376 B, free =     229376 B (100 % unused)
    CPU:  c6x_1: HEAP:  DDR_SCRATCH_MEM: size =   50331648 B, free =   50331648 B (100 % unused)
    
    CPU:  c6x_2: TASK:           IPC_RX:   0. 0 %
    CPU:  c6x_2: TASK:       REMOTE_SRV:   0. 0 %
    CPU:  c6x_2: TASK:        LOAD_TEST:   0. 0 %
    CPU:  c6x_2: TASK:         TIVX_CPU:   0. 0 %
    CPU:  c6x_2: TASK:      IPC_TEST_RX:   0. 0 %
    CPU:  c6x_2: TASK:      IPC_TEST_TX:   0. 0 %
    CPU:  c6x_2: TASK:      IPC_TEST_TX:   0. 0 %
    CPU:  c6x_2: TASK:      IPC_TEST_TX:   0. 0 %
    CPU:  c6x_2: TASK:      IPC_TEST_TX:   0. 0 %
    CPU:  c6x_2: TASK:      IPC_TEST_TX:   0. 0 %
    
    CPU:  c6x_2: HEAP:   DDR_SHARED_MEM: size =   16777216 B, free =   16773376 B ( 99 % unused)
    CPU:  c6x_2: HEAP:           L2_MEM: size =     229376 B, free =     229376 B (100 % unused)
    CPU:  c6x_2: HEAP:  DDR_SCRATCH_MEM: size =   50331648 B, free =   50331648 B (100 % unused)
    
    CPU:  c7x_1: TASK:           IPC_RX:   0. 0 %
    CPU:  c7x_1: TASK:       REMOTE_SRV:   0. 0 %
    CPU:  c7x_1: TASK:        LOAD_TEST:   0. 0 %
    CPU:  c7x_1: TASK:      TIVX_CPU_PR:   0. 0 %
    CPU:  c7x_1: TASK:      TIVX_CPU_PR:   0. 0 %
    CPU:  c7x_1: TASK:      TIVX_CPU_PR:   0. 0 %
    CPU:  c7x_1: TASK:      TIVX_CPU_PR:   0. 0 %
    CPU:  c7x_1: TASK:      TIVX_CPU_PR:   0. 0 %
    CPU:  c7x_1: TASK:      TIVX_CPU_PR:   0. 0 %
    CPU:  c7x_1: TASK:      TIVX_CPU_PR:   0. 0 %
    CPU:  c7x_1: TASK:      TIVX_CPU_PR:   0. 0 %
    CPU:  c7x_1: TASK:      IPC_TEST_RX:   0. 0 %
    CPU:  c7x_1: TASK:      IPC_TEST_TX:   0. 0 %
    CPU:  c7x_1: TASK:      IPC_TEST_TX:   0. 0 %
    CPU:  c7x_1: TASK:      IPC_TEST_TX:   0. 0 %
    CPU:  c7x_1: TASK:      IPC_TEST_TX:   0. 0 %
    CPU:  c7x_1: TASK:      IPC_TEST_TX:   0. 0 %
    
    CPU:  c7x_1: HEAP:   DDR_SHARED_MEM: size =  268435456 B, free =  268435200 B ( 99 % unused)
    CPU:  c7x_1: HEAP:           L3_MEM: size =    8159232 B, free =    8159232 B (100 % unused)
    CPU:  c7x_1: HEAP:           L2_MEM: size =     458752 B, free =     458752 B (100 % unused)
    CPU:  c7x_1: HEAP:           L1_MEM: size =      16384 B, free =      16384 B (100 % unused)
    CPU:  c7x_1: HEAP:  DDR_SCRATCH_MEM: size =  385875968 B, free =  385875968 B (100 % unused)
    
    
    GRAPH: app_multi_cam_graph (#nodes =   4, #executions =     42)
     NODE:       CAPTURE1:             capture_node: avg =  17688 usecs, min/max =  16780 /  33259 usecs, #executions =         42
     NODE:       DSS_M2M1:              FmtConvNode: avg =   2129 usecs, min/max =   2123 /   2137 usecs, #executions =         42
     NODE:      VPAC_MSC1:              mosaic_node: avg =   3719 usecs, min/max =   2866 /  11757 usecs, #executions =         42
     NODE:       DISPLAY1:              DisplayNode: avg =   8927 usecs, min/max =     85 /   9812 usecs, #executions =         42
    
     PERF:           FILEIO: avg =    908 usecs, min/max =    846 /   1209 usecs, #executions =         41
     PERF:            TOTAL: avg =  32798 usecs, min/max =      5 /  77292 usecs, #executions =         43
    
     PERF:            TOTAL:   30.48 FPS


     =========================
     Demo : Camera Demo
     =========================
    
     s: Save CSIx, VISS and LDC outputs
    
     p: Print performance statistics
    
     x: Exit
    
     Enter Choice: 
    
    
     =========================
     Demo : Camera Demo
     =========================
    
     s: Save CSIx, VISS and LDC outputs
    
     p: Print performance statistics
    
     x: Exit
    
     Enter Choice: [MCU2_0]     56.754436 s: ==========================================================
    [MCU2_0]     56.754537 s:  Capture Status: Instance|0
    [MCU2_0]     56.754571 s: ==========================================================
    [MCU2_0]     56.754615 s:  overflowCount: 0
    [MCU2_0]     56.754646 s:  spuriousUdmaIntrCount: 0
    [MCU2_0]     56.754679 s:  frontFIFOOvflCount: 0
    [MCU2_0]     56.754709 s:  crcCount: 0
    [MCU2_0]     56.754736 s:  eccCount: 0
    [MCU2_0]     56.754765 s:  correctedEccCount: 0
    [MCU2_0]     56.754795 s:  dataIdErrorCount: 0
    [MCU2_0]     56.754827 s:  invalidAccessCount: 0
    [MCU2_0]     56.754858 s:  invalidSpCount: 0
    [MCU2_0]     56.754893 s:  strmFIFOOvflCount[0]: 0
    [MCU2_0]     56.754920 s:  Channel Num | Frame Queue Count | Frame De-queue Count | Frame Drop Count | Error Frame Count |
    [MCU2_0]     56.755002 s:            0 |                45 |                   43 |                0 |                 0 |
    [  130.855737] Initializing XFRM netlink socket
    [  133.729767] process 'docker/tmp/qemu-check064443570/check' started with executable stack


     =========================
     Demo : Camera Demo
     =========================
    
     s: Save CSIx, VISS and LDC outputs
    
     p: Print performance statistics
    
     x: Exit
    
     Enter Choice: p
    
    
    Summary of CPU load,
    ====================
    
    CPU: mpu1_0: TOTAL LOAD =  19.61 % ( HWI =   0.39 %, SWI =   0.71 % )
    CPU: mcu2_0: TOTAL LOAD =   6. 0 % ( HWI =   0. 0 %, SWI =   0. 0 % )
    CPU: mcu2_1: TOTAL LOAD =   1. 0 % ( HWI =   0. 0 %, SWI =   0. 0 % )
    CPU:  c6x_1: TOTAL LOAD =   1. 0 % ( HWI =   0. 0 %, SWI =   0. 0 % )
    CPU:  c6x_2: TOTAL LOAD =   1. 0 % ( HWI =   0. 0 %, SWI =   0. 0 % )
    CPU:  c7x_1: TOTAL LOAD =   1. 0 % ( HWI =   0. 0 %, SWI =   0. 0 % )
    
    
    HWA performance statistics,
    ===========================
    
    HWA:   MSC0: LOAD =   7.94 % ( 61 MP/s )
    
    
    DDR performance statistics,
    ===========================
    
    DDR: READ  BW: AVG =    665 MB/s, PEAK =   4114 MB/s
    DDR: WRITE BW: AVG =    269 MB/s, PEAK =   3451 MB/s
    DDR: TOTAL BW: AVG =    934 MB/s, PEAK =   7565 MB/s
    
    
    Detailed CPU performance/memory statistics,
    ===========================================
    
    CPU: mcu2_0: TASK:           IPC_RX:   0.14 %
    CPU: mcu2_0: TASK:       REMOTE_SRV:   0. 9 %
    CPU: mcu2_0: TASK:        LOAD_TEST:   0. 0 %
    CPU: mcu2_0: TASK:       TIVX_CPU_0:   0. 0 %
    CPU: mcu2_0: TASK:          TIVX_NF:   0. 0 %
    CPU: mcu2_0: TASK:        TIVX_LDC1:   0. 0 %
    CPU: mcu2_0: TASK:        TIVX_MSC1:   1.63 %
    CPU: mcu2_0: TASK:        TIVX_MSC2:   0. 0 %
    CPU: mcu2_0: TASK:       TIVX_VISS1:   0. 0 %
    CPU: mcu2_0: TASK:       TIVX_CAPT1:   0.85 %
    CPU: mcu2_0: TASK:       TIVX_CAPT2:   0. 0 %
    CPU: mcu2_0: TASK:       TIVX_DISP1:   0.69 %
    CPU: mcu2_0: TASK:       TIVX_DISP2:   0. 0 %
    CPU: mcu2_0: TASK:       TIVX_CSITX:   0. 0 %
    CPU: mcu2_0: TASK:       TIVX_CAPT3:   0. 0 %
    CPU: mcu2_0: TASK:       TIVX_CAPT4:   0. 0 %
    CPU: mcu2_0: TASK:       TIVX_CAPT5:   0. 0 %
    CPU: mcu2_0: TASK:       TIVX_CAPT6:   0. 0 %
    CPU: mcu2_0: TASK:       TIVX_CAPT7:   0. 0 %
    CPU: mcu2_0: TASK:       TIVX_CAPT8:   0. 0 %
    CPU: mcu2_0: TASK:      TIVX_DISP_M:   1.72 %
    CPU: mcu2_0: TASK:      TIVX_DISP_M:   0. 0 %
    CPU: mcu2_0: TASK:      TIVX_DISP_M:   0. 0 %
    CPU: mcu2_0: TASK:      TIVX_DISP_M:   0. 0 %
    
    CPU: mcu2_0: HEAP:   DDR_SHARED_MEM: size =   16777216 B, free =   16693248 B ( 99 % unused)
    CPU: mcu2_0: HEAP:           L3_MEM: size =     262144 B, free =     261888 B ( 99 % unused)
    
    CPU: mcu2_1: TASK:           IPC_RX:   0. 0 %
    CPU: mcu2_1: TASK:       REMOTE_SRV:   0. 7 %
    CPU: mcu2_1: TASK:        LOAD_TEST:   0. 0 %
    CPU: mcu2_1: TASK:         TIVX_SDE:   0. 0 %
    CPU: mcu2_1: TASK:         TIVX_DOF:   0. 0 %
    CPU: mcu2_1: TASK:       TIVX_CPU_1:   0. 0 %
    CPU: mcu2_1: TASK:      IPC_TEST_RX:   0. 0 %
    CPU: mcu2_1: TASK:      IPC_TEST_TX:   0. 0 %
    CPU: mcu2_1: TASK:      IPC_TEST_TX:   0. 0 %
    CPU: mcu2_1: TASK:      IPC_TEST_TX:   0. 0 %
    CPU: mcu2_1: TASK:      IPC_TEST_TX:   0. 0 %
    CPU: mcu2_1: TASK:      IPC_TEST_TX:   0. 0 %
    
    CPU: mcu2_1: HEAP:   DDR_SHARED_MEM: size =   16777216 B, free =   16773376 B ( 99 % unused)
    CPU: mcu2_1: HEAP:           L3_MEM: size =     262144 B, free =     262144 B (100 % unused)
    
    CPU:  c6x_1: TASK:           IPC_RX:   0. 0 %
    CPU:  c6x_1: TASK:       REMOTE_SRV:   0. 0 %
    CPU:  c6x_1: TASK:        LOAD_TEST:   0. 0 %
    CPU:  c6x_1: TASK:         TIVX_CPU:   0. 0 %
    CPU:  c6x_1: TASK:      IPC_TEST_RX:   0. 0 %
    CPU:  c6x_1: TASK:      IPC_TEST_TX:   0. 0 %
    CPU:  c6x_1: TASK:      IPC_TEST_TX:   0. 0 %
    CPU:  c6x_1: TASK:      IPC_TEST_TX:   0. 0 %
    CPU:  c6x_1: TASK:      IPC_TEST_TX:   0. 0 %
    CPU:  c6x_1: TASK:      IPC_TEST_TX:   0. 0 %
    
    CPU:  c6x_1: HEAP:   DDR_SHARED_MEM: size =   16777216 B, free =   16773376 B ( 99 % unused)
    CPU:  c6x_1: HEAP:           L2_MEM: size =     229376 B, free =     229376 B (100 % unused)
    CPU:  c6x_1: HEAP:  DDR_SCRATCH_MEM: size =   50331648 B, free =   50331648 B (100 % unused)
    
    CPU:  c6x_2: TASK:           IPC_RX:   0. 0 %
    CPU:  c6x_2: TASK:       REMOTE_SRV:   0. 0 %
    CPU:  c6x_2: TASK:        LOAD_TEST:   0. 0 %
    CPU:  c6x_2: TASK:         TIVX_CPU:   0. 0 %
    CPU:  c6x_2: TASK:      IPC_TEST_RX:   0. 0 %
    CPU:  c6x_2: TASK:      IPC_TEST_TX:   0. 0 %
    CPU:  c6x_2: TASK:      IPC_TEST_TX:   0. 0 %
    CPU:  c6x_2: TASK:      IPC_TEST_TX:   0. 0 %
    CPU:  c6x_2: TASK:      IPC_TEST_TX:   0. 0 %
    CPU:  c6x_2: TASK:      IPC_TEST_TX:   0. 0 %
    
    CPU:  c6x_2: HEAP:   DDR_SHARED_MEM: size =   16777216 B, free =   16773376 B ( 99 % unused)
    CPU:  c6x_2: HEAP:           L2_MEM: size =     229376 B, free =     229376 B (100 % unused)
    CPU:  c6x_2: HEAP:  DDR_SCRATCH_MEM: size =   50331648 B, free =   50331648 B (100 % unused)
    
    CPU:  c7x_1: TASK:           IPC_RX:   0. 0 %
    CPU:  c7x_1: TASK:       REMOTE_SRV:   0. 0 %
    CPU:  c7x_1: TASK:        LOAD_TEST:   0. 0 %
    CPU:  c7x_1: TASK:      TIVX_CPU_PR:   0. 0 %
    CPU:  c7x_1: TASK:      TIVX_CPU_PR:   0. 0 %
    CPU:  c7x_1: TASK:      TIVX_CPU_PR:   0. 0 %
    CPU:  c7x_1: TASK:      TIVX_CPU_PR:   0. 0 %
    CPU:  c7x_1: TASK:      TIVX_CPU_PR:   0. 0 %
    CPU:  c7x_1: TASK:      TIVX_CPU_PR:   0. 0 %
    CPU:  c7x_1: TASK:      TIVX_CPU_PR:   0. 0 %
    CPU:  c7x_1: TASK:      TIVX_CPU_PR:   0. 0 %
    CPU:  c7x_1: TASK:      IPC_TEST_RX:   0. 0 %
    CPU:  c7x_1: TASK:      IPC_TEST_TX:   0. 0 %
    CPU:  c7x_1: TASK:      IPC_TEST_TX:   0. 0 %
    CPU:  c7x_1: TASK:      IPC_TEST_TX:   0. 0 %
    CPU:  c7x_1: TASK:      IPC_TEST_TX:   0. 0 %
    CPU:  c7x_1: TASK:      IPC_TEST_TX:   0. 0 %
    
    CPU:  c7x_1: HEAP:   DDR_SHARED_MEM: size =  268435456 B, free =  268435200 B ( 99 % unused)
    CPU:  c7x_1: HEAP:           L3_MEM: size =    8159232 B, free =    8159232 B (100 % unused)
    CPU:  c7x_1: HEAP:           L2_MEM: size =     458752 B, free =     458752 B (100 % unused)
    CPU:  c7x_1: HEAP:           L1_MEM: size =      16384 B, free =      16384 B (100 % unused)
    CPU:  c7x_1: HEAP:  DDR_SCRATCH_MEM: size =  385875968 B, free =  385875968 B (100 % unused)
    
    
    GRAPH: app_multi_cam_graph (#nodes =   4, #executions = 109623)
     NODE:       CAPTURE1:             capture_node: avg =  17776 usecs, min/max =    108 /  50242 usecs, #executions =     109623
     NODE:       DSS_M2M1:              FmtConvNode: avg =   2128 usecs, min/max =   2101 /   2457 usecs, #executions =     109623
     NODE:      VPAC_MSC1:              mosaic_node: avg =   2882 usecs, min/max =   2854 /  11757 usecs, #executions =     109623
     NODE:       DISPLAY1:              DisplayNode: avg =   9229 usecs, min/max =     85 /  33045 usecs, #executions =     109623
    
     PERF:           FILEIO: avg =    895 usecs, min/max =    765 /  11171 usecs, #executions =     109622
     PERF:            TOTAL: avg =  33481 usecs, min/max =  15334 /  83389 usecs, #executions =     109581
    
     PERF:            TOTAL:   29.86 FPS


     =========================
     Demo : Camera Demo
     =========================
    
     s: Save CSIx, VISS and LDC outputs
    
     p: Print performance statistics
    
     x: Exit
    
     Enter Choice: 
    
    
     =========================
     Demo : Camera Demo
     =========================
    
     s: Save CSIx, VISS and LDC outputs
    
     p: Print performance statistics
    
     x: Exit
    
     Enter Choice: [MCU2_0]   3725.862477 s: ==========================================================
    [MCU2_0]   3725.862579 s:  Capture Status: Instance|0
    [MCU2_0]   3725.862617 s: ==========================================================
    [MCU2_0]   3725.862661 s:  overflowCount: 0
    [MCU2_0]   3725.862694 s:  spuriousUdmaIntrCount: 0
    [MCU2_0]   3725.862728 s:  frontFIFOOvflCount: 0
    [MCU2_0]   3725.862758 s:  crcCount: 0
    [MCU2_0]   3725.862786 s:  eccCount: 0
    [MCU2_0]   3725.862816 s:  correctedEccCount: 0
    [MCU2_0]   3725.862847 s:  dataIdErrorCount: 0
    [MCU2_0]   3725.862880 s:  invalidAccessCount: 0
    [MCU2_0]   3725.862911 s:  invalidSpCount: 0
    [MCU2_0]   3725.862947 s:  strmFIFOOvflCount[0]: 0
    [MCU2_0]   3725.862985 s:  Channel Num | Frame Queue Count | Frame De-queue Count | Frame Drop Count | Error Frame Count |
    [MCU2_0]   3725.863063 s:            0 |            109626 |               109624 |              494 |                 0 |


    Thanks 

    Michael

  • Hi Michael,

    Which SDK release are you using? Are you doing some encode operation using gstreamer plugin?

    Regards,

    Brijesh

  • Hi Brijesh,

    I am using version 08_02_00_05.

    Yes, there is some encode operation with gstreamer.

    It is gstreamer command for camera side.

    gst-launch-1.0 -vvv v4l2src device=/dev/video2 ! videoconvert ! video/x-raw, format=NV12 ! jpegenc ! jpegparse ! rtpjpegpay ! udpsink host=192.168.1.2 port=5000 

    Thanks

    Michael

  • Hi ,

    The reason for asking this question was to check if there is any delay in encoding operation. Can you please check encoder performance for your resolution and see if it can support 30fps performance? 

    Regards,

    Brijesh 

  • Hi Brijesh,

    1. TDA4 (camera resolution: 1080x672) ---> PC 

        TDA4 gstreamer cpu usage is around 28%. On the Rx side, screen freezes momentarily.

        ---> PC is the one to blame that cause temporary freeze.

    2. TDA4 (camera resolution: 1080x672) ---> TDA4

        TDA4 gstreamer cpu usage is around 28%. On the Rx side, FPS keeps around 30 most of time.

        ---> On the camera side, jpegenc takes almost 8 ms for a frame and the whole pipeline takes around 9 ms something.

    3. TDA4 (camera resolution: 1080x1344) ---> PC 

        TDA4 gstreamer cpu usage is around 80%. On the Rx side, screen freezes frequently.

        ---> On the camera side, jpegenc takes almost 15 ms and videoconvert takes aorund 35 ms. If videoconvert is removed, it can send 30 fps out most of time. .

    Thanks 

    Michael

  • Hi Michael,

    Ok so, the issue is not because of the mosaic node or openvx pipeline, but it seems it is due to encoder, particularly some videoconvert. Not sure what it is doing, is it some kind of video format conversion operation? 

    Regards,

    Brijesh 

  • Also this videoconvert operation runs on ARM using gstreamer plugin and is not required if input format is already NV12. So can you please remove this module? because mosaic output is already in NV12 format.

    Regards,

    Brijesh

  • Hi Brijesh/Michael:

    I'm thinking to lower the FPS or resolution or enlarger the compression ratio might be a workaround solution of this?

    BR Rio

  • I think it is better to remove videoconvert module, as this runs on A72 and can take more time as the resource increases. Since mosaic output is already in the NV12 format, i really dont think this module is required..

    Regards,

    Brijesh

  • Hi Brijesh/Rio,

    Videoconvert  is redundant here, so it is no longer an isuue.

    TDA4 can process 30 fps if videoconvert is removed.

    You may close this thread.

    Thanks 

    Michael

  • Thanks Michael.

  • Thanks, Brijesh !.