This thread has been locked.

If you have a related question, please click the "Ask a related question" button in the top right corner. The newly created question will be automatically linked to this question.

SK-TDA4VM: Gstreamer object detection latency issues

Part Number: SK-TDA4VM
Other Parts Discussed in Thread: TDA4VM

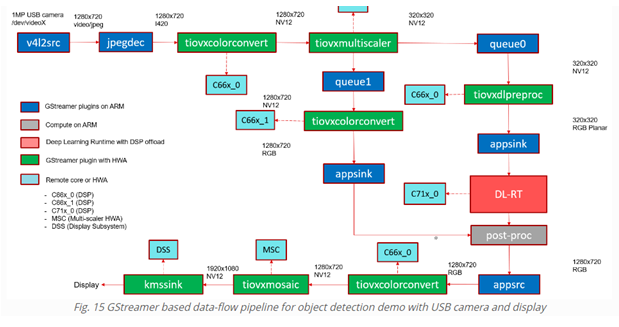
We are using a  pipeline similar to the object detection dataflow provided by TI (Link). The pipeline is set to take and output at a resolution of 1920x1080 at 60 FPS.


Query 1: Any method to debug the gstreamer pipeline in the TDA4VM board so that data bottlenecks within the pipeline can be determined? Any bottlenecks that is already known by TI in this pipeline would also be helpful.


Query 2: A delay is observed in this pipeline between the input frame in this pipeline, and its output of 0.5 s (500ms). This is observed at lower resolutions as well (640x480).  A method to determine which elements are causing the delay issues would be helpful. If TI is already aware of the elements causing the delay in this current pipeline, this also would be beneficial

  • Hi Gokul,

    Let me know if this helps: https://software-dl.ti.com/jacinto7/esd/processor-sdk-linux-sk-tda4vm/08_04_00/exports/docs/performance_visualizer.html#parse-gst-tracers

    On the same documentation, there is a performance visualizer tool which can be used to determine load on the different cores. If you find a core loaded to 100%, you can try moving the element to run on a different core, or replace/remove the plugin from the pipeline.

    Regards,

    Takuma

  • Hi Takuma,

    I tried the gst pipeline given below with the tools you mentioned.

    GST_DEBUG_FILE=pipeline-kmssink-sync-false-480.log GST_DEBUG_NO_COLOR=1 GST_DEBUG="GST_TRACER:7" GST_TRACERS="latency(flags=element)" gst-launch-1.0 v4l2src device=/dev/video2 ! image/jpeg, width=640, height=480, framerate=60/1 ! jpegdec ! tiovxcolorconvert ! video/x-raw, format=NV12 ! kmssink sync=false driver-name=tidss -v

    The output is displayed at 30 FPS. The GST log is given below

    The CPU log is also taken, and is as shown below

    I am trying to find the bottleneck in displaying the output at 60FPS. So I removed the last element, kmssink, but keeping the messagetype from tiovxcolorconvert the same. The new pipeline is given below

    GST_DEBUG_FILE=pipeline-kmssink-remove-480.log GST_DEBUG_NO_COLOR=1 GST_DEBUG="GST_TRACER:7" GST_TRACERS="latency(flags=element)" gst-launch-1.0 v4l2src device=/dev/video2 ! image/jpeg, width=640, height=480, framerate=60/1 ! jpegdec ! tiovxcolorconvert ! video/x-raw, format=NV12 ! fakesink

    The FPS is at 60 FPS, and the gst stats is as given below

    Hence, it looks like the kmssink gst element is limiting the FPS to 30, even though the rest of the pipeline is capable of 60 FPS.

    Please help on any method that can be implemented to improve the FPS in this case.

    Thanks,

    Gokul

  • Hi Gokul,

    I am also able to observe the behavior on my set up as well. I have let the team know about it to see if this is a known issue.

    As a test, I am able to use a different sink to achieve 60fps:

    1. Start weston compositor: /etc/init.d/weston start
    2. Run test pipeline using different sink (glimagesink to be exact): gst-launch-1.0 videotestsrc ! video/x-raw, framerate=60/1, width=1920, height=1080 ! fpsdisplaysink video-sink="glimagesink"

    So it seems there is something limiting the framerate for kmssink particularly.

    Regards,

    Takuma

  • Hi Gokul,

    Unlocking this thread, because our team found another fix.

    The following gstreamer pipeline can be used to achieve 60 fps using kmssink:

    gst-launch-1.0 videotestsrc ! video/x-raw,width=1920,height=1080,format=NV12,framerate=60/1 ! fpsdisplaysink video-sink="kmssink force-modesetting=true driver-name=tidss sync=false" sync=false text-overlay=false -v

    It seems text-overlay from fpsdisplaysink limits fps to 30, and forcemodesetting=true from kmssink is needed to manually choose the capability of kmssink.

    Regards,

    Takuma