This thread has been locked.

If you have a related question, please click the "Ask a related question" button in the top right corner. The newly created question will be automatically linked to this question.

AM6442: PRU assembly; debugging macros and other features

Part Number: AM6442
Other Parts Discussed in Thread: AM6548

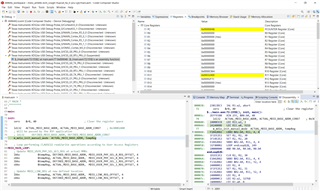
The PRU cores add great value to TI's processor lineups. However the debugging experience in CCS leaves something to be desired. For example, debugging PRU assembly in CCS becomes difficult when macros are used since each debugger step shifts the focus back to the file that called the macro, not the file where the macro is located. This also results in line highlighting being unhelpful since the highlight position is on the line that called the macro instead of the line that's actually being executed within the macro. TI's examples make heavy use of macros so this problem comes up often when debugging.

Are there any options in CCS that might provide a better experience when debugging macros in PRU assembly?

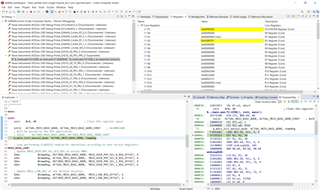
Also, it seems that hovering the cursor over the disassembly does not show register values like we get when debugging C code on other processors in CCS (eg for R5F and A53 ARM cores this feature works for variables within C code). Since the debugger can read the PRU registers, it seems like this is possible at least in theory. We'd like to request this feature be added since it would simplify debugging.

We are using CCS 12.1 on Windows with AM6442 and AM6548.

  • Hello Steven,

    Step function debug

    To confirm, there are two "step" buttons - "step into", and "step over". I would expect that using the "step into" button would allow you to highlight the line within the macro that is being executed. Is that not happening for you?

    Register view 

    There is a separate register & variables view that you can enable in CCS. Does that provide the information you are looking for?

    For more information, please reference the Debugging portion of the PRU Getting Started Labs: https://software-dl.ti.com/processor-sdk-linux/esd/AM64X/08_04_01_04/exports/docs/common/PRU-ICSS/PRU-Getting-Started-Labs_Lab5.html

    Regards,

    Nick

  • Hi Nick,

    I feel that I may have monopolized your time lately but thanks for all of the support.

    When debugging PRU assembly there are 2 step buttons, "Assembly Step Into" and "Assembly Step Over". If I use the "Assembly Step Into" button the line that called the macro remains highlighted until the last macro instruction is executed. It does not shift focus to the source file where the macro is located or step through the assembly inside the macro.

    The disassembly window does show all instructions as they are executed, but it only shows the "raw" assembly without comments or context.

  • Hello Steven,

    Hmm, that sounds like a potential bug. I would expect that the PC should continue pointing to the assembly instruction that is being executed, even if that assembly instruction is in a macro. 

    Can I get you to provide a snippet of code or sample project where you see the behavior? Please also provide screenshots of what you are seeing on the CCS Debug screen. I am going to reassign this thread to get someone from the CCS team to take a look and see if this is expected behavior.

    Regards,

    Nick

  • Hi Nick,

    To be clear, the program counter does continue pointing to the assembly instruction being executed in the disassembly window. But the line highlighting does not track in the source code window.

    Here's an example using CCS v12.1 on Windows with AM64EVM (new one, SR2.0) with XDS200 JTAG. I am using the PRU MDIO example provided in MCU+ SDK v8.04 (located at <sdk>/examples/pru_io/mdio_fw). 

    After program loaded, I stepped until I reached the first macro on line 77:

    Pressing "Assembly Step Into" once:

    Note the source code window on the bottom left continues to highlight the same line in main.asm that called the macro even though it's now executing the macro "m_mdio_init_manual_mode" (defined in the include file mdio_macros.inc, not in main.asm).

  • Hi Steven,

    Note the source code window on the bottom left continues to highlight the same line in main.asm that called the macro even though it's now executing the macro "m_mdio_init_manual_mode" (defined in the include file mdio_macros.inc, not in main.asm).

    I can reproduce the same behavior. When looking at the modules view, I don't see any reference of the symbol is question. I'm following up with one of the debugger engineers and will pass on any updates as I get them.

    Thanks

    ki

  • I'm following up with one of the debugger engineers and will pass on any updates as I get them.

    I received an update.

    The debug information says that m_mdio_init_manual_mode maps to line 77 in main.asm. There is nothing in the debug symbols that maps to the mdio_macros.inc file. Hence the debugger is behaving as expected based on the generated debug symbols for the executable.

    The question is if the emitted debug symbols are correct or not. I will need to follow up with the compiler team on this one.

    Thanks

    ki

  • The question is if the emitted debug symbols are correct or not. I will need to follow up with the compiler team on this one.

    Preliminary investigation seem to indicated that this is a known limitation. In any case, I have filed a bug of this issue.

    Tracking link: https://sir.ext.ti.com/jira/browse/EXT_EP-10943

    Thanks

    ki