This thread has been locked.

If you have a related question, please click the "Ask a related question" button in the top right corner. The newly created question will be automatically linked to this question.

TDA4VM: uboot fails to start

Part Number: TDA4VM

TDA4VM

boot flow :  SBL(tiboot3) --> BL31.bin --> u-boot-spl.bin --> u-boot.img

1. About one boot failure in a hundred times

2. success log and failed log

success log

NOTICE: BL31: v2.4(release):07.03.00.005-dirty
NOTICE: BL31: Built : 00:15:40, Apr 10 2021
ERROR: GTC_CNTFID0 is 0! Assuming 200000000 Hz. Fix Bootloader

U-Boot SPL 2020.01-dirty (May 24 2022 - 11:56:02 +0800)
SYSFW ABI: 3.1 (firmware rev 0x0015 '21.1.1--v2021.01a (Terrific Lla')
Trying to boot from MMC1


U-Boot 2020.01-tda4hozonpdcu8g (Aug 29 2022 - 12:47:43 +0000)

SoC: J721E SR2.0
Model: Texas Instruments K3 J721E SoC
Board: Hirain-TDA4 rev V1.1
DRAM: 8 GiB
Flash: 64 MiB
MMC: sdhci@4f80000: 0, sdhci@4fb0000: 1
Press key-code to abort autoboot in 2 seconds
13 bytes read in 1 ms (12.7 KiB/s)
13 bytes written
RstCounter is error[set default 0]
17 bytes written
20 bytes read in 1 ms (19.5 KiB/s)
PartitionStartCfg is B
14 bytes read in 1 ms (13.7 KiB/s)
RollBackCfg is 1
16 bytes read in 0 ms
RstThreshhold is bigger
switch to partitions #0, OK
mmc0(part 0) is current device
Core 1 is already in use. No rproc commands work
Core 2 is already in use. No rproc commands work
5261624 bytes read in 38 ms (132 MiB/s)
Load Remote Processor 2 with data@addr=0x82000000 5261624 bytes: Success!
2045920 bytes read in 16 ms (121.9 MiB/s)
Load Remote Processor 3 with data@addr=0x82000000 2045920 bytes: Success!
157516 bytes read in 3 ms (50.1 MiB/s)
Load Remote Processor 4 with data@addr=0x82000000 157516 bytes: Success!
157516 bytes read in 2 ms (75.1 MiB/s)
Load Remote Processor 5 with data@addr=0x82000000 157516 bytes: Success!
2795900 bytes read in 20 ms (133.3 MiB/s)
Load Remote Processor 6 with data@addr=0x82000000 2795900 bytes: Success!
2795900 bytes read in 21 ms (127 MiB/s)
Load Remote Processor 7 with data@addr=0x82000000 2795900 bytes: Success!
12946280 bytes read in 89 ms (138.7 MiB/s)
Load Remote Processor 8 with data@addr=0x82000000 12946280 bytes: Success!
libfdt fdt_check_header(): FDT_ERR_BADMAGIC
No FDT memory address configured. Please configure
the FDT address via "fdt addr <address>" command.
Aborting!
7 bytes read in 0 ms
10073204 bytes read in 55 ms (174.7 MiB/s)
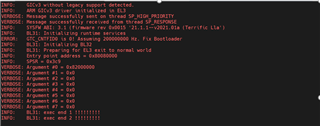
failed log

NOTICE: BL31: v2.4(release):07.03.00.005-dirty
NOTICE: BL31: Built : 00:15:40, Apr 10 2021
ERROR: GTC_CNTFID0 is 0! Assuming 200000000 Hz. Fix Bootloader

3.  the "U-Boot SPL 2020.01-dirty (May 24 2022 - 11:56:02 +0800)" log miss when boot failed , I want to know if this missing LOG is the content of the u-boot-spl.bin program, And where can I see the source code for u-boot-spl.bin

  • Hi 

    3.  the "U-Boot SPL 2020.01-dirty (May 24 2022 - 11:56:02 +0800)" log miss when boot failed , I want to know if this missing LOG is the content of the u-boot-spl.bin program, And where can I see the source code for u-boot-spl.bin

    Yes it is content of the u-bbot-spl.bin it get printed during preloader_console_init()  . You can find the code in the <J721e_sdk>/board-support/<u-boot-version>/arch/arm/mach-k3/j721e_init.c this is soc specific code 

    you can find the upper layer spl source code in <J721e_sdk>/board-support/<u-boot-version>/common/spl

    Regards

    Diwakar 

  • I found the code for u-boot-spl.bin and understood the order in which the code was executed

    u-boot-spl.bin :  _start  --> _main --> board_init_f

    If the boot fails, the u-boot-spl.bin command can be used in two cases according to the Log

    1. u-boot-spl.bin is not executed

    2. u-boot-spl.bin is blocked in the satrt or main

    so i want some suggestions from ti

  • Hi,

    When it is failing can you attach a jtag and check whether it came out of the ATF or still it is in the ATF only. Check for the address range where it is

    getting stuck  if it is in  0x70000000 range it got stuck in ATF.

    Also have you faced this issue when you are using R5 spl boot flow ?

    Regards
    Diwakar

  • i have no jtag and I opened all the logs in bl31.bin and added some logs at the end of the program

    when boot failed , the A72 log as this

    so i think it out of the ATF

  • Hi 

    Is there any way to connect through a debugger as it is not even going to c code(board_init_f) it is difficult to say something 

    we need to connect some debugger and see in the assembly code by adding the breakpoints.

    also have you tried with the R5 SPL boot flow ?

    Regards
    Diwakar

  • Dear Chuang,

         Please check your power supply condition when this failure happens.

     BR

    Sikai

  • hi, i catch It when boot failed by CCS debugger,  but i am confuse and can you give me some suggestion

  • Dear Chuang,

         1. Have you checked your power supply when that failure happens?

         2. Is it possible to add breakpoint to further loacte the error?

    BR

    Sikai

  • 1. when it failed , the power supply is normal

    2. There should be no way to debug breakpoints , because it only fails once when it starts abount 100 times

    3.  I can only connect to the core to check when the boot fails

  • MCU1_0 SBL log

    /*****************************************************************/
    板卡启动成功时的MCU1_0的log
    
    SBL Revision: 01.00.10.00 (Feb 19 2023 - 20:39:49)
    
    SBL_ReadSysfwImage in [330]
    
    
    Getting eMMC parameters
    
    eMMC: BlockCount = 0x3a40000 
    
    eMMC: part_support = 7,part_config =2
    
    TIFS  ver: 21.1.1--v2021.01a (Terrific Lla
    
    SBL_MMCBootImage in [520]
    
    
    Getting eMMC parameters
    
    eMMC: BlockCount = 0x3a40000 
    
    eMMC: part_support = 7,part_config =2
    
    [ads] start mcu0_0 version ++++++A2+++++++
    
    IPC Profile App: 
    
    IPC Profile App:  IPC Profile Application - STARTS !!! 
    
    [ads] start mcu0_0   --> 1 
    
    [ads] start mcu0_0   --> 2 
    
    [ads] start mcu0_0  --> 3  create IpcSpiMasterApp_TaskFxn
    
    IPC_SPI Master Demo App:Transmitted Message of size 4 bytes, 1000 times in 0 usecs
    
    IPC_SPI Master Demo App:Average of   0.00 usecs per transmit 
    
    IPC Profile App:  CDD IPC MCAL Version Info
    
    cs per transmit 
    
    IPC_SPI Master Demo App:Measured Load: Total CPU: 100.000000%, HWI: 0.000000%, SWI:0.000000% TSK: 0.000000%
    
    
    IPC Profile App: ---------------------
    
    otal CPU: 100.000000%, HWI: 0.000000%, SWI:0.000000% TSK: 0.000000%
    
    
    IPC_SPI Master Demo App:SPI Test Passed!!!
    
    IPC Profile App:  Vendor ID           : 44
    
    [ads] start gpt_test 
    
    [PC Profile App:  ModuGPT_APP: Building Interrupt List !!!
    
    GPC Profile App:  SW Major Version   GPT_APP: Variant - Post Build being used !!!
    
    GPC Profile App:  SW Minor Version    : 3
    
    !
    
    GPT_APP: Interrupt List Completed !!!
    
    GPC Profile App:  SW Patch Version    GPT_APP: Variant - Post Build being used !!!
    
    G
    
    _APP: Variant - Post Build being used !!!


     PGPT_APP GPT MCAL Version Info
    
    GPT_APP GPT MCAL Version Info
    
    GPT_APP---------------------
    
    GPT_APP Vendor ID           : 44
    
    GPT_APP Module ID           : 100
    
    GPT_APP SW Major Version    : 1
    
    GPT_APP SW Minor Version    : 3
    
    GPT_APP SW Patch Version    : 2


    ------------------------------------------
    
    GPT_APP: Running GPT Test for channel 6
    
    ------------------------------------------
    
    GPT_APP: Enabled notification for channel [6] is GPT_CH_MODE_CONTINUOUS
    
    GPT_APP: Enabled notification for channel [6]
    
    GPT_APP: Started Timer Channel [6]
    
    GPT_APP: Elapsed Time Value = a8bce
    
    GPT_APP: GPT Stack Usage 8192 bytes
    
    GPT_APP: GPT Stack/section corruption!!!
    
    [ads] start while(1) 
    
    PMIC App:0X31 WR = 0x0,ret=0
    
    PMIC App:0X32 WR = 0x0,ret=0
    
    PMIC App:0X09 RD0 = 0xff,ret=0
    
    PMIC App:0X09 WR = 0xbf,ret=0
    
    PMIC App:0X09 RD1 = 0xbf,ret=0
    
    IPC Profile App: Sync with MASTER1 CPU done...
    
    IPC-Service:  INFO: Register service '[ID: 0]: com.mcu10.info' finished!
    
    IPC Profile App:  Announce Service: ti.ipc4.mcu_pmic
    
    IPC Profile App: 
    
    IPC Profile App:  Starting MCU2_1 to MCU1_0 IPC receive task
    
    IPC Profile App:  failed to receive from comm[2]
    
    IPC Profile App: MCU1_0 INFO: go to sleep
    
    
    /*****************************************************************/
    板卡启动失败时的MCU1_0的log
    
    SBL Revision: 01.00.10.00 (Feb 19 2023 - 20:39:49)
    
    SBL_ReadSysfwImage in [330]
    
    
    Getting eMMC parameters
    
    eMMC: BlockCount = 0x3a40000 
    
    eMMC: part_support = 7,part_config =2
    
    TIFS  ver: 21.1.1--v2021.01a (Terrific Lla
    
    SBL_MMCBootImage in [520]
    
    
    Getting eMMC parameters
    
    eMMC: BlockCount = 0x3a40000 
    
    eMMC: part_support = 7,part_config =2
    
    [ads] start mcu0_0 version ++++++A2+++++++
    
    IPC Profile App: 
    
    IPC Profile App:  IPC Profile Application - STARTS !!! 
    
    [ads] start mcu0_0   --> 1 
    
    [ads] start mcu0_0   --> 2 
    
    [ads] start mcu0_0  --> 3  create IpcSpiMasterApp_TaskFxn


  • Hi 

    Once the issue occur can you connect to A72 and open Disassembly and check where it is stuck.

    Also is  it custom board ?

    Regards
    Diwakar

  • 1. yes , i will have a  try

    2. yes it is custom board