This thread has been locked.

If you have a related question, please click the "Ask a related question" button in the top right corner. The newly created question will be automatically linked to this question.

TDA4VM: High CPU loading when using UDP transfer data

Part Number: TDA4VM


Dear Experts,

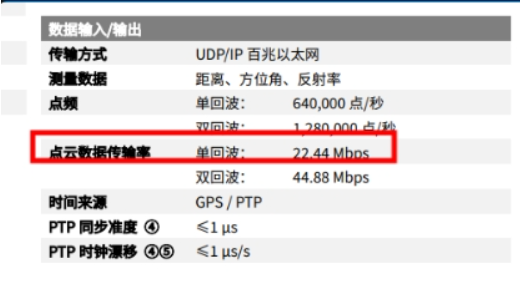
     Our customer are using UDP to transfer laser radar's data. They find CPU loading is 25.5% which is too high when UDP has a speed of 22.44Mbps with 1122btye packet size and the throughput is 2000pps.


     They find a thread named irq/64-main_r5f takes up to 25.5% CPU loading and they wonder if this is normal.


     I let them do the UDP iperf test to see how it comes and they said when they run UDP 100M iperf test the loading is 35%.

     I am going to do a comparison test on our EVM board however I am on a vocation and it may be late. Will update once I come back.

Dear Ruijie,

     Could you help provide which SDK version are you using?

BR

Sikai


  • Hi Sikai, Ruijie,

    Is the traffic ingress or egress?

    Can you check the loading at 1G speeds? We do have a significant CPU loading (~60% reported) at this speed. So 25% should not be that alarming and can very likely be normal.

    Our ethernet test results are presented here. Let me know if your tested results are different from these values.

    Can you check if the linux is receiving any other traffic apart from the UDP traffic? That might be also causing increased CPU loading.

    Regards,
    Tanmay

  • Dear Tanmay,

         I use SDK8.2 to do the iperf test with TDA4VM as server (iperf -u -s) and PC as client (iperf -u -c PC_ip -b 100M -t 60 -i 1 )


        CPU loading is only 5% on EVM board which is far less than 35% reported by customer.

        I also check the performance under 1G test, it shows 15% packet loss and around 22% loading:


    BR

    Sikai

  • Dear sikai & tanmay,

    we found the issue is found in RT linux 0801,because the RT linux create RT irq thread to deal with the irq

    but we close the RT irq thread, we found the softirqd/0  cpu loading is 85%,

    but in normal linux 0801, the softirqd/0 thread cpu loading is only %3 ,why?

    Is there RT linux performance test about cpsw?

    Thanks,

    Ruijie Sun

  • Dear TI,

    we found the function in RT linux,print the num_rx is 1, 2

    [ 273.485958] virt_cpsw_nuss_rx_poll num_rx:4 64
    [ 273.485981] virt_cpsw_nuss_rx_poll num_rx:2 64
    [ 273.485999] virt_cpsw_nuss_rx_poll num_rx:1 64
    [ 273.486019] virt_cpsw_nuss_rx_poll num_rx:2 64
    [ 273.486037] virt_cpsw_nuss_rx_poll num_rx:1 64
    [ 273.486057] virt_cpsw_nuss_rx_poll num_rx:2 64
    [ 273.486078] virt_cpsw_nuss_rx_poll num_rx:2 64
    [ 273.486095] virt_cpsw_nuss_rx_poll num_rx:1 64
    [ 273.486115] virt_cpsw_nuss_rx_poll num_rx:2 64
    [ 273.486351] virt_cpsw_nuss_rx_poll num_rx:19 64
    [ 273.486488] virt_cpsw_nuss_rx_poll num_rx:11 64
    [ 273.486613] virt_cpsw_nuss_rx_poll num_rx:10 64
    [ 273.486711] virt_cpsw_nuss_rx_poll num_rx:8 64
    [ 273.486831] virt_cpsw_nuss_rx_poll num_rx:10 64
    [ 273.486866] virt_cpsw_nuss_rx_poll num_rx:3 64
    [ 273.486886] virt_cpsw_nuss_rx_poll num_rx:1 64
    [ 273.486908] virt_cpsw_nuss_rx_poll num_rx:2 64
    [ 273.486929] virt_cpsw_nuss_rx_poll num_rx:2 64
    [ 273.486946] virt_cpsw_nuss_rx_poll num_rx:1 64
    [ 273.486966] virt_cpsw_nuss_rx_poll num_rx:2 64
    [ 273.486994] virt_cpsw_nuss_rx_poll num_rx:2 64
    [ 273.487015] virt_cpsw_nuss_rx_poll num_rx:2 64
    [ 273.487041] virt_cpsw_nuss_rx_poll num_rx:2 64

    but in normal linux,the num_rx almost is 64, why?

    [ 101.583869] virt_cpsw_nuss_rx_poll num_rx:64 64
    [ 101.588625] virt_cpsw_nuss_rx_poll num_rx:64 64
    [ 101.593357] virt_cpsw_nuss_rx_poll num_rx:64 64
    [ 101.598092] virt_cpsw_nuss_rx_poll num_rx:64 64
    [ 101.602807] virt_cpsw_nuss_rx_poll num_rx:64 64
    [ 101.607539] virt_cpsw_nuss_rx_poll num_rx:64 64
    [ 101.612246] virt_cpsw_nuss_rx_poll num_rx:64 64
    [ 101.616995] virt_cpsw_nuss_rx_poll num_rx:64 64
    [ 101.621740] virt_cpsw_nuss_rx_poll num_rx:64 64
    [ 101.626487] virt_cpsw_nuss_rx_poll num_rx:64 64
    [ 101.631232] virt_cpsw_nuss_rx_poll num_rx:64 64
    [ 101.635969] virt_cpsw_nuss_rx_poll num_rx:64 64
    [ 101.640712] virt_cpsw_nuss_rx_poll num_rx:64 64

    Thanks,

    Ruijie Sun

  • i think for RT linux in order to reduce the latency to process ethernet packets timely, which at the cost of high cpu loading.

    you can check or compare the kconfig for RT linux, for example if the "CONFIG_NET_RX_BUSY_POLL" is enabled under RT, this high cpu loading is absolutely normal. 

    thanks. 

  • the "CONFIG_NET_RX_BUSY_POLL" is disabled

  • hi xu,

    enable the he "CONFIG_NET_RX_BUSY_POLL" in RT linux, but the log show the poll packets is low,

    Is there any way to make RT linux run up to 64 as much as possible to reduce interruptions?

    [ 40.154611] virt_cpsw_nuss_rx_poll num_rx:6 64
    [ 40.154703] virt_cpsw_nuss_rx_poll num_rx:7 64
    [ 40.154776] virt_cpsw_nuss_rx_poll num_rx:6 64
    [ 40.154845] virt_cpsw_nuss_rx_poll num_rx:6 64
    [ 40.154911] virt_cpsw_nuss_rx_poll num_rx:5 64
    [ 40.154976] virt_cpsw_nuss_rx_poll num_rx:5 64
    [ 40.155046] virt_cpsw_nuss_rx_poll num_rx:6 64
    [ 40.155137] virt_cpsw_nuss_rx_poll num_rx:7 64
    [ 40.155209] virt_cpsw_nuss_rx_poll num_rx:6 64
    [ 40.155279] virt_cpsw_nuss_rx_poll num_rx:6 64
    [ 40.155343] virt_cpsw_nuss_rx_poll num_rx:5 64
    [ 40.155408] virt_cpsw_nuss_rx_poll num_rx:5 64
    [ 40.155480] virt_cpsw_nuss_rx_poll num_rx:6 64
    [ 40.155573] virt_cpsw_nuss_rx_poll num_rx:8 64
    [ 40.155646] virt_cpsw_nuss_rx_poll num_rx:6 64

    Thanks,

    Ruijie Sun

  • Ruijie, the poll function is actually running under the context of softirq(kernel thread), so the cpu will be very intensive and high loaded to process the packets as much and as soon as possible. 

  • hi xu,

    thanks for your reply, is there the performance test in RT linux about CPSW?

    Thanks,

    Ruijie Sun

  • Ruijie, we usually don't use RT Linux from field team. Another suggestion is to check your jiffes within the RT Linux, if it is 1m, you can change the config to make it 10ms and try. (100Hz)

  • hi XU,

    modify the CONFIG_HZ=100,  the top result have no change

    CONFIG_HZ_100=y
    # CONFIG_HZ_250 is not set
    # CONFIG_HZ_300 is not set
    # CONFIG_HZ_1000 is not set
    CONFIG_HZ=100

    Thanks,

    Ruijie Sun

  • actually, it's not a good idea to use the RT-Linux for production unless you clearly understand all the changes in between. Do you have high loading issue under the standard Processor SDK Linux? if not i would suggest to use that one. 

  • hi xu,

    thanks for your suggestion

    Thanks,

    Ruijie Sun