Other Parts Discussed in Thread: UNIFLASH
There is a R5F empty example under MCU SDK, how to run it?
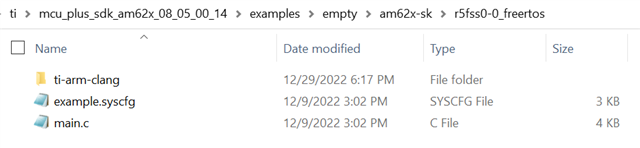
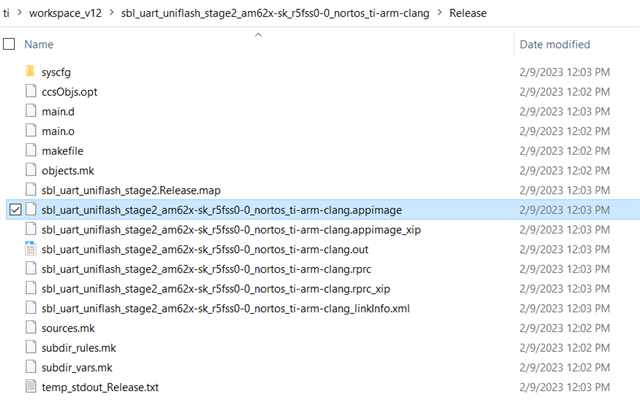
I tried if not boot A53 Linux, connect CCS, download empty_am62x-sk_r5fss0-0_freertos_ti-arm-clang\Debug\empty_am62x-sk_r5fss0-0_freertos_ti-arm-clang.out
MAIN_Cortex_R5_0_0: GEL Output: ctl_int_status = 0x02000000...
MAIN_Cortex_R5_0_0: GEL Output: --->>> DDR Initialization completed... <<<---
MAIN_Cortex_R5_0_0: GEL Output: --->>> DDR4 Initialization is DONE! <<<---
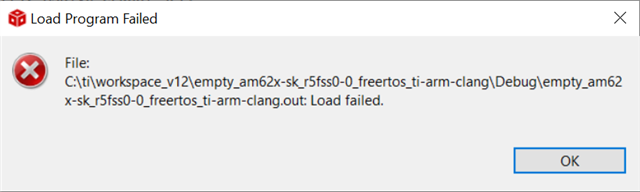
MAIN_Cortex_R5_0_0: Trouble Writing Memory Block at 0x41010040 on Page 0 of Length 0x2210: (Error -1065 @ 0x0) Unable to access device memory. Verify that the memory address is in valid memory. If error persists, confirm configuration, power-cycle board, and/or try more reliable JTAG settings (e.g. lower TCLK). (Emulation package 9.8.0.00235)
MAIN_Cortex_R5_0_0: File Loader: Verification failed: Target failed to write 0x41010040
MAIN_Cortex_R5_0_0: GEL: File: C:\ti\workspace_v12\empty_am62x-sk_r5fss0-0_freertos_ti-arm-clang\Debug\empty_am62x-sk_r5fss0-0_freertos_ti-arm-clang.out: Load failed.
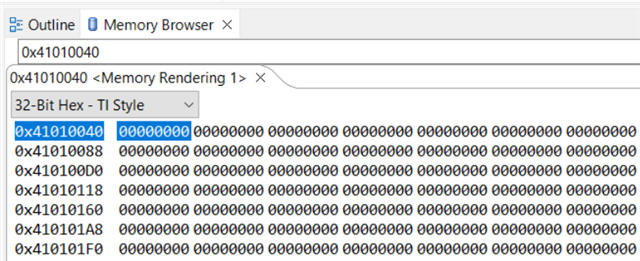
Address 0x41010040 can't be modified in Memory Browser also.
if boot A53 with Linux first, then connect JTAG from CCS, Linux report error in console as below:
[ 48.506962] ti-sci 44043000.system-controller: Mbox send fail -110
Unhandled Exception in EL3.
x30 = 0x000000009e780f88
x0 = 0xffff800011595024
x1 = 0xffff80001116fd70
x2 = 0x0000000000000000
x3 = 0x0000000000000000
x4 = 0x0000000000000000
x5 = 0x0000000000000000
x6 = 0xffff0000002ddda0
x7 = 0x0000000000000000
x8 = 0x0000000000017fe8
x9 = 0xffff8000110f83f8
x10 = 0xffff8000110f83a0
x11 = 0xffff8000111103e0
x12 = 0x00000000ffffffea
x13 = 0xffff0000036e0530
x14 = 0x000000000000016c
x15 = 0xffff0000036e0530
x16 = 0x0000000000000000
x17 = 0x0000000000000000
x18 = 0x0000000000000010
x19 = 0xffff000001993000
x20 = 0x00000000000001f4
x21 = 0xffff800011dc3978
x22 = 0xffff0000042a8c10
x23 = 0xffff000004260280
x24 = 0x0000000000000004
x25 = 0x0000000000000000
x26 = 0xffff0000036e0000
x27 = 0xffff0000042a8d48
x28 = 0x0000000000000000
x29 = 0xffff800011dc38c0
scr_el3 = 0x000000000000073d
sctlr_el3 = 0x0000000030cd183f
cptr_el3 = 0x0000000000000000
tcr_el3 = 0x0000000080803520
daif = 0x00000000000002c0
mair_el3 = 0x00000000004404ff
spsr_el3 = 0x0000000020000005
elr_el3 = 0xffff800010858360
ttbr0_el3 = 0x000000009e7910c0
esr_el3 = 0x0000000092000010
far_el3 = 0xffff800011595024
spsr_el1 = 0x0000000040000005
elr_el1 = 0xffff8000100b5808
spsr_abt = 0x0000000000000000
spsr_und = 0x0000000000000000
spsr_irq = 0x0000000000000000
spsr_fiq = 0x0000000000000000
sctlr_el1 = 0x0000000034d4d91d
actlr_el1 = 0x0000000000000000
cpacr_el1 = 0x0000000000300000
csselr_el1 = 0x0000000000000000
sp_el1 = 0xffff800011dc38c0
esr_el1 = 0x0000000056000000
ttbr0_el1 = 0x0000000081b65000
ttbr1_el1 = 0x0002000082eb9000
mair_el1 = 0x000c0400bb44ffff
amair_el1 = 0x0000000000000000
tcr_el1 = 0x00000032b5d03590
tpidr_el1 = 0xffff80006ec4c000
tpidr_el0 = 0x0000000000000000
tpidrro_el0 = 0x0000000000000000
par_el1 = 0x0000000000000000
mpidr_el1 = 0x0000000080000000
afsr0_el1 = 0x0000000000000000
afsr1_el1 = 0x0000000000000000
contextidr_el1 = 0x0000000000000000
vbar_el1 = 0xffff800010010800
cntp_ctl_el0 = 0x0000000000000005
cntp_cval_el0 = 0x000000029334ea8a
cntv_ctl_el0 = 0x0000000000000000
cntv_cval_el0 = 0x0000000000000000
cntkctl_el1 = 0x00000000000000d6
sp_el0 = 0xffff0000036e0000
isr_el1 = 0x0000000000000040
dacr32_el2 = 0x0000000000000000
ifsr32_el2 = 0x0000000000000000
cpuectlr_el1 = 0x0000000000000040
cpumerrsr_el1 = 0x00000000011407ba
l2merrsr_el1 = 0x0000000010140048
cpuactlr_el1 = 0x00001000090ca000
[ 50.544156] ti-sci 44043000.system-controller: Mbox timedout in resp(caller: ti_sci_cmd_put_device+0x18/0x28)
[ 50.554078] ti-sci 44043000.system-controller: Mbox send fail -110
[ 55.580128] rcu: INFO: rcu_preempt detected stalls on CPUs/tasks:
[ 55.586233] rcu: 3-...0: (1 ticks this GP) idle=f4a/1/0x4000000000000000 softirq=7799/7801 fqs=2599
[ 55.595437] (detected by 1, t=5255 jiffies, g=8405, q=6046)
[ 55.601080] Task dump for CPU 3:
[ 55.604299] task:kworker/3:0H state:R running task stack: 0 pid: 28 ppid: 2 flags:0x0000002a
[ 55.614218] Workqueue: kblockd blk_mq_run_work_fn
[ 55.618911] Call trace:
[ 55.621354] __switch_to+0xc0/0x118
[ 55.624835] 0xffff800011423730
[ 55.627970] _dev_err+0x64/0x88
[ 55.631103] ti_sci_set_device_state+0x108/0x1b0
[ 55.635708] ti_sci_cmd_get_device_exclusive+0x18/0x28
[ 55.640832] 0xffffff92