Other Parts Discussed in Thread: TDA4VM
Hi Pratik,
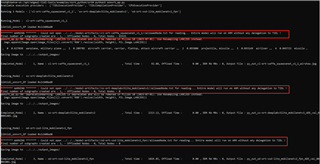
Sorry, it is my environmental reason, other models have no problem. I have another problem about model deployment, please help solve.I have not changed anything in edgeai-tidl-tools. The model can be compiled and inference on the PC successfully.The log on PC as follows:

And then, I copy the below folders from PC to the EVM(J721E).
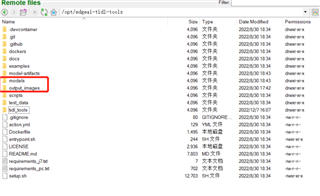

Setp 3, I did the following:
Setp 4, ./root@tda4vm-sk:/opt/edgeai-tidl-tools/examples/osrt_python/ort# python3 ./onnxrt_ep.py. It can not run on TDA4VM.
root@tda4vm-sk:/opt/edgeai-tidl-tools/examples/osrt_python/ort# python3 ./onnxrt_ep.py
Available execution providers : ['TIDLExecutionProvider', 'TIDLCompilationProvider', 'CPUExecutionProvider']
Running 4 Models - ['cl-ort-resnet18-v1', 'cl-ort-caffe_squeezenet_v1_1', 'ss-ort-deeplabv3lite_mobilenetv2', 'od-ort-ssd-lite_mobilenetv2_fpn']
Running_Model : cl-ort-resnet18-v1
2022-08-30 10:23:15.006334085 [W:onnxruntime:, graph.cc:3106 CleanUnusedInitializers] Removing initializer 'layer4.0.downsample.1.num_batches_tracked'. It is not used by any node and should be removed from the model.
2022-08-30 10:23:15.006423800 [W:onnxruntime:, graph.cc:3106 CleanUnusedInitializers] Removing initializer 'layer4.0.bn2.num_batches_tracked'. It is not used by any node and should be removed from the model.
2022-08-30 10:23:15.006453300 [W:onnxruntime:, graph.cc:3106 CleanUnusedInitializers] Removing initializer 'layer4.1.bn2.num_batches_tracked'. It is not used by any node and should be removed from the model.
2022-08-30 10:23:15.006476555 [W:onnxruntime:, graph.cc:3106 CleanUnusedInitializers] Removing initializer 'layer2.0.bn1.num_batches_tracked'. It is not used by any node and should be removed from the model.
2022-08-30 10:23:15.006497650 [W:onnxruntime:, graph.cc:3106 CleanUnusedInitializers] Removing initializer 'layer1.1.bn2.num_batches_tracked'. It is not used by any node and should be removed from the model.
2022-08-30 10:23:15.006515840 [W:onnxruntime:, graph.cc:3106 CleanUnusedInitializers] Removing initializer 'layer3.0.bn2.num_batches_tracked'. It is not used by any node and should be removed from the model.
2022-08-30 10:23:15.006534120 [W:onnxruntime:, graph.cc:3106 CleanUnusedInitializers] Removing initializer 'layer1.0.bn2.num_batches_tracked'. It is not used by any node and should be removed from the model.
2022-08-30 10:23:15.006551900 [W:onnxruntime:, graph.cc:3106 CleanUnusedInitializers] Removing initializer 'layer1.1.bn1.num_batches_tracked'. It is not used by any node and should be removed from the model.
2022-08-30 10:23:15.006569570 [W:onnxruntime:, graph.cc:3106 CleanUnusedInitializers] Removing initializer 'layer2.0.downsample.1.num_batches_tracked'. It is not used by any node and should be removed from the model.
2022-08-30 10:23:15.006587240 [W:onnxruntime:, graph.cc:3106 CleanUnusedInitializers] Removing initializer 'layer1.0.bn1.num_batches_tracked'. It is not used by any node and should be removed from the model.
2022-08-30 10:23:15.006606435 [W:onnxruntime:, graph.cc:3106 CleanUnusedInitializers] Removing initializer 'layer2.0.bn2.num_batches_tracked'. It is not used by any node and should be removed from the model.
2022-08-30 10:23:15.006625405 [W:onnxruntime:, graph.cc:3106 CleanUnusedInitializers] Removing initializer 'layer4.1.bn1.num_batches_tracked'. It is not used by any node and should be removed from the model.
2022-08-30 10:23:15.006642380 [W:onnxruntime:, graph.cc:3106 CleanUnusedInitializers] Removing initializer 'layer4.0.bn1.num_batches_tracked'. It is not used by any node and should be removed from the model.
2022-08-30 10:23:15.006661140 [W:onnxruntime:, graph.cc:3106 CleanUnusedInitializers] Removing initializer 'layer3.1.bn2.num_batches_tracked'. It is not used by any node and should be removed from the model.
2022-08-30 10:23:15.006679730 [W:onnxruntime:, graph.cc:3106 CleanUnusedInitializers] Removing initializer 'layer2.1.bn2.num_batches_tracked'. It is not used by any node and should be removed from the model.
2022-08-30 10:23:15.006698155 [W:onnxruntime:, graph.cc:3106 CleanUnusedInitializers] Removing initializer 'bn1.num_batches_tracked'. It is not used by any node and should be removed from the model.
2022-08-30 10:23:15.006718150 [W:onnxruntime:, graph.cc:3106 CleanUnusedInitializers] Removing initializer 'layer2.1.bn1.num_batches_tracked'. It is not used by any node and should be removed from the model.
2022-08-30 10:23:15.006740245 [W:onnxruntime:, graph.cc:3106 CleanUnusedInitializers] Removing initializer 'layer3.0.bn1.num_batches_tracked'. It is not used by any node and should be removed from the model.
2022-08-30 10:23:15.006761610 [W:onnxruntime:, graph.cc:3106 CleanUnusedInitializers] Removing initializer 'layer3.0.downsample.1.num_batches_tracked'. It is not used by any node and should be removed from the model.
2022-08-30 10:23:15.006780995 [W:onnxruntime:, graph.cc:3106 CleanUnusedInitializers] Removing initializer 'layer3.1.bn1.num_batches_tracked'. It is not used by any node and should be removed from the model.
libtidl_onnxrt_EP loaded 0x2072ad60
Final number of subgraphs created are : 1, - Offloaded Nodes - 52, Total Nodes - 52
APP: Init ... !!!
MEM: Init ... !!!
MEM: Initialized DMA HEAP (fd=4) !!!
MEM: Init ... Done !!!
IPC: Init ... !!!
IPC: Init ... Done !!!
REMOTE_SERVICE: Init ... !!!
REMOTE_SERVICE: Init ... Done !!!
4614.967089 s: GTC Frequency = 200 MHz
APP: Init ... Done !!!
4614.967360 s: VX_ZONE_INIT:Enabled
4614.967437 s: VX_ZONE_ERROR:Enabled
4614.967576 s: VX_ZONE_WARNING:Enabled
4614.968984 s: VX_ZONE_INIT:[tivxInitLocal:130] Initialization Done !!!
4614.969217 s: VX_ZONE_INIT:[tivxHostInitLocal:86] Initialization Done for HOST !!!
4615.002619 s: VX_ZONE_ERROR:[ownContextSendCmd:814] Command ack message returned failure cmd_status: -1
4615.002648 s: VX_ZONE_ERROR:[ownContextSendCmd:850] tivxEventWait() failed.
4615.002761 s: VX_ZONE_ERROR:[ownNodeKernelInit:538] Target kernel, TIVX_CMD_NODE_CREATE failed for node TIDLNode
4615.002801 s: VX_ZONE_ERROR:[ownNodeKernelInit:539] Please be sure the target callbacks have been registered for this core
4615.002840 s: VX_ZONE_ERROR:[ownNodeKernelInit:540] If the target callbacks have been registered, please ensure no errors are occurring within the create callback of this kernel
4615.002881 s: VX_ZONE_ERROR:[ownGraphNodeKernelInit:583] kernel init for node 0, kernel com.ti.tidl:1:1 ... failed !!!
4615.002977 s: VX_ZONE_ERROR:[vxVerifyGraph:2055] Node kernel init failed
4615.003017 s: VX_ZONE_ERROR:[vxVerifyGraph:2109] Graph verify failed
TIDL_RT_OVX: ERROR: Verifying TIDL graph ... Failed !!!
TIDL_RT_OVX: ERROR: Verify OpenVX graph failed
./onnxrt_ep.py:100: DeprecationWarning: LANCZOS is deprecated and will be removed in Pillow 10 (2023-07-01). Use Resampling.LANCZOS instead.
imgs.append(Image.open(image_files[i]).convert('RGB').resize((width, height), PIL.Image.LANCZOS))
4615.060725 s: VX_ZONE_ERROR:[ownContextSendCmd:814] Command ack message returned failure cmd_status: -1
4615.060757 s: VX_ZONE_ERROR:[ownContextSendCmd:850] tivxEventWait() failed.
4615.060772 s: VX_ZONE_ERROR:[ownNodeKernelInit:538] Target kernel, TIVX_CMD_NODE_CREATE failed for node TIDLNode
4615.060781 s: VX_ZONE_ERROR:[ownNodeKernelInit:539] Please be sure the target callbacks have been registered for this core
4615.060790 s: VX_ZONE_ERROR:[ownNodeKernelInit:540] If the target callbacks have been registered, please ensure no errors are occurring within the create callback of this kernel
4615.060800 s: VX_ZONE_ERROR:[ownGraphNodeKernelInit:583] kernel init for node 0, kernel com.ti.tidl:1:1 ... failed !!!
4615.060812 s: VX_ZONE_ERROR:[vxVerifyGraph:2055] Node kernel init failed
4615.060821 s: VX_ZONE_ERROR:[vxVerifyGraph:2109] Graph verify failed
4615.060941 s: VX_ZONE_ERROR:[ownGraphScheduleGraphWrapper:820] graph is not in a state required to be scheduled
4615.060953 s: VX_ZONE_ERROR:[vxProcessGraph:755] schedule graph failed
4615.060962 s: VX_ZONE_ERROR:[vxProcessGraph:760] wait graph failed
ERROR: Running TIDL graph ... Failed !!!
4615.087787 s: VX_ZONE_ERROR:[ownContextSendCmd:814] Command ack message returned failure cmd_status: -1
4615.087818 s: VX_ZONE_ERROR:[ownContextSendCmd:850] tivxEventWait() failed.
4615.087845 s: VX_ZONE_ERROR:[ownNodeKernelInit:538] Target kernel, TIVX_CMD_NODE_CREATE failed for node TIDLNode
4615.087864 s: VX_ZONE_ERROR:[ownNodeKernelInit:539] Please be sure the target callbacks have been registered for this core
4615.087882 s: VX_ZONE_ERROR:[ownNodeKernelInit:540] If the target callbacks have been registered, please ensure no errors are occurring within the create callback of this kernel
4615.087901 s: VX_ZONE_ERROR:[ownGraphNodeKernelInit:583] kernel init for node 0, kernel com.ti.tidl:1:1 ... failed !!!
4615.087922 s: VX_ZONE_ERROR:[vxVerifyGraph:2055] Node kernel init failed
4615.087941 s: VX_ZONE_ERROR:[vxVerifyGraph:2109] Graph verify failed
4615.088081 s: VX_ZONE_ERROR:[ownGraphScheduleGraphWrapper:820] graph is not in a state required to be scheduled
4615.088092 s: VX_ZONE_ERROR:[vxProcessGraph:755] schedule graph failed
4615.088100 s: VX_ZONE_ERROR:[vxProcessGraph:760] wait graph failed
ERROR: Running TIDL graph ... Failed !!!
4615.114986 s: VX_ZONE_ERROR:[ownContextSendCmd:814] Command ack message returned failure cmd_status: -1
4615.115015 s: VX_ZONE_ERROR:[ownContextSendCmd:850] tivxEventWait() failed.
4615.115029 s: VX_ZONE_ERROR:[ownNodeKernelInit:538] Target kernel, TIVX_CMD_NODE_CREATE failed for node TIDLNode
4615.115037 s: VX_ZONE_ERROR:[ownNodeKernelInit:539] Please be sure the target callbacks have been registered for this core
4615.115046 s: VX_ZONE_ERROR:[ownNodeKernelInit:540] If the target callbacks have been registered, please ensure no errors are occurring within the create callback of this kernel
4615.115056 s: VX_ZONE_ERROR:[ownGraphNodeKernelInit:583] kernel init for node 0, kernel com.ti.tidl:1:1 ... failed !!!
4615.115068 s: VX_ZONE_ERROR:[vxVerifyGraph:2055] Node kernel init failed
4615.115077 s: VX_ZONE_ERROR:[vxVerifyGraph:2109] Graph verify failed
4615.115184 s: VX_ZONE_ERROR:[ownGraphScheduleGraphWrapper:820] graph is not in a state required to be scheduled
4615.115192 s: VX_ZONE_ERROR:[vxProcessGraph:755] schedule graph failed
4615.115203 s: VX_ZONE_ERROR:[vxProcessGraph:760] wait graph failed
ERROR: Running TIDL graph ... Failed !!!
4615.142019 s: VX_ZONE_ERROR:[ownContextSendCmd:814] Command ack message returned failure cmd_status: -1
4615.142049 s: VX_ZONE_ERROR:[ownContextSendCmd:850] tivxEventWait() failed.
4615.142063 s: VX_ZONE_ERROR:[ownNodeKernelInit:538] Target kernel, TIVX_CMD_NODE_CREATE failed for node TIDLNode
4615.142072 s: VX_ZONE_ERROR:[ownNodeKernelInit:539] Please be sure the target callbacks have been registered for this core
4615.142081 s: VX_ZONE_ERROR:[ownNodeKernelInit:540] If the target callbacks have been registered, please ensure no errors are occurring within the create callback of this kernel
4615.142091 s: VX_ZONE_ERROR:[ownGraphNodeKernelInit:583] kernel init for node 0, kernel com.ti.tidl:1:1 ... failed !!!
4615.142104 s: VX_ZONE_ERROR:[vxVerifyGraph:2055] Node kernel init failed
4615.142113 s: VX_ZONE_ERROR:[vxVerifyGraph:2109] Graph verify failed
4615.142221 s: VX_ZONE_ERROR:[ownGraphScheduleGraphWrapper:820] graph is not in a state required to be scheduled
4615.142229 s: VX_ZONE_ERROR:[vxProcessGraph:755] schedule graph failed
4615.142237 s: VX_ZONE_ERROR:[vxProcessGraph:760] wait graph failed
ERROR: Running TIDL graph ... Failed !!!
4615.169042 s: VX_ZONE_ERROR:[ownContextSendCmd:814] Command ack message returned failure cmd_status: -1
4615.169070 s: VX_ZONE_ERROR:[ownContextSendCmd:850] tivxEventWait() failed.
4615.169083 s: VX_ZONE_ERROR:[ownNodeKernelInit:538] Target kernel, TIVX_CMD_NODE_CREATE failed for node TIDLNode
4615.169092 s: VX_ZONE_ERROR:[ownNodeKernelInit:539] Please be sure the target callbacks have been registered for this core
4615.169101 s: VX_ZONE_ERROR:[ownNodeKernelInit:540] If the target callbacks have been registered, please ensure no errors are occurring within the create callback of this kernel
4615.169111 s: VX_ZONE_ERROR:[ownGraphNodeKernelInit:583] kernel init for node 0, kernel com.ti.tidl:1:1 ... failed !!!
4615.169123 s: VX_ZONE_ERROR:[vxVerifyGraph:2055] Node kernel init failed
4615.169132 s: VX_ZONE_ERROR:[vxVerifyGraph:2109] Graph verify failed
4615.169234 s: VX_ZONE_ERROR:[ownGraphScheduleGraphWrapper:820] graph is not in a state required to be scheduled
4615.169243 s: VX_ZONE_ERROR:[vxProcessGraph:755] schedule graph failed
4615.169278 s: VX_ZONE_ERROR:[vxProcessGraph:760] wait graph failed
ERROR: Running TIDL graph ... Failed !!!
4615.196150 s: VX_ZONE_ERROR:[ownContextSendCmd:814] Command ack message returned failure cmd_status: -1
4615.196179 s: VX_ZONE_ERROR:[ownContextSendCmd:850] tivxEventWait() failed.
4615.196192 s: VX_ZONE_ERROR:[ownNodeKernelInit:538] Target kernel, TIVX_CMD_NODE_CREATE failed for node TIDLNode
4615.196201 s: VX_ZONE_ERROR:[ownNodeKernelInit:539] Please be sure the target callbacks have been registered for this core
4615.196210 s: VX_ZONE_ERROR:[ownNodeKernelInit:540] If the target callbacks have been registered, please ensure no errors are occurring within the create callback of this kernel
4615.196220 s: VX_ZONE_ERROR:[ownGraphNodeKernelInit:583] kernel init for node 0, kernel com.ti.tidl:1:1 ... failed !!!
4615.196233 s: VX_ZONE_ERROR:[vxVerifyGraph:2055] Node kernel init failed
4615.196241 s: VX_ZONE_ERROR:[vxVerifyGraph:2109] Graph verify failed
4615.196349 s: VX_ZONE_ERROR:[ownGraphScheduleGraphWrapper:820] graph is not in a state required to be scheduled
4615.196357 s: VX_ZONE_ERROR:[vxProcessGraph:755] schedule graph failed
4615.196365 s: VX_ZONE_ERROR:[vxProcessGraph:760] wait graph failed
ERROR: Running TIDL graph ... Failed !!!
4615.223210 s: VX_ZONE_ERROR:[ownContextSendCmd:814] Command ack message returned failure cmd_status: -1
4615.223240 s: VX_ZONE_ERROR:[ownContextSendCmd:850] tivxEventWait() failed.
4615.223254 s: VX_ZONE_ERROR:[ownNodeKernelInit:538] Target kernel, TIVX_CMD_NODE_CREATE failed for node TIDLNode
4615.223263 s: VX_ZONE_ERROR:[ownNodeKernelInit:539] Please be sure the target callbacks have been registered for this core
4615.223271 s: VX_ZONE_ERROR:[ownNodeKernelInit:540] If the target callbacks have been registered, please ensure no errors are occurring within the create callback of this kernel
4615.223281 s: VX_ZONE_ERROR:[ownGraphNodeKernelInit:583] kernel init for node 0, kernel com.ti.tidl:1:1 ... failed !!!
4615.223294 s: VX_ZONE_ERROR:[vxVerifyGraph:2055] Node kernel init failed
4615.223302 s: VX_ZONE_ERROR:[vxVerifyGraph:2109] Graph verify failed
4615.223405 s: VX_ZONE_ERROR:[ownGraphScheduleGraphWrapper:820] graph is not in a state required to be scheduled
4615.223413 s: VX_ZONE_ERROR:[vxProcessGraph:755] schedule graph failed
4615.223423 s: VX_ZONE_ERROR:[vxProcessGraph:760] wait graph failed
ERROR: Running TIDL graph ... Failed !!!
4615.250188 s: VX_ZONE_ERROR:[ownContextSendCmd:814] Command ack message returned failure cmd_status: -1
4615.250218 s: VX_ZONE_ERROR:[ownContextSendCmd:850] tivxEventWait() failed.
4615.250232 s: VX_ZONE_ERROR:[ownNodeKernelInit:538] Target kernel, TIVX_CMD_NODE_CREATE failed for node TIDLNode
4615.250242 s: VX_ZONE_ERROR:[ownNodeKernelInit:539] Please be sure the target callbacks have been registered for this core
4615.250250 s: VX_ZONE_ERROR:[ownNodeKernelInit:540] If the target callbacks have been registered, please ensure no errors are occurring within the create callback of this kernel
4615.250260 s: VX_ZONE_ERROR:[ownGraphNodeKernelInit:583] kernel init for node 0, kernel com.ti.tidl:1:1 ... failed !!!
4615.250273 s: VX_ZONE_ERROR:[vxVerifyGraph:2055] Node kernel init failed
4615.250281 s: VX_ZONE_ERROR:[vxVerifyGraph:2109] Graph verify failed
4615.250410 s: VX_ZONE_ERROR:[ownGraphScheduleGraphWrapper:820] graph is not in a state required to be scheduled
4615.250422 s: VX_ZONE_ERROR:[vxProcessGraph:755] schedule graph failed
4615.250430 s: VX_ZONE_ERROR:[vxProcessGraph:760] wait graph failed
ERROR: Running TIDL graph ... Failed !!!
4615.277388 s: VX_ZONE_ERROR:[ownContextSendCmd:814] Command ack message returned failure cmd_status: -1
4615.277416 s: VX_ZONE_ERROR:[ownContextSendCmd:850] tivxEventWait() failed.
4615.277429 s: VX_ZONE_ERROR:[ownNodeKernelInit:538] Target kernel, TIVX_CMD_NODE_CREATE failed for node TIDLNode
4615.277438 s: VX_ZONE_ERROR:[ownNodeKernelInit:539] Please be sure the target callbacks have been registered for this core
4615.277446 s: VX_ZONE_ERROR:[ownNodeKernelInit:540] If the target callbacks have been registered, please ensure no errors are occurring within the create callback of this kernel
4615.277456 s: VX_ZONE_ERROR:[ownGraphNodeKernelInit:583] kernel init for node 0, kernel com.ti.tidl:1:1 ... failed !!!
4615.277468 s: VX_ZONE_ERROR:[vxVerifyGraph:2055] Node kernel init failed
4615.277477 s: VX_ZONE_ERROR:[vxVerifyGraph:2109] Graph verify failed
4615.277583 s: VX_ZONE_ERROR:[ownGraphScheduleGraphWrapper:820] graph is not in a state required to be scheduled
4615.277592 s: VX_ZONE_ERROR:[vxProcessGraph:755] schedule graph failed
4615.277602 s: VX_ZONE_ERROR:[vxProcessGraph:760] wait graph failed
ERROR: Running TIDL graph ... Failed !!!
4615.304353 s: VX_ZONE_ERROR:[ownContextSendCmd:814] Command ack message returned failure cmd_status: -1
4615.304382 s: VX_ZONE_ERROR:[ownContextSendCmd:850] tivxEventWait() failed.
4615.304395 s: VX_ZONE_ERROR:[ownNodeKernelInit:538] Target kernel, TIVX_CMD_NODE_CREATE failed for node TIDLNode
4615.304404 s: VX_ZONE_ERROR:[ownNodeKernelInit:539] Please be sure the target callbacks have been registered for this core
4615.304414 s: VX_ZONE_ERROR:[ownNodeKernelInit:540] If the target callbacks have been registered, please ensure no errors are occurring within the create callback of this kernel
4615.304424 s: VX_ZONE_ERROR:[ownGraphNodeKernelInit:583] kernel init for node 0, kernel com.ti.tidl:1:1 ... failed !!!
4615.304437 s: VX_ZONE_ERROR:[vxVerifyGraph:2055] Node kernel init failed
4615.304445 s: VX_ZONE_ERROR:[vxVerifyGraph:2109] Graph verify failed
4615.304553 s: VX_ZONE_ERROR:[ownGraphScheduleGraphWrapper:820] graph is not in a state required to be scheduled
4615.304562 s: VX_ZONE_ERROR:[vxProcessGraph:755] schedule graph failed
4615.304572 s: VX_ZONE_ERROR:[vxProcessGraph:760] wait graph failed
ERROR: Running TIDL graph ... Failed !!!
4615.331440 s: VX_ZONE_ERROR:[ownContextSendCmd:814] Command ack message returned failure cmd_status: -1
4615.331470 s: VX_ZONE_ERROR:[ownContextSendCmd:850] tivxEventWait() failed.
4615.331484 s: VX_ZONE_ERROR:[ownNodeKernelInit:538] Target kernel, TIVX_CMD_NODE_CREATE failed for node TIDLNode
4615.331493 s: VX_ZONE_ERROR:[ownNodeKernelInit:539] Please be sure the target callbacks have been registered for this core
4615.331501 s: VX_ZONE_ERROR:[ownNodeKernelInit:540] If the target callbacks have been registered, please ensure no errors are occurring within the create callback of this kernel
4615.331509 s: VX_ZONE_ERROR:[ownGraphNodeKernelInit:583] kernel init for node 0, kernel com.ti.tidl:1:1 ... failed !!!
4615.331522 s: VX_ZONE_ERROR:[vxVerifyGraph:2055] Node kernel init failed
4615.331531 s: VX_ZONE_ERROR:[vxVerifyGraph:2109] Graph verify failed
4615.331636 s: VX_ZONE_ERROR:[ownGraphScheduleGraphWrapper:820] graph is not in a state required to be scheduled
4615.331649 s: VX_ZONE_ERROR:[vxProcessGraph:755] schedule graph failed
4615.331654 s: VX_ZONE_ERROR:[vxProcessGraph:760] wait graph failed
ERROR: Running TIDL graph ... Failed !!!
^C 4615.358661 s: VX_ZONE_ERROR:[ownContextSendCmd:814] Command ack message returned failure cmd_status: -1
4615.358689 s: VX_ZONE_ERROR:[ownContextSendCmd:850] tivxEventWait() failed.
4615.358702 s: VX_ZONE_ERROR:[ownNodeKernelInit:538] Target kernel, TIVX_CMD_NODE_CREATE failed for node TIDLNode
4615.358710 s: VX_ZONE_ERROR:[ownNodeKernelInit:539] Please be sure the target callbacks have been registered for this core
4615.358719 s: VX_ZONE_ERROR:[ownNodeKernelInit:540] If the target callbacks have been registered, please ensure no errors are occurring within the create callback of this kernel
4615.358729 s: VX_ZONE_ERROR:[ownGraphNodeKernelInit:583] kernel init for node 0, kernel com.ti.tidl:1:1 ... failed !!!
4615.358741 s: VX_ZONE_ERROR:[vxVerifyGraph:2055] Node kernel init failed
4615.358750 s: VX_ZONE_ERROR:[vxVerifyGraph:2109] Graph verify failed
4615.358855 s: VX_ZONE_ERROR:[ownGraphScheduleGraphWrapper:820] graph is not in a state required to be scheduled
4615.358864 s: VX_ZONE_ERROR:[vxProcessGraph:755] schedule graph failed
4615.358871 s: VX_ZONE_ERROR:[vxProcessGraph:760] wait graph failed
ERROR: Running TIDL graph ... Failed !!!
Traceback (most recent call last):
File "./onnxrt_ep.py", line 271, in <module>
run_model(model, mIdx)
File "./onnxrt_ep.py", line 200, in run_model
imgs, output, proc_time, sub_graph_time, height, width = infer_image(sess, input_images, config)
File "./onnxrt_ep.py", line 114, in infer_image
output = list(sess.run(None, {input_name: input_data}))
File "/usr/local/lib/python3.8/dist-packages/onnxruntime/capi/onnxruntime_inference_collection.py", line 188, in run
return self._sess.run(output_names, input_feed, run_options)
KeyboardInterrupt
4615.383060 s: VX_ZONE_INIT:[tivxHostDeInitLocal:100] De-Initialization Done for HOST !!!
4615.387453 s: VX_ZONE_INIT:[tivxDeInitLocal:193] De-Initialization Done !!!
APP: Deinit ... !!!
REMOTE_SERVICE: Deinit ... !!!
REMOTE_SERVICE: Deinit ... Done !!!
IPC: Deinit ... !!!
IPC: DeInit ... Done !!!
MEM: Deinit ... !!!
DDR_SHARED_MEM: Alloc's: 7 alloc's of 12813124 bytes
DDR_SHARED_MEM: Free's : 7 free's of 12813124 bytes
DDR_SHARED_MEM: Open's : 0 allocs of 0 bytes
DDR_SHARED_MEM: Total size: 536870912 bytes
MEM: Deinit ... Done !!!
APP: Deinit ... Done !!!
Please help me solve this problem. Thank you.
Regards,
Maiunlei