This thread has been locked.

If you have a related question, please click the "Ask a related question" button in the top right corner. The newly created question will be automatically linked to this question.

TDA4VM: Start Debugger on MCU with Lauterbach

Part Number: TDA4VM

Hello All,

I am trying to debug my code running into the TDA4VM board, the same at the moment is only using one of the cores on the MCU. The thing is that when I start the debugger the same for some reason get stucked on teh next address :

one thing I noticed ( because I'm using as a starting point for this script the one from the demo folders ) is that with the demo elf file run as expected the demo software, could be something related with the configuration I'm keeping from the demo on the cmm script?

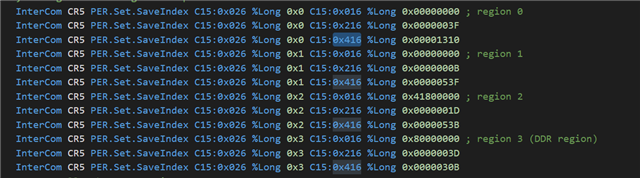
I notice that into the cmm script the next thing is being set:

Configuring in some way some memory regions, what are those C15 that are being set to some memory address, this should be configured according my map file for the memory address and starting points for my project?..

Where I can found information related to that? So far I was looking into the PDF's provided with the T32 installation but no handle to found any information related on how to configure/set those C15. 

I'm not pretty sure this is the root source of my issues, but I think could be related.

One thing, this very same software I handle to debug using the Blackhawk prove, but now is intended to move to the Lauterbach ones.

Is anyone able to give me some advice/hint on this?..

Regards,

Ady

  • In your first screen shot, it looks like you are looping in an branch to wfi.  If you have 'mask interrupts' enabled while stepping you might only see your code caught in such a loop.

    Your other description about not being able to step code, could be due to the R5 MPU setup.  The MPU region will need to have 'execute' and be of a 'normal' memory type.  The CMM scripts only are setting up areas which match the sieve executable.   Once you see your debug connection is correct based on the sieve demo you should try and make the jump to the SDK based code.  There are too many details to rewrite everything from scratch.  If you want to prototype small ARM sequences, using the TRACE32 simulator might be the easiest path.

  • Hello Richard, 

    Thank you for your answer.

    Where I can find more information about how to add this "execute", and what do you mean with be of a "normal" memory type, not being flashed into the DDR do you mean?

    I already checked the connections physically into the board and seems to be correct.

    Also where I can found a "guide" for doing a "scratch" script?.. 

  • Hello Ady,

    The MPU region setup is documented in the ARM Cortex-R5 TRM.  This can be downloaded from the ARM website.  ARM also has provides a Cortex-R programmers guide which gives a good summary.

    From the debugger point of view, you can open the PER file for the CPU.  I you need to make sure the section attributes where your code is compiled for does not have NOEXEC set, and has FULL-Access (or at least access in the state you run it) and a memory type of cached or nonrmal-non-cached.  With those settings code can be executed.  See the attached video for how to check the MPU.

    Regards,
    Richard W.
  • Hello Richard,

    Thank you again for your reply.

    I have a final question,

    In the above image are being in someway set some "memory regions", what imply each one of the lines, for example: If I am understanding well, each one of the lines "C15: 0x016 %Long" are setting where that memory region start?.. Am I right with this assumption?.. If is correct, what does the another lines with the 0x216 and 0x416? Lenght of region and used?..  this is also quite not clear to me when seeing the script.

    Regards,

    Ady

  • Hello Ady,

    The answers are in the video and TRM points I already sent.  The LB per file show what each line does clearly:

    follow each line and you see what attribute it adds.  You can use the PER file to explore all the options.  Alternately you can look each one up in the TRM.  The PER file imports much of the TRM so that is the quicker but not as complete.

    RBARx is the base address
    RSERx  has the size and enable
    RACRx has attributes like permission and cacheable type
    Regards,
    Richard W.


  • Hello Richard,

    Once more thanks for your replys.

    One question, this "base address" have some relation with the map file of the demo and from where starts the different regions? For example in my project, Should I look to take these to my configuration for example or doesn't save any relation at all this value with the information inside of the map files?

  • Hello Ady,

    Yes there will be a correspondence with your map file and what is in the MPU regions.  How that is setup is software dependent.  Some software I've seen has it as static 1-1, in others overlay and change mechanism exist where it would change at run time.   The Lauterbach sieve-demo will be static where some advance RTOS implementations will be dynamic.  If you have questions on specific software you should open up separate questions. 

    Regards,
    Richard W.
  • Hello Richard,

    Thanks for your replys. As suggested I'll open a new question in forums related to this topic. TDA4VM: MPU configuration on Luaterbach for TDA4 using MCU!! - Processors forum - Processors - TI E2E support forums

    Regards,

    Ady

  • If you have 'mask interrupts' enabled while stepping you might only see your code caught in such a loop.

    Hello Richard,

    One additional question, this "Mask Interrupts" is internally into the Trace32 or you referring to a SFR inside of the TDA4?

    Regards,

    Ady

  • There two common options for CPU cores "system.Option.IMASKASM" and "system.Option.IMASKHLL".  This will mask the local CPUs ISR for the Cortex-R5 that means you get the behavior of "CPSR.I and CPSR.F" being set.  The ASM does this for assembly views, the HLL does this for C/C++ level stepping.   Without these set, you code can do a lot of work in the back ground based on async operations (like interrupts) before returning to the next assembly or C instruction.