This thread has been locked.

If you have a related question, please click the "Ask a related question" button in the top right corner. The newly created question will be automatically linked to this question.

TDA4VM: On the question of Openvx node image delay

Part Number: TDA4VM

Hi Ti's Experts,

            We made the software of surroud view on Tda4, Using the Hardware GPU、 CAMERA、 VPAC(VISS, AEWB,MSC)、DSS.   
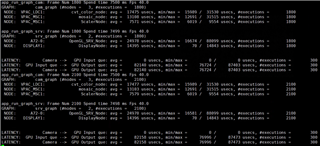
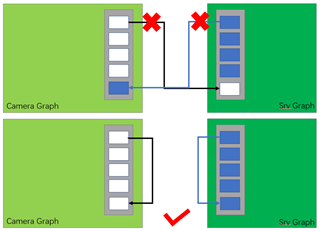
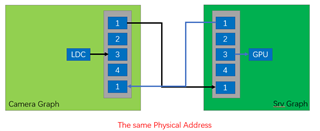
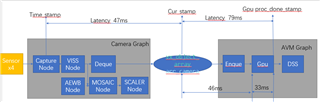
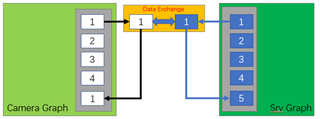
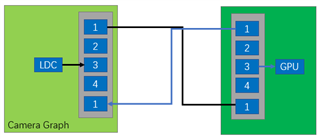
           

                                 GRAPH 1                                                                         GRAPH2

            Buffer_size:4   pipeline depth:8                                                            Buffer_size:3  pipeline Depth:3

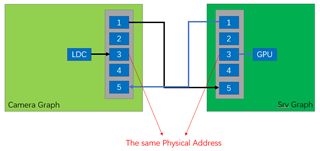
            CAMERA(4 Pcs) ---> WISS ---> AEWB---> MSC                                      GPU--->DSS

            FPS:30                                                                                                  FPS:30

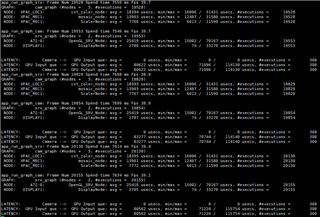
            DELAY:47.2ms                                                                                   DELAY:76.9ms

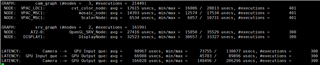
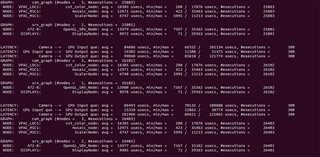
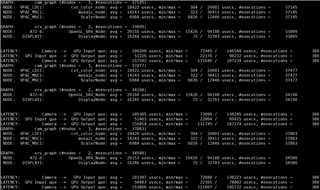
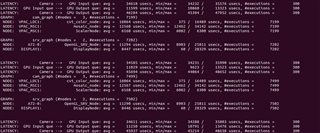
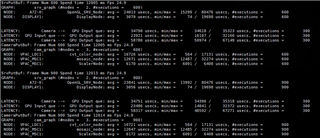
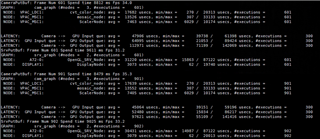
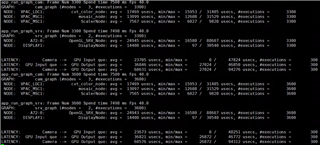
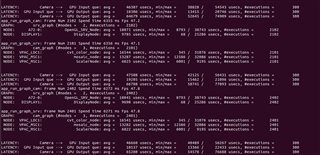
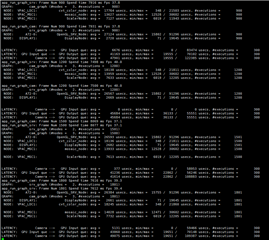
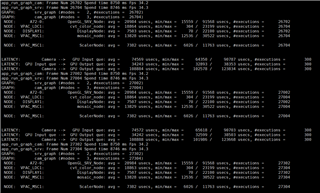
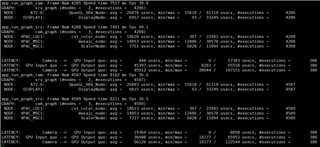
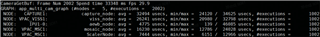
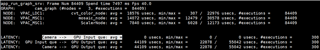
            The time consumption of each node is as follows:


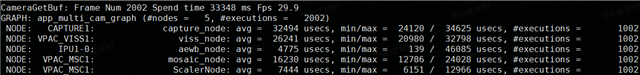
            We want to reduce the delay while maintaining the frame rate .So, Shall your share some suggestions for us?

            We also tried some methods:

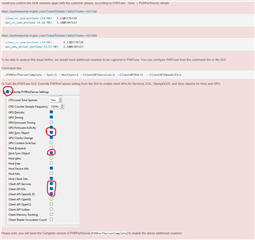
            1. Set SRV(GRAPH2) Buffer_size to 2,  pipeline Depth to 2: the DELAY can reduce about 40ms, but FPS also reduced to 15FPS

            2. Set CAMERA (GRAPH1) Buffer_size to 3, the FPS CAMERA reduced to 25Fps.

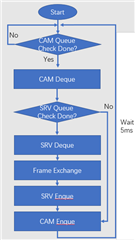
            3. Change SRV or CAMERA  pipeline depth, it seem no impact.

            So We have some questions, please help to answer:

            1.  What is the effect of changing The pipeline depth, and how will it be improved by increasing or decreasing The pipeline depth?

            2.  The actual processing time of GPU is 33ms . Why is there more than 70ms delays on SRV graph. 

            3.  Is there a good way to keep the frame rate and reduce the delay?


            Thanks a lot, Look for your reply!     


  • Hi,

    Could you please elaborate on what do you mean by delay here? is it the delay on A72 application?

    How is this being measured?

    From the screenshots provided, it seems that the frame is being processed by the graph around 33ms. (around 30FPS)

    Regards,
    Nikhil

  • Hi, Nikhil

    Take GRAPH1 as an example,we got the GTC timestamp added to the captured frame,and got the GTC timestamp of WISS, delay is the time difference between the two.

    For the GRAPH2, we got the GTC timestamp of WISS from GRAPH1 and passed it to the Gpu (

    img_input_desc[0]->base.timestamp), then  got the GTC timestamp When run the Process Funtion of Gpu Node. finally,
    Calculated the time difference between the two.
    The screenshot information indicates the time consumption of each node, but in fact, the delay of  image is greater than the time consumption

  • Hi,

    Take GRAPH1 as an example,we got the GTC timestamp added to the captured frame,and got the GTC timestamp of WISS, delay is the time difference between the two

    Is this taking 50ms? Could you brief where the timestamps are being taken?

    Usually, the object descripter timestamp obtained would have the timestamp of the source node only (in this case, the capture node).

    Could you please confirm if the time difference between the capture timestamp and a local timestamp taken in VISS process function and check the latency for each frame first?

    Meanwhile let me confirm if we are transferring the timestamp from one graph to another in the current framework.

    Regarding your graph, could you let me know which is graph parameter being used? Is SRV node taking input from VISS node or MSC node?

    Also it would be great if you could share the implementation of calculation of delay for a quick review.

    Regards,
    Nikhil

  • Hi, Nikhil

    1. Could you please confirm if the time difference between the capture timestamp and a local timestamp taken in VISS process function and check the latency for each frame first?

    The timestamp of the source node (in this case, the capture node)  Got by this Function,

    vxQueryReference((vx_reference)arr_camera, TIVX_REFERENCE_TIMESTAMP, &time_stamp, sizeof(time_stamp));
     
    a local timestamp taken in VISS process function Got by this Function,
    #define GET_GTC_VALUE64 (*(volatile uint64_t*)(GTC_BASE_ADDR + 8))
    uint64_t appLogGetGlobalTimeInUsec()
    {
        uint64_t cur_ts = 0; /* Returning ts in usecs */

        if ((NULL != GTC_BASE_ADDR) &&
            (0 != mhzFreq) )
        {
            cur_ts = GET_GTC_VALUE64 / mhzFreq;
        }

        return cur_ts;
    }
    So  Are these two methods of obtaining time stamps a clock source?If it is not a source, does the SDK internally have a function corresponding to TIVX_REFERENCE_TIMESTAMP to obtain a local timestamp?
    2.Meanwhile let me confirm if we are transferring the timestamp from one graph to another in the current framework
    Please help check our code (from one graph to another)
    vxQueryReference((vx_reference)arr_camera, TIVX_REFERENCE_TIMESTAMP, &time_stamp, sizeof(time_stamp));
    vx_image tmp_img = (vx_image)vxGetObjectArrayItem(srv_cam_arr, 0);
    tivxSetReferenceAttribute((vx_reference)tmp_img,  TIVX_REFERENCE_TIMESTAMP, &time_stamp, sizeof(time_stamp));
    xReleaseImage(&tmp_img);
    cur_stamp = appLogGetGlobalTimeInUsec();
    tmp_img = (vx_image)vxGetObjectArrayItem(srv_cam_arr, 1);
    tivxSetReferenceAttribute((vx_reference)tmp_img,  TIVX_REFERENCE_TIMESTAMP, &cur_stamp, sizeof(time_stamp));
    vxReleaseImage(&tmp_img);
    GPU Process() {
                    avm_end_time = appGetLocalTimeInUsec();
                    cam_dly_tmp = (img_input_desc[1]->base.timestamp - img_input_desc[0]->base.timestamp);
                    if(cam_dly_tmp < cam_dly_min)
                    {
                        cam_dly_min = cam_dly_tmp;
                    }
                    if(cam_dly_tmp > cam_dly_max)
                    {
                        cam_dly_max = cam_dly_tmp;
                    }
                    cam_dly_avg = (cam_dly_avg * executions + cam_dly_tmp) / (executions + 1);

                    avm_dly_tmp = (avm_end_time - img_input_desc[1]->base.timestamp);
                    if(avm_dly_tmp < avm_dly_min)
                    {
                        avm_dly_min = avm_dly_tmp;
                    }
                    if(avm_dly_tmp > avm_dly_max)
                    {
                        avm_dly_max = avm_dly_tmp;
                    }
                    avm_dly_avg = (avm_dly_avg * executions + avm_dly_tmp) / (executions + 1);
                    printf(" DELAY:%16s --> %16s: avg = %6" PRIu64 " usecs, min/max = %6" PRIu64 " / %6" PRIu64 " usecs, #executions = %10" PRIu64 "\n"
                            , "Camera"
                            , "Avm Input que"
                            , cam_dly_avg
                            , cam_dly_min, cam_dly_max
                            , frame_idx);
                     printf(" DELAY:%16s --> %16s: avg = %6" PRIu64 " usecs, min/max = %6" PRIu64 " / %6" PRIu64 " usecs, #executions = %10" PRIu64 "\n"
                            , "Avm Input que"
                            , "Avm Output que"
                            , avm_dly_avg
                            , avm_dly_min, avm_dly_max
                            , frame_idx);
    }
    3.Regarding your graph, could you let me know which is graph parameter being used? Is SRV node taking input from VISS node or MSC node
    Viss Node.
    Best wishes

  • Hi,

    As discussed in the call, could you please provide a brief about your usecase?

    It would also be great if you could provide a diagram ( or something similar ) showing the points where you are trying to profile in your graph.

    Regards,
    Nikhil

  • Hi,

    Thank you for explaining the issue in brief.

    As discussed, I shall check this issue internally regarding the issue and get back by Friday.

    I would be of great help to debug the issue if you could provide me the below:

    1. The block diagram presentation that was shown during the debug call

    2. The complete application source code (especially which consists of run_graph, create graph, place where you are doing enqueue and dequeue for both graphs etc..), along with the GPU target implementation code (i.e. the GPU process function). It would be great id you could share the full source code so that it would be faster to identify the issue.

    3. Are you using two separate tasks for enqueue and dequeue for 2 Graphs?

    Please provide this information as soon as possible so that we could resolve this issue soon.

    Regards,
    Nikhil

  • Hi, Nikhil

    1. Please find attchment of e2e.pptE2E.pptx

    2. I'm sorry that our source code cannot be open source.  but I will provide you with a reproducible DEMO for testing. It is currently under development and will be uploaded later.

    3. The two Graphs are in VX_GRAPH_SCHEDULE_MODE_QUEUE_AUTO mode and only scheduled within the main process for enqueue and dequeue.

    Best wishes!

  • Hi, Nikhil

    Peleas find attchment of code.tar.gz

    It is the demo for Recurrence latency problem.

    Please Place file vx_gl_srv_target.c to the Path: ./vision_apps/kernels/srv/gpu/vx_gl_srv_target.c

    Folder cc_avm is the source code, you could place it to ./vision_apps/apps/basic_demos/ for compiling.

    Folder  execuable contains  the Files deployed to TDA4, 

    the Folder psdkra should  Place it to cc_avm.out in the same level directory.

    ./cc_avm.out, then you can see it below,

    Best wishes

  • Hi,

    Thank you for providing the code.

    I ran the code on my end in SDK 7.3 on TDA4VM EVM.

    Please find my timings below.

    As seen above, I could see

    84686 usecs for Cam to GPU Input (Should be because on mem_cpy -> i shall profile the mem_cpy to get the exact time it takes here)

    14302 usecs for GPU input to GPU output (is aligned with 13980 usec taken by the srv node. I don't see any extra delay here)

    whereas it is around 66988 usecs from your logs below.

    1. Is this for the same source code that you shared?

    2. I see that the number of executions for cam_graph (21499) and srv_graph (16199) is not matching at your end whereas it is very nearby at my end. Could you please explain why this is there at your end?

    Regards,
    Nikhil

  • Hi, Nikhil

    Please also help confirm the status,

    1. 84686 usecs for Cam to GPU Input (Should be because on mem_cpy )

    I tried I added timestamp printing before and after memcpy ( in function vx_reference_memcpy_arr ) and memset ( in function CameraDataSet), The actual time consumption is as follows,

    The accumulation of these two consuming times will not exceed 20000 usecs , so 84686 usecs should not be entirely caused by memcpy  and  memset.

    Please help confirm further. please find the modify code(added timestamp) 3644.code.tar.gz

    2. 14302 usecs for GPU input to GPU output (is aligned with 13980 usec taken by the srv node. I don't see any extra delay here)

    This looks very strange. It seems that the consuming times of  OpenGL_SRV_Node and  DisplayNode from EVM Board are less than our Board.  I'll run this DEMO on the EVM board later

    Next, I would respond to your question:

    1. Is this for the same source code that you shared?

    Yes, it the same source code. But it seem run in the different hardware. I'll run this DEMO on the EVM board later.

    2.  I see that the number of executions for cam_graph (21499) and srv_graph (16199) is not matching at your end whereas it is very nearby at my end. Could you please explain why this is there at your end?

    It seems the consuming time of srv_graph from EVM Board(13980 usecs) are less than our Board(32523 usecs),  Therefore, different frame rates of graphs lead to different executions. I'll run this DEMO on the EVM board later

    Please also note that the above,thanks.

    Best Wishes

  • Hi, Nikhil

    I have tested the demo on the EVM Board, the Latency result is as follow,

    And the actual time consumption of  memcpy ( in function vx_reference_memcpy_arr ) and memset ( in function CameraDataSet) are as follows,

     1. The executions for cam_graph (37145) and srv_graph (33899) is also not matching on the EVM Board of ours

     2. It seems that the consuming times of  OpenGL_SRV_Node from EVM Board of us  are similar to Our Board

      your EVM  BOARD    --->   13980 usec

      our   EVM  BOARD    --->   29160 usec

      our  layeout BOARD  --->   27416 usec

     I see that GPUs have shorter time  consumption and higher performance in your EVM board. whether the TDA4 Chip in the EVM Board you are using has higher performance than ours?

      Device Name for tda4 in Our board                :  XJ721EGBALF (TDA4VM88)

      Device Name for tda4 in EVM Board of ours  :  XJ721EGALF

     3.  The time consumption of DisplayNode are Completely different(Take the maximum value),

      your EVM  BOARD    --->   9985   usec

      our   EVM  BOARD    --->  16246  usec

      our  layeout BOARD  --->  32523  usec

      In summary, we found that your board testing performance and latency is better than ours.

      Could you tell me if you have any optimizations? 

      Or if you need more information to confirm, please let me know. Thanks.

      Best Wishes

  • Hi,

    1. Regarding the first issue, where you see around 85-90 msec from Enqueue of LDC input to Enqueue of SRV input:

    The time difference is observed here as the timestamp in src_frame in SrvPutBuf() would be of the first buffer enqueued (i.e., during app_run_graph in camera_init), whereas the cur_stamp in SrvPutBuf() would be after 3 (initial buffers) + 1 (enqueue buffer in CameraGetBuf).

    Hence this initial delay of 4 frames is always propogated through out the run showing 85-90 msec.

    I have modified the code a bit in fw_camera.c and fw_srv.c as attached below.

    /cfs-file/__key/communityserver-discussions-components-files/791/cc_5F00_avm.zip

    With the above, I'm able to get around 34msec as shown below

    I think this way of implementation, or something similar on your application code should resolve the first part of the issue

    2. Regarding the time difference from SRV enqueue to end of gpu process node

     Could you tell me if you have any optimizations? 

    I'm using Linux as HLOS on A72 and SDK 7.3 (No changes done on the released SDK apart from the code you had provided)

    Could you please confirm if you are using Linux or QNX on A72? (i.e., Are you using GPU driver on Linux or QNX?)

    I'm getting the below as output video. Could you please confirm you are seeing the same too?

    /cfs-file/__key/communityserver-discussions-components-files/791/Video_5F00_Latency.mp4

    Note : I had to make the below changes in your code to make it build without compilation error. I don't think this should be an issue. Just kept it here for your information.

    /cfs-file/__key/communityserver-discussions-components-files/791/Additional_5F00_change.patch

    Regards,
    Nikhil

  • Hi, Nikhil

    thank for your reply, but there are still problems please to confirm

    1. Regarding the first issue, where you see around 85-90 msec from Enqueue of LDC input to Enqueue of SRV input

    There are some strange points about the modified the code , please help to Further analysis,


    if (first == 0)
        {
            CameraDataSet(obj->ldc_in_arr[0]);
            vxGraphParameterEnqueueReadyRef(
                    obj->graph,
                    obj->graph_avm_parameter_index[0],
                    (vx_reference*)&obj->ldc_in_arr[0],
                    1);
            first = 1;
        }
        else
        {
            status = vxGraphParameterDequeueDoneRef(
                    obj->graph,
                    obj->graph_avm_parameter_index[0],
                    (vx_reference*)&tmp_frames,
                    1,
                    &num_refs);
            if ((status == VX_SUCCESS))
            {  
                CameraDataSet(tmp_frames);
                vxGraphParameterEnqueueReadyRef(
                        obj->graph,
                        obj->graph_avm_parameter_index[0],
                        (vx_reference*)&tmp_frames,
                        1);
            }
        }
    
        status = vxGraphParameterDequeueDoneRef(
                obj->graph,
                obj->graph_avm_parameter_index[1],
                (vx_reference*)_frames,
                1,
                &num_refs);
            return 1;

      a)Funtion vxGraphParameterCheckDoneRef() has been removed in fw_camera.c and fw_srv.c, it means that the queue will enter a blocked state without data. In our project, the source node of Graph is the capture Node. If one of cameras is disconnected at this time, the call to vxGraphParameterDequeueDoneRef will be continuously blocked, causing the program to fail to exit normally. 

      b)   In fact, our program does not only have two graphs (at least three or more), and the run cycles of graphs are also different. Therefore,  removing vxGraphParameterCheckDoneRef(), it may cause mutual influence between Graph and Graph. I will further verify this by adding a few Graphs in my future attempts.

      c)   The code of /cfs-file/__key/communityserver-discussions-components-files/791/cc_5F00_avm.zip I have tried, it really worked  and actually been able to get around 34msec, As an analog camera input, it really should only be queued once. However, after the change, it seems that the output frame rate has decreased. Later, I will increase the frame rate and print for verification

    2. Regarding the time difference from SRV enqueue to end of gpu process node

      We runned the App using QNX on A72,  Could you please test by using SDK 7.3 on the QNX? And could you further help confirm whether the GPU time consumption and latency under the QNX system are consistent with ours? GPU driver was on QNX, This is included in the SDK system and has not been changed.

    /cfs-file/__key/communityserver-discussions-components-files/791/Video_5F00_Latency.mp4 This is consistent with the phenomenon of our program running, but the frame rate is currently not confirmed and I need to further increase debugging code confirmation.

    /cfs-file/__key/communityserver-discussions-components-files/791/Additional_5F00_change.patch I will place this patch into the code later. I`m Sorry that we ignored the warning code

    Thanks a lot.

  • Hi, Nikhil

    Please Find attachments about these patch files.3757.patch.zip

    After our testing, it is found that if the function A is removed, the delay will decrease, but it also affects the actual output frame rate

     /cfs-file/__key/communityserver-discussions-components-files/791/cc_5F00_avm.zip  

    The result of printing at the increased frame rate (Show_Fps.patch) is as follows,

     that frame rates of cam_graph (24.9) and srv_graph (24.9) are similar, the latency from Enqueue of LDC input to Enqueue of SRV input is 34790 usec, and from from SRV enqueue to end of gpu process node is 23921 usec

    The result of printing at the increased frame rate and using of recovery function vxGraphParameterCheckDoneRef()  (Show_Fps_and_Add_checkoutDoneFunction.patch) is as follows,

     that frame rates of cam_graph (34.0) and srv_graph (31.2) are similar, the latency from Enqueue of LDC input to Enqueue of SRV input is 47906 usec, and from from SRV enqueue to end of gpu process node is 64995 usec

    In summary, if the function vxGraphParameterCheckDoneRef()  is removed, the latency would indeed decrease, but the frame rate will also decrease. If the number of GRAPHs is increased, the frame rate may be further affected.

    Shall you already know the reason for the latency of our demo or Apps?  

    Is there a good way to keep the frame rate and reduce the latency?

    In addition, we also had a message that needs to be synchronized, and have tried to adjust the output CSI frame rate of the camera from 30 Fps to 25 Fps in our apps, and the latency further decreased. should you please  help analyzing the reason?

    Best wishes

  • Hi,

    Shall you already know the reason for the latency of our demo or Apps?  

    Is there a good way to keep the frame rate and reduce the latency?

    The root cause for the first part of latency as based on the app you had provided, is because

    1. You are doing a 3 buffer pipe-up initially for the cam graph.

    2. The 4 buffer gets enqueued first with filled values, and then you are dequeueing the cam graph ldc output.

    3. This ldc output would consists of the timestamp (if provided) during the pipeup. Else the timestamp value is zero.

    4. Once this buffer is dequeued (already with a 3 buffer latency with the current timestamp because it is a pipeup buffer), you would be checking to dequeue the srv graph input buffer. (This would be available at first but if not available at that moment, you are skipping it by vxGraphParameterCheckDoneRef() leading to additional 1 frame latency)

    5. Now, this 4 frames latency would be propagated all alone the runs because you are doing both graphs enqueue and dequeue in a single task.

    Hence, you are seeing this latency for the first part of the graph.

    Now, regarding the second part, I have checked internally with GPU expert regarding the performance of GPU (QNX vs Linux).

    We are checking internally if there is a difference in the performance. But here we could only confirm the same. The improvement in the performance should come from QNX as the driver implementation is from QNX.

    Is there a good way to keep the frame rate and reduce the latency?


    The only way currently I see is to keep the srv graph (enq and deq) and cam graph (enq and deq) in separate tasks, and point the output buffer of ldc as input of srv in graph parameter.

    The above method would not only avoid the latency (by unblocking deq of srv graph whenever it is ready), but also avoids memcpy as the same buffer is being pointed to both graphs (ldc o/p and srv i/p)

    Please refer this implementation below

    /cfs-file/__key/communityserver-discussions-components-files/791/cc_5F00_avm_5F00_dual_5F00_task.zip

    Please check the changes made in main.c and SrvInit()

    Note: The timing calculation would be a bit off as the same buffer is being used here currently. Could you please update this implementation and let me know if there is improvement in latency and fps?

    Regards,
    Nikhil

  • Hi, Nikhil

    Please check the modified improvement in latency and fps(Test results of the same test procedure twice)

    The FPS has indeed increased significantly, and the latency has also decreased. This is really a good way to effectively remove Cp, but it seems that the latency from SRV enqueue to end of gpu process node is not a stable value,sometimes 80ms ,sometimes 60ms, and  the latency from Enqueue of LDC input to Enqueue of SRV input, sometimes 0ms ,sometimes 20ms,

    Therefore, I still have some confusion, please help me reply, thanks,

    1. using the same buffer pointed to both graphs (ldc o/p and srv i/p).

    a)Is this allowed by the OPENVX architecture? 

    b)  SRV Graph Input  will CAM Graph Output tmp_frames[0], which has not been completely written. This kind of scene is likely to lead to screen tearing, I will test this scenario later.

    c)  If the actual scheduling cycles of two GRAPHs are different, i s there a phenomenon of video frame disorder?

    2. We have tried to adjust the output CSI frame rate of the camera from 30 Fps to 25 Fps in our apps, and the latency further decreased. should you please  help analyzing the reason?

    3. How should the actual latency of GRAPH be calculated? Is it an accumulation of time spent by all nodes?

    Please find the attachment for adding Fps and timestamps .4456.diff.zip

    Best wishes

  • Hi, Nikhil

    b) SRV Graph Input  will CAM Graph Output tmp_frames[0], which has not been completely written. This kind of scene is likely to lead to screen tearing, I will test this scenario later.

    I tried this scene, and there was indeed a discontinuity in the frame, Sometimes good and sometimes bad.

    Please find the attachment for the video VID_20230328_102500.zip

    Please find the attachment for source code and uyvy image file 8540.diff.zip

    file.yuv could be placed in the same level directory of execuable file.

    Shall you please help me check this issue and reply to the question below ? Thanks.

    1. using the same buffer pointed to both graphs (ldc o/p and srv i/p).

    a)Is this allowed by the OPENVX architecture? 

    b)  SRV Graph Input  will CAM Graph Output tmp_frames[0], which has not been completely written. This kind of scene is likely to lead to screen tearing.

    c)  If the actual scheduling cycles of two GRAPHs are different, i s there a phenomenon of video frame disorder?

    There is indeed a phenomenon of image tearing and discontinuous video frames.

    2. We have tried to adjust the output CSI frame rate of the camera from 30 Fps to 25 Fps in our apps, and the latency further decreased. should you please  help analyzing the reason?

    3. How should the actual latency of GRAPH be calculated? Is it an accumulation of time spent by all nodes?


    looking for your reply.

    Best wishes

  • Hi,

    b) SRV Graph Input  will CAM Graph Output tmp_frames[0], which has not been completely written. This kind of scene is likely to lead to screen tearing

    Sorry. In the implementation, it is currently,

    TASK 1: DQ LDC o/p -> EnQ LDC o/p

    TASK 2: DQ SRC i/p -> EnQ SRV i/p

    In the above case, you are correct, there are chances that LDC is writing the o/p and SRV reading it would happen same time and half written image.
    Could you make a small correction as shown below 

    TASK 1: DQ LDC o/p -> EnQ SRV i/p

    TASK 2: DQ SRC i/p -> EnQ LDC o/p

    In this case, there shouldn't be simultaneous access to buffer as the Dq function is a blocker function that would provide the buffer only when the buffer is filled.

    Could you please try this change at your end? This should give better FPS and less latency.

    Is this allowed by the OPENVX architecture? 

    Yes, this is allowed. I do not an issue with this approach from the architecture point of view.

    SRV Graph Input  will CAM Graph Output tmp_frames[0], which has not been completely written. This kind of scene is likely to lead to screen tearing

    I agree, this should be solved by the method suggested above.

    If the actual scheduling cycles of two GRAPHs are different, i s there a phenomenon of video frame disorder?

    The frames should be in order with the method suggested above.

    We have tried to adjust the output CSI frame rate of the camera from 30 Fps to 25 Fps in our apps, and the latency further decreased. should you please  help analyzing the reason?

    If this is the observation from your original application with camera? I think this happens because, as shared initially, I see GPU perf exceeds 33msec (as shown below) because of which the latency was because of pile-up of frames from the first graph.
    This should be avoided by running them in different tasks as suggested.


    To explain in more detail, I would have to look into your original application. Right now, I could only comment assuming your application is similar to the sample application you have sent me.

    How should the actual latency of GRAPH be calculated? Is it an accumulation of time spent by all nodes?

    The Latency is usually the time spent by nodes + graph latency (i.e., ipc latency, buffer transfer etc.). But usually, the graph latency is very less compared to the node performance time.

    Usually, we calculate the latency by using the timestamp provided in the capture node and read this back in the display node (process function) and get the timestamp locally at that moment in the display node. The difference should give you the latency for the flow.

    Regards,
    Nikhil

  • Hi,

    We are verifying at our end if we are seeing an issue with the GPU on QNX. You should have the results by tomorrow. 

    Meanwhile, could you please check with QNX on why there is performance issue and if it could be optimized further to bring to atleast 30msec for your original application?

    Regards,

    Nikhil

  • Hi, Nikhil

    Thanks for your reply.

    I modified the code by referring to the small correction as shown below

    TASK 1: DQ LDC o/p -> EnQ SRV i/p

    TASK 2: DQ SRC i/p -> EnQ LDC o/p

    the program doesn't seem to work properly 

    but it worked on 

    TASK 1: DQ LDC o/p -> EnQ LDC o/p

    TASK 2: DQ SRC i/p -> EnQ SRV i/p

    So shall you please Help fix this problem?Please find the source code cc_ti_avm.tar.gz

    file,yuv please find the attachment in 8540.diff.zip

    In addition, I have a question. If the the time spent by nodes is close to the cycle time of the GRAPH, is it possible to cause additional latency?

    Thanks a lot!

  • We will make a  performance issueto to QNX Later

  • Hi, Nikhil

    Could you please tell me some informations about GPU drivers for linux and QNX in SDK v7.03  e.g. The driver versions

    Thank you 

  • Hi

    Could you please tell me some informations about GPU drivers for linux and QNX in SDK v7.03  e.g. The driver versions

    Linux GPU DDK versions are shipped with the SDK, you can find it in the Linux SDK:
    ti-processor-sdk-linux-j7-evm-07_03_00_05/board-support/extra-drivers/ti-img-rogue-driver-1.13.5776728

    You would have to check with QNX regarding the QNX driver information based on the QNX version you are using.

    For SDK 7.3 you can refer the below document for more info

    https://software-dl.ti.com/jacinto7/esd/processor-sdk-qnx-jacinto7/07_03_00_02/exports/docs/release_notes_07_03_00_j721e.html#qnx-sdp-7-1

    So shall you please Help fix this problem

    It seems that the SRV_Init() changes are not taken in. Could you please take those changes too from the below file.

    Regards,

    Nikhil

  • Hi, Nikhil

    Please find the diff.patch 3480.diff.zip ,

    I did make changes based on this version /cfs-file/__key/communityserver-discussions-components-files/791/cc_5F00_avm_5F00_dual_5F00_task.zip

    TASK 1: DQ LDC o/p -> EnQ SRV i/p

    TASK 2: DQ SRC i/p -> EnQ LDC o/p

    Logically,  srv_graph and cam_graph maintains two queues, deque the vx_object_array from cam_graph then enque it to the srv_graph, and  deque the vx_object_array from srv_graph then enque it to the cam_graph.

    the following error occurred during enque, causing both Graphs to fail to queue successfully, resulting in both queues being empty

    Shall you Please also help me to check it, thanks


  • Nikhil, Zheng,

    Please find the logs below of my test to replicate the scenario on my side.

    LINUX.log
    GRAPH:        cam_graph (#nodes =   3, #executions =    303)
     NODE:  VPAC_LDC1:           cvt_color_node: avg =  16888 usecs, min/max =    293 /  20705 usecs, #executions =        303
     NODE:  VPAC_MSC1:              mosaic_node: avg =  13934 usecs, min/max =    424 /  30645 usecs, #executions =        303
     NODE:  VPAC_MSC1:               ScalerNode: avg =   6443 usecs, min/max =   6005 /   9478 usecs, #executions =        303
    
    GRAPH:        srv_graph (#nodes =   2, #executions =    302)
     NODE:      A72-0:          OpenGL_SRV_Node: avg =  11596 usecs, min/max =   7450 /  29451 usecs, #executions =        302
     NODE:   DISPLAY1:              DisplayNode: avg =  10684 usecs, min/max =     76 /  25246 usecs, #executions =        302
    
    
    LATENCY:         Camera -->   GPU Input que: avg =     90170 usecs, min/max =     73683 /    105662 usecs, #executions =        300
    LATENCY:  GPU Input que -->  GPU Output que: avg =     12817 usecs, min/max =      9392 /     19811 usecs, #executions =        300
    LATENCY:         Camera -->  GPU Output que: avg =    103061 usecs, min/max =     86291 /    122987 usecs, #executions =        300
    GRAPH:        cam_graph (#nodes =   3, #executions =    602)
     NODE:  VPAC_LDC1:           cvt_color_node: avg =  16990 usecs, min/max =    293 /  20705 usecs, #executions =        602
     NODE:  VPAC_MSC1:              mosaic_node: avg =  13949 usecs, min/max =    424 /  30645 usecs, #executions =        602
     NODE:  VPAC_MSC1:               ScalerNode: avg =   6442 usecs, min/max =   6005 /   9478 usecs, #executions =        602
    
    GRAPH:        srv_graph (#nodes =   2, #executions =    601)
     NODE:      A72-0:          OpenGL_SRV_Node: avg =  11664 usecs, min/max =   7450 /  29451 usecs, #executions =        601
     NODE:   DISPLAY1:              DisplayNode: avg =  10946 usecs, min/max =     76 /  25246 usecs, #executions =        601
    

    QNX.log
    GRAPH:        cam_graph (#nodes =   3, #executions =    304)                                                              
     NODE:  VPAC_LDC1:           cvt_color_node: avg =  16976 usecs, min/max =    298 /  18854 usecs, #executions =        304
     NODE:  VPAC_MSC1:              mosaic_node: avg =  13407 usecs, min/max =    302 /  30488 usecs, #executions =        304
     NODE:  VPAC_MSC1:               ScalerNode: avg =   6900 usecs, min/max =   6013 /   8544 usecs, #executions =        304
                                                                                                                                 
    GRAPH:        srv_graph (#nodes =   2, #executions =    298)                                                     
     NODE:      A72-0:          OpenGL_SRV_Node: avg =  25029 usecs, min/max =  15623 /  91461 usecs, #executions =        298
     NODE:   DISPLAY1:              DisplayNode: avg =  13510 usecs, min/max =     67 /  13986 usecs, #executions =        298
                                                                                                                                
                                                                                                           
    LATENCY:         Camera -->   GPU Input que: avg =     93469 usecs, min/max =         0 /    135854 usecs, #executions =        300
    LATENCY:  GPU Input que -->  GPU Output que: avg =    709860 usecs, min/max =     25030 /  65408438 usecs, #executions =        300
    LATENCY:         Camera -->  GPU Output que: avg =    803400 usecs, min/max =    103174 /  65408438 usecs, #executions =        300
    GRAPH:        cam_graph (#nodes =   3, #executions =    604)              
     NODE:  VPAC_LDC1:           cvt_color_node: avg =  17103 usecs, min/max =    298 /  18854 usecs, #executions =        604
     NODE:  VPAC_MSC1:              mosaic_node: avg =  13477 usecs, min/max =    302 /  30488 usecs, #executions =        604
     NODE:  VPAC_MSC1:               ScalerNode: avg =   6870 usecs, min/max =   6013 /   8544 usecs, #executions =        604
                                                                                                                              
    GRAPH:        srv_graph (#nodes =   2, #executions =    598)                                                              
     NODE:      A72-0:          OpenGL_SRV_Node: avg =  24928 usecs, min/max =  15623 /  91461 usecs, #executions =        598
     NODE:   DISPLAY1:              DisplayNode: avg =  13545 usecs, min/max =     67 /  13986 usecs, #executions =        598 
                                                                                                                              
                                                                                                                              
    LATENCY:         Camera -->   GPU Input que: avg =     97419 usecs, min/max =     83969 /    109290 usecs, #executions =        300
    LATENCY:  GPU Input que -->  GPU Output que: avg =     56496 usecs, min/max =     47738 /     64716 usecs, #executions =        300
    LATENCY:         Camera -->  GPU Output que: avg =    153979 usecs, min/max =    132696 /    159476 usecs, #executions =        300
    GRAPH:        cam_graph (#nodes =   3, #executions =    904)                                                                                                                                               
     NODE:  VPAC_LDC1:           cvt_color_node: avg =  17206 usecs, min/max =    298 /  18854 usecs, #executions =        904
     NODE:  VPAC_MSC1:              mosaic_node: avg =  13464 usecs, min/max =    302 /  30488 usecs, #executions =        904
     NODE:  VPAC_MSC1:               ScalerNode: avg =   6894 usecs, min/max =   6013 /   8544 usecs, #executions =        904
    
    GRAPH:        srv_graph (#nodes =   2, #executions =    898)
     NODE:      A72-0:          OpenGL_SRV_Node: avg =  24926 usecs, min/max =  15623 /  91461 usecs, #executions =        898
     NODE:   DISPLAY1:              DisplayNode: avg =  13544 usecs, min/max =     67 /  13986 usecs, #executions =        898
    
    
    LATENCY:         Camera -->   GPU Input que: avg =     92420 usecs, min/max =     82494 /    109145 usecs, #executions =        300
    LATENCY:  GPU Input que -->  GPU Output que: avg =     57676 usecs, min/max =     47769 /     65614 usecs, #executions =        300
    LATENCY:         Camera -->  GPU Output que: avg =    150172 usecs, min/max =    131786 /    159456 usecs, #executions =        300
    GRAPH:        cam_graph (#nodes =   3, #executions =   1204)
     NODE:  VPAC_LDC1:           cvt_color_node: avg =  17226 usecs, min/max =    298 /  18854 usecs, #executions =       1204
     NODE:  VPAC_MSC1:              mosaic_node: avg =  13480 usecs, min/max =    302 /  30488 usecs, #executions =       1204
     NODE:  VPAC_MSC1:               ScalerNode: avg =   6894 usecs, min/max =   6013 /   8576 usecs, #executions =       1204
    
    GRAPH:        srv_graph (#nodes =   2, #executions =   1198)
     NODE:      A72-0:          OpenGL_SRV_Node: avg =  24914 usecs, min/max =  15623 /  91461 usecs, #executions =       1198
     NODE:   DISPLAY1:              DisplayNode: avg =  13548 usecs, min/max =     67 /  13986 usecs, #executions =       1198


    You can find the collected GPU traces here:

    Linux_cc_avm.pvrtune

    qnx_cc_avm.pvrtune

    They can be viewed with PVRTuneDeveloper from Imagination Technologies: https://developer.imaginationtech.com/downloads/

    Regards,

    Erick

  • Hi, Nikhil

    I seem to have found the reason for this issue.

    The essence of this problem seems to be that OPENVX does not support exchanging the buffer

    Please pay attention to the following functions,

    This function is called by tivxGraphParameterEnqueueReadyRef(),it seems to be checking whether the incoming buffer is in the refs_list, if not, an error will be reported "Unable to queue ref due to invalid ref"

    The initialization of this refs_list is completed in functionvxSetGraphScheduleConfig()

    in summary, Openvx actually allows the following enque or deque

    The following mechanism is intended to avoid a tearing image or video frame disorder, the cam_graph output buffer and srv_graph input buffer should not be used in the same buffers.

    TASK 1: DQ LDC o/p -> EnQ SRV i/p

    TASK 2: DQ SRC i/p -> EnQ LDC o/p

    The architecture of OPENVX seems to conflict with the above methods, so could you please help solve this problem? thanks!

    Source code 3480.diff.zip  file,yuv please find the attachment in 8540.diff.zip

    In addition, thank you for the performance comparison tests provided for QNX and LINUX. I will feedback to QNX later to obtain performance improvements. 

    Best Wishes.

  • Hi, 

    The initialization of this refs_list is completed in functionvxSetGraphScheduleConfig()

    Yes, you are correct. If we provide obj->in_arr as refs_list, it would definitely fail as ldc_out_arr is not same as obj->in_arr.

    Source code 3480.diff.zip 

    This is why in this diff file, if you see refs_list, I had given the below 

    <     graph_parameters_queue_params_list[0].refs_list = (vx_reference*)&src_frame[0];
    --- instead of ---
    >     graph_parameters_queue_params_list[0].refs_list = (vx_reference*)&obj->in_arr[0];

    Seems like you have missed out on this implementation. Please check the below changes in your diff file. The below changes are needed to achieve this.

    < vx_status SrvInit(FWSRVobj *obj, vx_context context, vx_object_array src_frame[])
    ---
    > vx_status SrvInit(FWSRVobj *obj, vx_context context)
    
    
    576c630
    <         status = fs_app_create_gpu(obj, src_frame);
    ---
    >         status = fs_app_create_gpu(obj);
    587c641
    <     graph_parameters_queue_params_list[0].refs_list = (vx_reference*)&src_frame[0];
    ---
    >     graph_parameters_queue_params_list[0].refs_list = (vx_reference*)&obj->in_arr[0];
    621c675
    <                                     (vx_reference*)&src_frame[buf_id],
    ---
    >                                     (vx_reference*)&obj->in_arr[buf_id],

    Please add this change at your end to avoid getting the error "Unable to queue ref due to invalid ref".

    Regards,

    Nikhil

  • Hi, Nikhil

    If the cam_graph output and srv_graph input used in the same buffers,it seems that LDC may also be writing the o/p and SRV reading it would happen same time and half written image.

    TASK 1: DQ LDC o/p -> EnQ SRV i/p

    TASK 2: DQ SRC i/p -> EnQ LDC o/p

    Using the same buffer does not seem to ensure that two Graphs are mutually exclusive and operate on the same piece of memory.

    I would try it as your propose, and feedback test results later.


  • Hi, Nikhil

    Please find the Video for the testing VID_20230329_144031.zip

    Please find the attachment for the source code patchdiff_use_the_same_buffer.zip

    The frame rate and delay tested are as follows, 

    From the test results, a tearing image and video frame disorder are not effectively eliminated, it seems to be consistent with my analysis. It is still possible for two Graphs to read and write the same memory at the same time. Please help confirm further, thanks

    Best Wishes.

  • Hi,

    Could you please try the below app as it is. This uses the same buffer, and I don't see any tearing image with this.

    /cfs-file/__key/communityserver-discussions-components-files/791/cc_5F00_avm_5F00_dual_5F00_task_5F00_same_5F00_buffer.zip

    Below are the logs I'm getting from this

    a tearing image and video frame disorder are not effectively eliminated

    from the video shared, I believe by tearing image, you mean the discontinuity or vibration see in the video right? I do not see that in my side with this app.

    Please see me video below. Could you clarify what you do mean by frame disorder? Could you help me identify if you see that in the video attached below?

    /cfs-file/__key/communityserver-discussions-components-files/791/No_5F00_Latency_5F00_video.mp4

    Regards,
    Nikhil

  • Hi, Nikhil

    Please find the Video :VID_20230329_162043.zip

    yes, ti is the discontinuity or vibration see in the video, these phenomena also occur using the following procedure,

    /cfs-file/__key/communityserver-discussions-components-files/791/cc_5F00_avm_5F00_dual_5F00_task_5F00_same_5F00_buffer.zip

    Please confirm it, thanks.

  • Hi,

    Could you please share the logs and FPS for the below

    /cfs-file/__key/communityserver-discussions-components-files/791/cc_5F00_avm_5F00_dual_5F00_task_5F00_same_5F00_buffer.zip

    Could you please confirm if you are using the exact same application (that is the app provided above as it is - no change in logs or implementation or anything else)?

    /cfs-file/__key/communityserver-discussions-components-files/791/No_5F00_Latency_5F00_video.mp4

    This is weird as I did not see this at my end with the app.

    The only difference I see now is your QNX GPU vs my Linux GPU. 

    I don't have a QNX GPU right now with me. I shall test the same on QNX GPU and check if I'm seeing this issue at my end by tomorrow. 

    Let us see if the latency is matching in your logs, Please share the logs here.

    It is still possible for two Graphs to read and write the same memory at the same time

    This is not happening currently as the Dequeue function is a blocking function and would only dequeue the frame after its usage. Hence 2 graphs should not read or write the same memory at the same time now.

    Regards,

    Nikhil

  • Hi, Nikhil

    Could you check out the logs

    cc_avm.log
    J7EVM@QNX:/ti_fs/vision_apps# ./ti_avm.out  
    APP: Init QNX ... !!!
    Sciclient_qnxVirtToPhyFxn:Error from mem_offset
    Sciclient_qnxVirtToPhyFxn:Error from mem_offset
    appIpcInit: IPC: Init QNX ... !!!
    appIpcInit: IPC: Init ... Done !!!
     25768.301464 s: REMOTE_SERVICE: Init ... !!!
     25768.301606 s: REMOTE_SERVICE: Init ... Done !!!
     25768.301650 s: GTC Frequency = 200 MHz
    APP: Init ... Done !!!
     25768.301714 s:  VX_ZONE_INIT:Enabled
     25768.301743 s:  VX_ZONE_ERROR:Enabled
     25768.301777 s:  VX_ZONE_WARNING:Enabled
     25768.302026 s:  VX_ZONE_INIT:[tivxInit:71] Initialization Done !!!
     25768.302085 s:  VX_ZONE_INIT:[tivxHostInit:48] Initialization Done for HOST !!!
    Creating context done!
    Kernel loading done!
    #set_img_mosaic_params [1920][1280][4]
    Mosaic init done!
    Scaler Init Done! 
    Mosaic Node Add done!
    Scaler Node added!
    CameraInit: file_name ./file.yuv
    Graph verify done!
    App Send MSC Command Done!
    app_run_graph: Init!
    CI = 25781402757
    app_run_graph,598 enqueue status 0
    app_run_graph,604 enqueue status 0
    CI = 25781411092
    app_run_graph,598 enqueue status 0
    app_run_graph,604 enqueue status 0
    CI = 25781419486
    app_run_graph,598 enqueue status 0
    app_run_graph,604 enqueue status 0
    app_run_graph: Done!
    app_init:CameraInit done!
    Kernel loading done!
    [SrvInit] Graph create done!
    Reading calmat file ./psdkra/srv/srv_app/CALMAT.BIN
    Calmat size for cnt 0 = 48 
    Calmat size for cnt 1 = 48 
    Calmat size for cnt 2 = 48 
    Calmat size for cnt 3 = 48 
    For Camera = 0 Ref calmat[0] = 1073691599 Ref Calmat[11] = -451524 
    For Camera = 1 Ref calmat[0] = -57277815 Ref Calmat[11] = -360161 
    For Camera = 2 Ref calmat[0] = -1073434140 Ref Calmat[11] = 347218 
    For Camera = 3 Ref calmat[0] = 110263140 Ref Calmat[11] = 261270 
    file read completed 
    SrvInit: GPU graph done!
    EGL: version 1.4
    SrvInit: Graph verify done!
    SrvInit,623 enqueue status 0
    SrvInit,623 enqueue status 0
    SrvInit,623 enqueue status 0
    app_init:SrvInit done!
    
    LATENCY:         Camera -->   GPU Input que: avg =     10589 usecs, min/max =         0 /   1002529 usecs, #executions =        300
    LATENCY:  GPU Input que -->  GPU Output que: avg =     42481 usecs, min/max =      8307 /    179708 usecs, #executions =        300
    LATENCY:         Camera -->  GPU Output que: avg =     53141 usecs, min/max =     22907 /   1131748 usecs, #executions =        300
    app_run_graph_cam: Frame Num 300 Spend time 25790668 ms Fps 00.0
    app_run_graph_srv: Frame Num 300 Spend time 25790668 ms Fps 00.0
    GRAPH:        srv_graph (#nodes =   2, #executions =    301)
    GRAPH:        cam_graph (#nodes =   3, #executions =    300)
     NODE:      A72-0:          OpenGL_SRV_Node: avg =  27301 usecs, min/max =  15847 /  91296 usecs, #executions =        301
     NODE:  VPAC_LDC1:           cvt_color_node: avg =  17665 usecs, min/max =    348 /  21503 usecs, #executions =        300
     NODE:   DISPLAY1:              DisplayNode: avg =   2861 usecs, min/max =     71 /  19645 usecs, #executions =        301
     NODE:  VPAC_MSC1:              mosaic_node: avg =  13707 usecs, min/max =  12692 /  30602 usecs, #executions =        300
    
     NODE:  VPAC_MSC1:               ScalerNode: avg =   7164 usecs, min/max =   6019 /  11786 usecs, #executions =        300
    
    
    LATENCY:         Camera -->   GPU Input que: avg =         0 usecs, min/max =         0 /         0 usecs, #executions =        300
    LATENCY:  GPU Input que -->  GPU Output que: avg =     39115 usecs, min/max =     21370 /     52528 usecs, #executions =        300
    LATENCY:         Camera -->  GPU Output que: avg =     39115 usecs, min/max =     21370 /     52528 usecs, #executions =        300
    app_run_graph_cam: Frame Num 600 Spend time 8333 ms Fps 36.0
    GRAPH:        srv_graph (#nodes =   2, #executions =    601)
    app_run_graph_srv: Frame Num 600 Spend time 8329 ms Fps 36.0
     NODE:      A72-0:          OpenGL_SRV_Node: avg =  27494 usecs, min/max =  15847 /  91296 usecs, #executions =        601
    GRAPH:        cam_graph (#nodes =   3, #executions =    600)
     NODE:   DISPLAY1:              DisplayNode: avg =   2770 usecs, min/max =     71 /  19645 usecs, #executions =        601
     NODE:  VPAC_LDC1:           cvt_color_node: avg =  17579 usecs, min/max =    348 /  21503 usecs, #executions =        600
    
     NODE:  VPAC_MSC1:              mosaic_node: avg =  13493 usecs, min/max =  12687 /  30602 usecs, #executions =        600
     NODE:  VPAC_MSC1:               ScalerNode: avg =   6995 usecs, min/max =   6019 /  11786 usecs, #executions =        600
    
    app_run_graph_srv: Frame Num 900 Spend time 7916 ms Fps 37.8
    GRAPH:        cam_graph (#nodes =   3, #executions =    900)
     NODE:  VPAC_LDC1:           cvt_color_node: avg =  17764 usecs, min/max =    348 /  21503 usecs, #executions =        900
     NODE:  VPAC_MSC1:              mosaic_node: avg =  13627 usecs, min/max =  12528 /  30602 usecs, #executions =        900
     NODE:  VPAC_MSC1:               ScalerNode: avg =   7127 usecs, min/max =   6019 /  11943 usecs, #executions =        900
    
    app_run_graph_cam: Frame Num 900 Spend time 7931 ms Fps 37.8
    GRAPH:        srv_graph (#nodes =   2, #executions =    900)
     NODE:      A72-0:          OpenGL_SRV_Node: avg =  27124 usecs, min/max =  15802 /  91296 usecs, #executions =        900
     NODE:   DISPLAY1:              DisplayNode: avg =   2720 usecs, min/max =     71 /  19645 usecs, #executions =        900
    
    
    LATENCY:         Camera -->   GPU Input que: avg =      6676 usecs, min/max =         0 /     83474 usecs, #executions =        300
    LATENCY:  GPU Input que -->  GPU Output que: avg =     41163 usecs, min/max =     19555 /     70102 usecs, #executions =        300
    LATENCY:         Camera -->  GPU Output que: avg =     47901 usecs, min/max =     19555 /    122385 usecs, #executions =        300
    app_run_graph_srv: Frame Num 1200 Spend time 7498 ms Fps 40.0
    GRAPH:        cam_graph (#nodes =   3, #executions =   1200)
     NODE:  VPAC_LDC1:           cvt_color_node: avg =  18138 usecs, min/max =    348 /  21811 usecs, #executions =       1200
     NODE:  VPAC_MSC1:              mosaic_node: avg =  13959 usecs, min/max =  12528 /  30602 usecs, #executions =       1200
     NODE:  VPAC_MSC1:               ScalerNode: avg =   7633 usecs, min/max =   6019 /  12205 usecs, #executions =       1200
    
    app_run_graph_cam: Frame Num 1200 Spend time 7500 ms Fps 40.0
    GRAPH:        srv_graph (#nodes =   2, #executions =   1200)
     NODE:      A72-0:          OpenGL_SRV_Node: avg =  26567 usecs, min/max =  15802 /  91296 usecs, #executions =       1200
     NODE:   DISPLAY1:              DisplayNode: avg =   2669 usecs, min/max =     71 /  19645 usecs, #executions =       1200
    
    
    LATENCY:         Camera -->   GPU Input que: avg =         0 usecs, min/max =         0 /         0 usecs, #executions =        300
    LATENCY:  GPU Input que -->  GPU Output que: avg =     45684 usecs, min/max =     36133 /     55551 usecs, #executions =        300
    LATENCY:         Camera -->  GPU Output que: avg =     45684 usecs, min/max =     36133 /     55551 usecs, #executions =        300
    app_run_graph_cam: Frame Num 1500 Spend time 8069 ms Fps 37.1
    app_run_graph_srv: Frame Num 1500 Spend time 8077 ms Fps 37.1
    GRAPH:        srv_graph (#nodes =   2, #executions =   1501)
    GRAPH:        cam_graph (#nodes =   3, #executions =   1500)
     NODE:      A72-0:          OpenGL_SRV_Node: avg =  26593 usecs, min/max =  15802 /  91296 usecs, #executions =       1501
     NODE:  VPAC_LDC1:           cvt_color_node: avg =  18136 usecs, min/max =    348 /  21811 usecs, #executions =       1500
     NODE:   DISPLAY1:              DisplayNode: avg =   2682 usecs, min/max =     71 /  19645 usecs, #executions =       1501
     NODE:  VPAC_MSC1:              mosaic_node: avg =  13933 usecs, min/max =  12528 /  30602 usecs, #executions =       1500
    
     NODE:  VPAC_MSC1:               ScalerNode: avg =   7613 usecs, min/max =   6019 /  12205 usecs, #executions =       1500
    
    
    LATENCY:         Camera -->   GPU Input que: avg =       377 usecs, min/max =         0 /     58953 usecs, #executions =        300
    LATENCY:  GPU Input que -->  GPU Output que: avg =     41236 usecs, min/max =     22862 /     56246 usecs, #executions =        300
    LATENCY:         Camera -->  GPU Output que: avg =     41614 usecs, min/max =     22862 /    108883 usecs, #executions =        300
    app_run_graph_cam: Frame Num 1800 Spend time 7616 ms Fps 39.3
    GRAPH:        srv_graph (#nodes =   2, #executions =   1801)
    app_run_graph_srv: Frame Num 1801 Spend time 7612 ms Fps 39.4
     NODE:      A72-0:          OpenGL_SRV_Node: avg =  26384 usecs, min/max =  15755 /  91296 usecs, #executions =       1801
    GRAPH:        cam_graph (#nodes =   3, #executions =   1801)
     NODE:   DISPLAY1:              DisplayNode: avg =   2661 usecs, min/max =     71 /  19645 usecs, #executions =       1801
     NODE:  VPAC_LDC1:           cvt_color_node: avg =  18245 usecs, min/max =    348 /  21860 usecs, #executions =       1801
    
     NODE:  VPAC_MSC1:              mosaic_node: avg =  14028 usecs, min/max =  12471 /  30602 usecs, #executions =       1801
     NODE:  VPAC_MSC1:               ScalerNode: avg =   7732 usecs, min/max =   6019 /  12205 usecs, #executions =       1801
    
    
    LATENCY:         Camera -->   GPU Input que: avg =      5131 usecs, min/max =         0 /     59466 usecs, #executions =        300
    LATENCY:  GPU Input que -->  GPU Output que: avg =     43860 usecs, min/max =     19651 /     70148 usecs, #executions =        300
    LATENCY:         Camera -->  GPU Output que: avg =     49075 usecs, min/max =     19651 /    109387 usecs, #executions =        300
    app_run_graph_cam: Frame Num 2100 Spend time 7576 ms Fps 39.5
    GRAPH:        srv_graph (#nodes =   2, #executions =   2100)
     NODE:      A72-0:          OpenGL_SRV_Node: avg =  26215 usecs, min/max =  15755 /  91296 usecs, #executions =       2100
     NODE:   DISPLAY1:              DisplayNode: avg =   2658 usecs, min/max =     71 /  19645 usecs, #executions =       2100
    
    app_run_graph_srv: Frame Num 2101 Spend time 7628 ms Fps 39.3
    GRAPH:        cam_graph (#nodes =   3, #executions =   2101)
     NODE:  VPAC_LDC1:           cvt_color_node: avg =  18372 usecs, min/max =    348 /  21860 usecs, #executions =       2101
     NODE:  VPAC_MSC1:              mosaic_node: avg =  14141 usecs, min/max =  12471 /  30602 usecs, #executions =       2101
     NODE:  VPAC_MSC1:               ScalerNode: avg =   7896 usecs, min/max =   6019 /  12205 usecs, #executions =       2101
    
    
    LATENCY:         Camera -->   GPU Input que: avg =         0 usecs, min/max =         0 /         0 usecs, #executions =        300
    LATENCY:  GPU Input que -->  GPU Output que: avg =     44945 usecs, min/max =     23027 /     56211 usecs, #executions =        300
    LATENCY:         Camera -->  GPU Output que: avg =     44945 usecs, min/max =     23027 /     56211 usecs, #executions =        300
    app_run_graph_cam: Frame Num 2400 Spend time 8057 ms Fps 37.2
    GRAPH:        srv_graph (#nodes =   2, #executions =   2401)
    app_run_graph_srv: Frame Num 2401 Spend time 8000 ms Fps 37.5
     NODE:      A72-0:          OpenGL_SRV_Node: avg =  26275 usecs, min/max =  15755 /  91296 usecs, #executions =       2401
    GRAPH:        cam_graph (#nodes =   3, #executions =   2401)
     NODE:   DISPLAY1:              DisplayNode: avg =   2679 usecs, min/max =     71 /  19645 usecs, #executions =       2401
     NODE:  VPAC_LDC1:           cvt_color_node: avg =  18308 usecs, min/max =    348 /  21860 usecs, #executions =       2401
    
     NODE:  VPAC_MSC1:              mosaic_node: avg =  14059 usecs, min/max =  12471 /  30602 usecs, #executions =       2401
     NODE:  VPAC_MSC1:               ScalerNode: avg =   7818 usecs, min/max =   6019 /  12205 usecs, #executions =       2401
    
    
    LATENCY:         Camera -->   GPU Input que: avg =       119 usecs, min/max =         0 /     46632 usecs, #executions =        300
    LATENCY:  GPU Input que -->  GPU Output que: avg =     41541 usecs, min/max =      8262 /     70716 usecs, #executions =        300
    LATENCY:         Camera -->  GPU Output que: avg =     41699 usecs, min/max =     21922 /     70716 usecs, #executions =        300
    app_run_graph_cam: Frame Num 2700 Spend time 8100 ms Fps 37.0
    GRAPH:        srv_graph (#nodes =   2, #executions =   2701)
    app_run_graph_srv: Frame Num 2701 Spend time 8095 ms Fps 37.0
     NODE:      A72-0:          OpenGL_SRV_Node: avg =  26344 usecs, min/max =  15755 /  91296 usecs, #executions =       2701
    GRAPH:        cam_graph (#nodes =   3, #executions =   2701)
     NODE:   DISPLAY1:              DisplayNode: avg =   2696 usecs, min/max =     71 /  19652 usecs, #executions =       2701
     NODE:  VPAC_LDC1:           cvt_color_node: avg =  18263 usecs, min/max =    348 /  21860 usecs, #executions =       2701
    
     NODE:  VPAC_MSC1:              mosaic_node: avg =  14010 usecs, min/max =  12471 /  30602 usecs, #executions =       2701
     NODE:  VPAC_MSC1:               ScalerNode: avg =   7761 usecs, min/max =   6019 /  12205 usecs, #executions =       2701
    
    
    LATENCY:         Camera -->   GPU Input que: avg =         0 usecs, min/max =         0 /         0 usecs, #executions =        300
    LATENCY:  GPU Input que -->  GPU Output que: avg =     41212 usecs, min/max =     21289 /     56289 usecs, #executions =        300
    LATENCY:         Camera -->  GPU Output que: avg =     41212 usecs, min/max =     21289 /     56289 usecs, #executions =        300
    app_run_graph_cam: Frame Num 3000 Spend time 8333 ms Fps 36.0
    GRAPH:        srv_graph (#nodes =   2, #executions =   3001)
    app_run_graph_srv: Frame Num 3001 Spend time 8329 ms Fps 36.0
     NODE:      A72-0:          OpenGL_SRV_Node: avg =  26479 usecs, min/max =  15755 /  91296 usecs, #executions =       3001
    GRAPH:        cam_graph (#nodes =   3, #executions =   3001)
     NODE:   DISPLAY1:              DisplayNode: avg =   2694 usecs, min/max =     71 /  19652 usecs, #executions =       3001
     NODE:  VPAC_LDC1:           cvt_color_node: avg =  18186 usecs, min/max =    348 /  21860 usecs, #executions =       3001
    
     NODE:  VPAC_MSC1:              mosaic_node: avg =  13937 usecs, min/max =  12471 /  30602 usecs, #executions =       3001
     NODE:  VPAC_MSC1:               ScalerNode: avg =   7668 usecs, min/max =   6019 /  12205 usecs, #executions =       3001
    
    
    LATENCY:         Camera -->   GPU Input que: avg =         0 usecs, min/max =         0 /         0 usecs, #executions =        300
    LATENCY:  GPU Input que -->  GPU Output que: avg =     39118 usecs, min/max =     22419 /     52507 usecs, #executions =        300
    LATENCY:         Camera -->  GPU Output que: avg =     39118 usecs, min/max =     22419 /     52507 usecs, #executions =        300
    app_run_graph_cam: Frame Num 3300 Spend time 7967 ms Fps 37.6
    GRAPH:        srv_graph (#nodes =   2, #executions =   3300)
     NODE:      A72-0:          OpenGL_SRV_Node: avg =  26479 usecs, min/max =  15722 /  91296 usecs, #executions =       3300
     NODE:   DISPLAY1:              DisplayNode: avg =   2698 usecs, min/max =     71 /  19652 usecs, #executions =       3300
    
    app_run_graph_srv: Frame Num 3302 Spend time 8063 ms Fps 37.2
    GRAPH:        cam_graph (#nodes =   3, #executions =   3303)
     NODE:  VPAC_LDC1:           cvt_color_node: avg =  18176 usecs, min/max =    348 /  21860 usecs, #executions =       3303
     NODE:  VPAC_MSC1:              mosaic_node: avg =  13928 usecs, min/max =  12471 /  30602 usecs, #executions =       3303
     NODE:  VPAC_MSC1:               ScalerNode: avg =   7630 usecs, min/max =   6019 /  12205 usecs, #executions =       3303
    
    
    LATENCY:         Camera -->   GPU Input que: avg =     10407 usecs, min/max =         0 /     93906 usecs, #executions =        300
    LATENCY:  GPU Input que -->  GPU Output que: avg =     40190 usecs, min/max =     18499 /     70162 usecs, #executions =        300
    LATENCY:         Camera -->  GPU Output que: avg =     50662 usecs, min/max =     18499 /    129132 usecs, #executions =        300
    app_run_graph_cam: Frame Num 3600 Spend time 7767 ms Fps 38.6
    GRAPH:        srv_graph (#nodes =   2, #executions =   3601)
     NODE:      A72-0:          OpenGL_SRV_Node: avg =  26416 usecs, min/max =  15722 /  91296 usecs, #executions =       3601
     NODE:   DISPLAY1:              DisplayNode: avg =   2727 usecs, min/max =     71 /  19652 usecs, #executions =       3601
    
    app_run_graph_srv: Frame Num 3602 Spend time 7727 ms Fps 38.8
    GRAPH:        cam_graph (#nodes =   3, #executions =   3602)
     NODE:  VPAC_LDC1:           cvt_color_node: avg =  18242 usecs, min/max =    348 /  21994 usecs, #executions =       3602
     NODE:  VPAC_MSC1:              mosaic_node: avg =  13973 usecs, min/max =  12470 /  30602 usecs, #executions =       3602
     NODE:  VPAC_MSC1:               ScalerNode: avg =   7681 usecs, min/max =   6019 /  12205 usecs, #executions =       3602
    
    
    LATENCY:         Camera -->   GPU Input que: avg =     16376 usecs, min/max =         0 /     92648 usecs, #executions =        300
    LATENCY:  GPU Input que -->  GPU Output que: avg =     35064 usecs, min/max =     18990 /     69938 usecs, #executions =        300
    LATENCY:         Camera -->  GPU Output que: avg =     51519 usecs, min/max =     18990 /    129140 usecs, #executions =        300
    app_run_graph_cam: Frame Num 3900 Spend time 8316 ms Fps 36.0
    GRAPH:        srv_graph (#nodes =   2, #executions =   3901)
     NODE:      A72-0:          OpenGL_SRV_Node: avg =  26510 usecs, min/max =  15722 /  91296 usecs, #executions =       3901
     NODE:   DISPLAY1:              DisplayNode: avg =   2723 usecs, min/max =     71 /  19652 usecs, #executions =       3901
    
    app_run_graph_srv: Frame Num 3902 Spend time 8304 ms Fps 36.1
    GRAPH:        cam_graph (#nodes =   3, #executions =   3902)
     NODE:  VPAC_LDC1:           cvt_color_node: avg =  18183 usecs, min/max =    348 /  21994 usecs, #executions =       3902
     NODE:  VPAC_MSC1:              mosaic_node: avg =  13920 usecs, min/max =  12470 /  30602 usecs, #executions =       3902
     NODE:  VPAC_MSC1:               ScalerNode: avg =   7616 usecs, min/max =   6019 /  12205 usecs, #executions =       3902
    
    
    LATENCY:         Camera -->   GPU Input que: avg =       710 usecs, min/max =         0 /     59734 usecs, #executions =        300
    LATENCY:  GPU Input que -->  GPU Output que: avg =     39092 usecs, min/max =     20842 /     58227 usecs, #executions =        300
    LATENCY:         Camera -->  GPU Output que: avg =     39808 usecs, min/max =     20842 /    109658 usecs, #executions =        300
    app_run_graph_cam: Frame Num 4200 Spend time 7684 ms Fps 39.0
    GRAPH:        srv_graph (#nodes =   2, #executions =   4201)
     NODE:      A72-0:          OpenGL_SRV_Node: avg =  26438 usecs, min/max =  15722 /  91296 usecs, #executions =       4201
     NODE:   DISPLAY1:              DisplayNode: avg =   2712 usecs, min/max =     71 /  19652 usecs, #executions =       4201
    
    app_run_graph_srv: Frame Num 4203 Spend time 7682 ms Fps 39.0
    GRAPH:        cam_graph (#nodes =   3, #executions =   4203)
     NODE:  VPAC_LDC1:           cvt_color_node: avg =  18222 usecs, min/max =    348 /  21994 usecs, #executions =       4203
     NODE:  VPAC_MSC1:              mosaic_node: avg =  13959 usecs, min/max =  12470 /  30602 usecs, #executions =       4203
     NODE:  VPAC_MSC1:               ScalerNode: avg =   7658 usecs, min/max =   6019 /  12205 usecs, #executions =       4203
    
    
    LATENCY:         Camera -->   GPU Input que: avg =      5959 usecs, min/max =         0 /     83294 usecs, #executions =        300
    LATENCY:  GPU Input que -->  GPU Output que: avg =     43639 usecs, min/max =     19682 /     70125 usecs, #executions =        300
    LATENCY:         Camera -->  GPU Output que: avg =     49673 usecs, min/max =     19682 /    122602 usecs, #executions =        300
    app_run_graph_cam: Frame Num 4500 Spend time 7500 ms Fps 40.0
    GRAPH:        srv_graph (#nodes =   2, #executions =   4501)
     NODE:      A72-0:          OpenGL_SRV_Node: avg =  26335 usecs, min/max =  15722 /  91296 usecs, #executions =       4501
     NODE:   DISPLAY1:              DisplayNode: avg =   2699 usecs, min/max =     71 /  19652 usecs, #executions =       4501
    
    app_run_graph_srv: Frame Num 4503 Spend time 7498 ms Fps 40.0
    GRAPH:        cam_graph (#nodes =   3, #executions =   4503)
     NODE:  VPAC_LDC1:           cvt_color_node: avg =  18295 usecs, min/max =    348 /  21994 usecs, #executions =       4503
     NODE:  VPAC_MSC1:              mosaic_node: avg =  14030 usecs, min/max =  12470 /  30602 usecs, #executions =       4503
     NODE:  VPAC_MSC1:               ScalerNode: avg =   7755 usecs, min/max =   6019 /  12228 usecs, #executions =       4503
    
    
    LATENCY:         Camera -->   GPU Input que: avg =         0 usecs, min/max =         0 /         0 usecs, #executions =        300
    LATENCY:  GPU Input que -->  GPU Output que: avg =     45663 usecs, min/max =     23851 /     56196 usecs, #executions =        300
    LATENCY:         Camera -->  GPU Output que: avg =     45663 usecs, min/max =     23851 /     56196 usecs, #executions =        300
    releasing srv_applib done
    releasing param_obj done
    releasing srv_views_array done
    releasing in_config done
    releasing in_calmat_object done
    releasing in_offset_object done
    releasing in_lens_param_object done
    releasing out_gpulut_array done
    releasing srv_node done
    releasing srv_img done
    releasing graph_gpu_lut done
    SrvDeinit: GPU delete done!
     25907.471625 s:  VX_ZONE_ERROR:[ownReleaseReferenceInt:307] Invalid reference
     25907.471681 s:  VX_ZONE_ERROR:[ownReleaseReferenceInt:307] Invalid reference
     25907.471723 s:  VX_ZONE_ERROR:[ownReleaseReferenceInt:307] Invalid reference
    SrvDeinit: Graph delete done!
    Srv Kernel unload done
    Mosaic delete done!
    Scaler objects deleted!
    Graph delete done!
    Mosaic deinit done!
    Scaler deinit done!
    Release context done!
    App De-init Done!
     25907.527311 s:  VX_ZONE_INIT:[tivxHostDeInit:56] De-Initialization Done for HOST !!!
     25907.535236 s:  VX_ZONE_INIT:[tivxDeInit:111] De-Initialization Done !!!
    APP: Deinit ... !!!
     25907.535297 s: REMOTE_SERVICE: Deinit ... !!!
     25907.535389 s: REMOTE_SERVICE: Deinit ... Done !!!
    IPC: Deinit ... !!!
    IPC: Deinit ... Done !!!
    APP: Deinit ... Done !!!
    J7EVM@QNX:/ti_fs/vision_apps# 
    and FPS for the below

    This is not happening currently as the Dequeue function is a blocking function and would only dequeue the frame after its usage. Hence 2 graphs should not read or write the same memory at the same time now.

    yes, The Dequeue function is indeed a block function.  But what's strange about me is

    ldc_in_arr has been enque the to the CAM graph, and it  has been enque the to the Srv graph either

     Is the queue under the FIFO method right?

     If under the FIFO method, CAM Graph deque the Buffer1,  and  SRV Graph would also deque the Buffer1,  then enque the each other's queue. It seems   that the buffers of the two Graps are still the same, we cannot predict which buffer the GPU Graph is reading, and CAM Graph is the same. 

    Is there a scenario where consuming times of the CAM Graph is less than the SRV Graph , so the SRV may be overwritten by the CAM Graph before it processed?

  • Hi,

    Is there a scenario where consuming times of the CAM Graph is less than the SRV Graph , so the SRV may be overwritten by the CAM Graph before it processed?

    Currently this scenario is not occuring at my end. I shall check internally with the experts on the same regarding this issue.

    Could you do a quick test here by commenting out the initial enqueue of the SRV buffer shown below and let me know if you are still seeing the image tearing?

    /* Please comment this out

    for (uint32_t buf_id = 0; buf_id < SRV_BUFFER_Q_DEPTH; buf_id++)
    {

        status = vxGraphParameterEnqueueReadyRef(
                                                      obj->graph,
                                                      obj->graph_parameter_index,
                                                      (vx_reference*)&src_frame[buf_id],
                                                       1);
    }

    */ Please comment this out

    As both the change (with or without this) the image tearing is not seen at my end. It would be great if you could try this change at your end.

    Ideally, once you receive the frames from the LDC output, you can then start enqueueing them to SRV input in the steady state.

    Regarding the GPU performance, I think you have enough data as shown below to raise this issue to QNX. Please contact QNX regarding the second part of this thread.

    You can find the collected GPU traces here:

    Linux_cc_avm.pvrtune

    qnx_cc_avm.pvrtune

    They can be viewed with PVRTuneDeveloper from Imagination Technologies: https://developer.imaginationtech.com/downloads/

    Regards,

    Nikhil

  • Hi, Nikhil

    As the change (without above Code) the image tearing is not seen at my end, But the latency increases and the frame rate decreases.

    VID_20230330_170236.zip

    This is the latency and the frame rate test result with the above Code and  the image tearing also has been seen.

    VID_20230330_171749.zip

    Regarding the GPU performance, I think you have enough data as shown below to raise this issue to QNX. Please contact QNX regarding the second part of this thread

    We have already fed back the issue to QNX, Currently waiting for a reply.

  • Hi, Nikhil

    I'm still a bit confused about this queue latency, shall you please touch my confusion, thanks.

    But please help me out,

    1. The latency from Capture Node to Viss Deque the buffer is 49ms

      a) Should it need to wait for the entire Graph execution to complete then the buffer corresponding obj->graph_parameter_index could be dequed?

      b) It is strange to see that latency is 0 in the test program. Data will at least pass through the LDC node from enque to deque, so the latency of this part should not be less than the time consume of the LDC,am I right?

    2. The latency from Srv Input que to Gpu process Done is 79ms.

    The mechanism for exchanging two Graphs in our current program is as follows, It seems that the method you recommend can reduce some latency. 


                                  Our current program                                                       your recommended methods

    The flow chart is as follows

    It seems not relevant with Cam Graph about the 79ms latency,at this point, I obtained the timestamp after the camera dequed.

    1. As the GPU is the source node in the SRV graph,is its scheduling controlled by vxGraphParameterEnqueueReadyRef()?If not called vxGraphParameterEnqueueReadyRef(), could the Graph execute it itself?

    2. After the GPU finishes using this buffer, then it Could be dequed by calling vxGraphParameterDequeueDoneRef(), am I right?

    According to your statement, the latency increases because old data is in the input queue, am I right ? 

    Could you please help me answer my doubts?

    1. Relationship between input queue and source node.

    a) Is the execution of the GPU node triggered synchronously after the enque operation? 

    b) Or is Graph scheduling itself,GPU nodes only query the input queue periodically to see if there are elements, If so, start execution, otherwise wait?

    If it is option b), Ignoring the impact of memcpy, Could I consider the two mechanisms mentioned above are not significantly different,  as a result of doing a 3 buffers pipe-up initially for the srv graph. In fact, for SRV Graph, we do not need to fill the queue at the beginning, but just enque when there is data available from cam graph, right? 

    If so, please also help solve this problem. I think the latency will indeed be effectively reduced.

    Lookint forward to your reply!

    Best wishes!

  • Hi, Nikhil

    How is it going? If you will not work tomorrow, could you please help reply the above question today? We can evaluate our code in advance, thanks

  • Hi,

    Please find my response below 

    Should it need to wait for the entire Graph execution to complete then the buffer corresponding obj->graph_parameter_index could be dequed?

    This 49 ms, that you are observing is from the end of the capture node (that is where the timestamps are updated) to the timestamp after the VISS o/p dequeue before mem_cpy right?

    The VISS would only dequeue the output once the buffer is used by its next nodes i.e., mosaic node and scalar. Hence the 49 ms would include 26ms of VISS node + 16 ms of Mosaic + current timestamp delay from the initial time due to possible old frames (26+16+x is around 49)

    It is strange to see that latency is 0 in the test program. Data will at least pass through the LDC node from enque to deque, so the latency of this part should not be less than the time consume of the LDC,am I right?

    This seems very strange as the same application running at my end on Linux didn't show the latency as 0 as shown in the image. I am currently trying the same on a QNX setup. This would require some time to get this setup ready. I believe you are not seeing this when you comment out the initial enqueue of srv node right? 

    Below are the logs I'm getting from this

    It seems that the method you recommend can reduce some latency

    Have you test this flow suggested for your application? May I know what is the current latency that you are seeing in your application? By how much has it decreased from 79ms?

    As the GPU is the source node in the SRV graph,is its scheduling controlled by vxGraphParameterEnqueueReadyRef()?If not called vxGraphParameterEnqueueReadyRef(), could the Graph execute it itself?

    As the GPU is waiting for the input from the VISS graph, we shouldn't enqueue it initially. As soon as we dequeue from the viss o/p and feed it into SRV graph, the graph should start executing.

    After the GPU finishes using this buffer, then it Could be dequed by calling vxGraphParameterDequeueDoneRef(), am I right?

    Yes.

    According to your statement, the latency increases because old data is in the input queue, am I right ? 

    As per your original implementation, since there is a wait to dequeue the srv graph and everything is in one graph, there is a possiblity that the difference in the current timestamp and the timestamp in the buffer enqueued to srv large due to old data in srv graph. 
    Since it is one task, this delay would be propagated further. 
    In case of two tasks, this issue should not be seen.

    a) Is the execution of the GPU node triggered synchronously after the enque operation? 

    b) Or is Graph scheduling itself,GPU nodes only query the input queue periodically to see if there are elements, If so, start execution, otherwise wait?

    As soon as a buffer is enqueued, it triggers the GPU node.

    In fact, for SRV Graph, we do not need to fill the queue at the beginning, but just enque when there is data available from cam graph, right?

    Yes. You are correct here. As soon as you enqueue the data, the srv graph should trigger the gpu node.

    Regards,

    Nikhil

  • Hi, Nikhil,

    Thanks for your reply.

    I have not tried on our application, because the image tearing also has been seen in the demo Apps for the recommand method.  Our Apps is more complicated than the demo apps, we should ensure the feasibility of the solution and then migrate it.

    This seems very strange as the same application running at my end on Linux didn't show the latency as 0 as shown in the image. I am currently trying the same on a QNX setup. This would require some time to get this setup ready. I believe you are not seeing this when you comment out the initial enqueue of srv node right? 

    This phenomenon really seems to happen only on my side, really strange.  Should you please sync the information when trying the same QNX setup, thank you?

    As per your original implementation, since there is a wait to dequeue the srv graph and everything is in one graph, there is a possiblity that the difference in the current timestamp and the timestamp in the buffer enqueued to srv large due to old data in srv graph. 
    Since it is one task, this delay would be propagated further. 
    In case of two tasks, this issue should not be seen.

    As soon as a buffer is enqueued, it triggers the GPU node.

    In fact, Srv Graph does not execute on its own, but triggers after enque, right?

    If the previous cycle was not completed for GPU which cannot trigger to process the new frame,  the new frame will be waited for the next enque to be processed by the GPU node. This will cause the latency in the waiting queue, right?

    For this mechanism, if GPU has no time to process, the frame rate of CAM Graph may also decrease. So if we want to ensure the frame rate of  Cam Graph, the processing time of SRV Graph must be less than CAM Graph, am i right?  

    So the performance of GPU on QNX systems is also one of the factors that cause latency? We will continue to receive support from QNX for this.

    best wishes.

  • Hi, Nikhil,

    Shall you have any new developments?

  • Hi Erick, Nikhil

    QNX technical support has replied,They may need more information

    Could you please recapture the pvrtune logs using the old GPU driver per:
    Linux_cc_avm.pvrtune (14 MB) 1.13@5776728
    qnx_cc_avm.pvrtune (4.16 MB) 1.10@5307123

    Please make sure you follow the configurations described in the "Capture-settings.PNG" file.

    Share the 2 new pvrtune logs when you have them.
    Thank you,

  • Hi,

    I got the application running on QNX, and I do see the image tear, with the below (But no image tear in Linux)

    This is the latency and the frame rate test result with the above Code and  the image tearing also has been seen.

    VID_20230330_171749.zip

    I also checked the below and I'm not getting image tear with below, but the FPS drops in this case. (Again FPS drop not seen on Linux)

    As the change (without above Code) the image tearing is not seen at my end, But the latency increases and the frame rate decreases.

    VID_20230330_170236.zip

    So the performance of GPU on QNX systems is also one of the factors that cause latency?

    I too am suspecting this as the only difference between Linux and QNX is the GPU.

    Srv Graph does not execute on its own, but triggers after enque, right?

    Yes.

    Regards,
    Nikhil

  • Hi, Nikhil

    Could you please recapture the pvrtune logs when running any test demo for GPU

    per:
    Linux_cc_avm.pvrtune (14 MB) 1.13@5776728
    qnx_cc_avm.pvrtune (4.16 MB) 1.10@5307123

    Please make sure you follow the configurations described in the "Capture-settings.PNG" file.

    Share the 2 new pvrtune logs when you have them.

    We don't have a Linux environment here, thank a lot

  • Hi Nikhil,

    Shall you have the NDA with with ImgTec ?  The above testing method requires  the complete version of PVRPerfServer,If you have this authorization, could you please help provide the above data?

    We are currently unable to contact ImgTec and cannot obtain NDA authorization, the GPU performance differences on the QNX system and LINUX system will not be improved;

     it would be great if you could Provide the above data, thanks a lot !

  • Hello,

    You are correct, in order to capture this data, we need to use the PVRTuneComplete suite, which is only shared under NDA.

    Currently, when using these proprietary tools, it is not working in QNX on our side. It would be better if QNX gather this data themselves and work with IMG if they run into any issues, they have all of the resources they need to collect this.

    Regards,

    Erick