This thread has been locked.

If you have a related question, please click the "Ask a related question" button in the top right corner. The newly created question will be automatically linked to this question.

TDA4VM: Debugging a Drop in Frame Rate for a Multi-Camera App Developed on tda4vm sdk8.1

Part Number: TDA4VM

We have developed an app based on the yh_app_multi_cam of tda4vm sdk8.1, which captures images simultaneously from four identical cameras.

The graph consists of three nodes, namely capture, viss, and aewb.

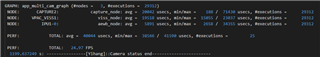
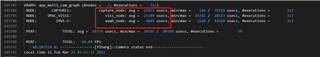
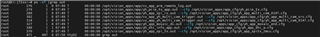
During normal operation, the frame rate is 25fps, and the runtime of each node is shown in Figure 1.

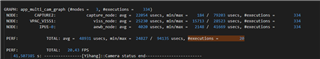
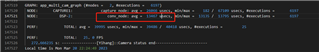
However, after a certain power reset, the app can still capture images, but the frame rate drops significantly, as shown in Figure 2.

The runtime of the viss node is noticeably longer.

Could you provide some debugging suggestions?

  • Hi,

    Can you please check and make sure that VPAC is running at 720MHz? I think there is an SciClient API to configure VPAC clock, not sure if it is available in the SDK8.1, but i do see it available in the later releases. 

    Also can you please elaborate on certain power reset? What are you exactly doing here? 

    Regards,

    Brijesh

  • Hi,

    1. We set the enable_configure_hwa_freq as 0. We think the freq of VPAC is default. Is it 720MHz?

    2. Power reset is power off the whole device, no power supply.

  • ok, can you please press 'p' on the console and share the complete performance stats? It looks like, after 4 hours of run, capture time and viss time is increasing. Any change in running condition? I mean are you running anything in parallel? Are you using SPL boot flow? 

  • Hi,

    1. The following figures are the complete performance stats during the problem.

    2. I think what you understand is not what I want to express, about the problem. We meet the problem, only 1 time, during an experiment with repeated power-on and power-off, almost 100 times. At the same time, the problem lasted from this power-on to power-off, as the following figures. However, in the remaining 99 tests, frame rate remained normal all time. 

    3. We run some apps in parallel, as the following figure.

    4.Yes, we use SPL boot flow.

    Thanks

  • Hi,

    When you see this issue next time, can you please run top command and see if any other application is taking most of the CPU time and so this multi-camera application is not getting CPU? 

    Regards,

    Brijesh