This thread has been locked.

If you have a related question, please click the "Ask a related question" button in the top right corner. The newly created question will be automatically linked to this question.

TDA4VM: Inference thread crashes during the model inference process

Part Number: TDA4VM

Issue: Inference thread crashes during the model inference process.

We suspect that it may be due to insufficient resources, but no effective logs have been observed.

Details:

The CPU usage remains consistently high (97%), and we are working on optimization.

The shared memory usage is approximately 80MB, which should be within the configured limit of 512MB.

The average memory bandwidth is around 5.5GB/s with a peak of 104GB/s.

Hardware: tda4vm

ti_sdk Version: ti sdk 8.4

Trigger Condition: Simultaneous inference of 7 models using 4 threads, with one of the models being larger. If we remove this largest model, we haven't encountered any crashes for now.


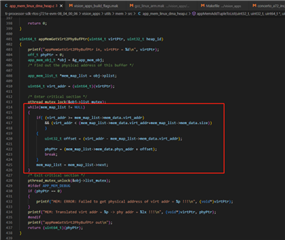
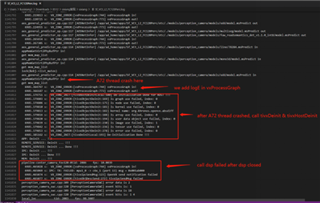
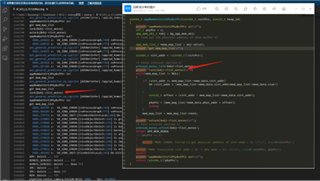
By adding logs in the tiovx source code, we have identified the crash location as follows. During multiple tests, the crashes occur between 10 to 90 minutes, and the crash position remains consistent.

  • Hi,

    Could you please let me know from where are you calling this function in the application?

    If possible, could you please share your application for a review?

    Could you please elaborate on the crash? Are there any error logs? Which core is getting crashed?

    Regards,

    Nikhil

  • We run 7 models in 4 threads

    got crash callstack as follow(with gdb), running on A72 core

    log is attached below

    Thread 23 "ActorThread_2" received signal SIGSEGV, Segmentation fault.
    [Switching to Thread 0xfee865caec00 (LWP 1298)]
    0x0000fee8820a48e4 in appMemGetVirt2PhyBufPtr () from /app/ad_home/lib/libvx_tidl_sdk.so
    (gdb) bt
    #0  0x0000fee8820a48e4 in appMemGetVirt2PhyBufPtr () from /app/ad_home/lib/libvx_tidl_sdk.so
    #1  0x0000fee8805398b4 in MindSporeA::ti::TivxAllocator::TivxMemHost2SharedPtr(void*) () from /usr/lib64/libmindspore-a.so
    #2  0x0000fee880470efc in MindSporeA::ti::TiNode::Run(std::__1::vector<mindspore::MSTensor, std::__1::allocator<mindspore::MSTensor> > const&, std::__1::vector<mindspore::MSTensor, std::__1::allocator<mindspore::MSTensor> >&) () from /usr/lib64/libtda4_hal.so
    #3  0x0000fee8805d3238 in MindSporeA::TiProcessor::Run(std::__1::vector<mindspore::MSTensor, std::__1::allocator<mindspore::MSTensor> > const&, std::__1::vector<mindspore::MSTensor, std::__1::allocator<mindspore::MSTensor> >&) const () from /usr/lib64/libti-plugin.so
    #4  0x0000fee8805d0298 in MindSporeA::TiCustomKernel::Execute() () from /usr/lib64/libti-plugin.so
    #5  0x0000fee87f98d9cc in mindspore::kernel::KernelExec::DoExecute() () from /usr/lib64/libmindspore-lite.so
    #6  0x0000fee87f98ded0 in ?? () from /usr/lib64/libmindspore-lite.so
    #7  0x0000fee87f99bad4 in mindspore::kernel::CustomSubGraph::Execute(std::__1::function<bool (std::__1::vector<mindspore::lite::Tensor*, std::__1::allocator<mindspore::lite::Tensor*> >, std::__1::vector<mindspore::lite::Tensor*, std::__1::allocator<mindspore::lite::Tensor*> >, mindspore::MSCallBackParam const&)> const&, std::__1::function<bool (std::__1::vector<mindspore::lite::Tensor*, std::__1::allocator<minds

    Sf_VCt_L2_FC120Perc.zip

  • Hi,

    In your application, are you doing any processing on A72 apart from running the OpenVX application? 

    Could you please elaborate on your OpenVX graph and how are you running 7 models in 4 threads from an OpenVX perspective?

    The CPU usage remains consistently high (97%), and we are working on optimization

    Do you mean that A72 usage becomes 97%? Could you please confirm if you are running the models on C7x or A72?

    Regards,

    Nikhil