This thread has been locked.

If you have a related question, please click the "Ask a related question" button in the top right corner. The newly created question will be automatically linked to this question.

TMDS64EVM: enet lwip ICSSG example poor iperf performance

Part Number: TMDS64EVM

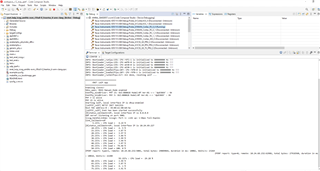
CCS v12.1 + MCU+ SDK v08.06.00.43

Running enet_lwip_icssg_am64x_evm_r5fss0-0_freertos_ti-arm-clang example

Connected the lower ICSSG ethernet port through a TPLink gigabit switch to a PC running Windows 10 and iperf v2.0.9-win64

Given the example output I was expecting 100Mbits/sec at around 50% CPU usage but instead getting around 50Mbits/s at around 100% CPU usage . I need GbE running at full speed so what is causing the poor performance from the R5F core ? What release of the 08.06 MCU+ SDK was the example tested with ?

TMDS64EVM output

▒
Starting NULL Bootloader ...

DMSC Firmware Version 8.6.4--v08.06.04 (Chill Capybar
DMSC Firmware revision 0x8
DMSC ABI revision 3.1

INFO: Bootloader_runCpu:155: CPU r5f1-0  is initialized to 800000000 Hz !!!
INFO: Bootloader_runCpu:155: CPU r5f1-1 is initialized to 800000000 Hz !!!
INFO: Bootloader_runCpu:155: CPU m4f0-0 is initialized to 400000000 Hz !!!
INFO: Bootloader_runCpu:155: CPU a530-0 is initialized to 800000000 Hz !!!
INFO: Bootloader_runCpu:155: CPU a530-1 is initialized to 800000000 Hz !!!
INFO: Bootloader_loadSelfCpu:207: CPU r5f0-0 is initialized to 800000000 Hz !!!
INFO: Bootloader_loadSelfCpu:207: CPU r5f0-1 is initialized to 800000000 Hz !!!
INFO: Bootloader_runSelfCpu:217: All done, reseting self ...

==========================
      ENET LWIP App
==========================
Enabling clocks!
Mdio_open: MDIO Manual_Mode enabled
EnetPhy_bindDriver: PHY 15: OUI:080028 Model:0f Ver:01 <-> 'dp83869' : OK
PHY 3 is alive
PHY 15 is alive
Starting lwIP, local interface IP is dhcp-enabled
[LWIPIF_LWIP] NETIF INIT SUCCESS
Host MAC address-0 : 34:08:e1:80:b7:b3
[LWIPIF_LWIP] Enet has been started successfully
[0]status_callback==UP, local interface IP is 0.0.0.0
UDP server listening on port 5001
Icssg_handleLinkUp: icssg1-1: Port 1: Link up: 1-Gbps Full-Duplex
link_callback==UP
      5.149s : CPU load =   2.82 %
[0]status_callback==UP, local interface IP is 195.198.8.234
     10.149s : CPU load =   2.57 %
     15.149s : CPU load =   2.52 %
     20.149s : CPU load =   2.52 %
     25.149s : CPU load =   2.52 %
     30.149s : CPU load =   2.53 %
     35.149s : CPU load =  91.42 %
     40.149s : CPU load =  98.74 %
IPERF report: type=2, remote: 195.198.8.236:5001, total bytes: 10314924, duration in ms: 13745, kbits/s: 6000
                                  45.149s : CPU load =  97.89 %
     50.149s : CPU load =  97.29 %
IPERF report: type=0, remote: 195.198.8.236:1751, total bytes: 114819096, duration in ms: 20062, kbits/s: 45784
                                    55.149s : CPU load =   9.13 %
     60.149s : CPU load =   2.54 %
     65.149s : CPU load =   2.54 %
     70.149s : CPU load =   2.55 %
     75.149s : CPU load =   2.54 %
     80.149s : CPU load =   2.54 %
     85.149s : CPU load =   2.54 %
     90.149s : CPU load =   2.54 %
     95.149s : CPU load =   2.55 %
    100.149s : CPU load =   2.55 %
    105.149s : CPU load =   2.55 %
    110.149s : CPU load =   2.54 %
    115.149s : CPU load =   2.57 %
    120.149s : CPU load =   2.54 %
    125.149s : CPU load =  81.26 %
    130.149s : CPU load =  98.18 %
IPERF report: type=0, remote: 195.198.8.236:1756, total bytes: 64618520, duration in ms: 10071, kbits/s: 51328
                                  135.149s : CPU load =  96. 7 %
    140.149s : CPU load =  96.98 %
IPERF report: type=1, remote: 195.198.8.236:5001, total bytes: 47467544, duration in ms: 10000, kbits/s: 37968
                                  145.149s : CPU load =  28.55 %
    150.149s : CPU load =  97.77 %
IPERF report: type=0, remote: 195.198.8.236:1759, total bytes: 64880664, duration in ms: 10064, kbits/s: 51568
                                  155.149s : CPU load =  97. 7 %
    160.149s : CPU load =  97. 0 %
IPERF report: type=1, remote: 195.198.8.236:5001, total bytes: 47400384, duration in ms: 10003, kbits/s: 37904
                                  165.149s : CPU load =  91.27 %
    170.149s : CPU load =   2.55 %
    175.149s : CPU load =  90.95 %
    180.149s : CPU load =  98.67 %
IPERF report: type=2, remote: 195.198.8.236:5001, total bytes: 10974, duration in ms: 9620, kbits/s: 8
                          185.149s : CPU load =  96.88 %
    190.149s : CPU load =  97.67 %
IPERF report: type=0, remote: 195.198.8.236:1763, total bytes: 129499160, duration in ms: 20064, kbits/s: 51632
                                   195.149s : CPU load =  11.81 %
    200.149s : CPU load =   2.55 %
    205.149s : CPU load =   2.55 %
    210.149s : CPU load =   2.55 %
    215.149s : CPU load =   2.55 %

PC output

C:\Users\Jon\Downloads\iperf-2.0.9-win64\iperf-2.0.9-win64>iperf -c 195.198.8.234 -i 5 -t 20 -d
------------------------------------------------------------
Server listening on TCP port 5001
TCP window size:  208 KByte (default)
------------------------------------------------------------
------------------------------------------------------------
Client connecting to 195.198.8.234, TCP port 5001
TCP window size:  208 KByte (default)
------------------------------------------------------------
[  4] local 195.198.8.236 port 1751 connected with 195.198.8.234 port 5001
[  5] local 195.198.8.236 port 5001 connected with 195.198.8.234 port 59266
[ ID] Interval       Transfer     Bandwidth
[  4]  0.0- 5.0 sec  17.1 MBytes  28.7 Mbits/sec
[  4]  5.0-10.0 sec  31.0 MBytes  52.0 Mbits/sec
[  4] 10.0-15.0 sec  30.8 MBytes  51.6 Mbits/sec
[  4] 15.0-20.0 sec  30.5 MBytes  51.2 Mbits/sec
[  4]  0.0-20.0 sec   110 MBytes  45.9 Mbits/sec

C:\Users\Jon\Downloads\iperf-2.0.9-win64\iperf-2.0.9-win64>iperf -c 195.198.8.234 -r
------------------------------------------------------------
Server listening on TCP port 5001
TCP window size:  208 KByte (default)
------------------------------------------------------------
------------------------------------------------------------
Client connecting to 195.198.8.234, TCP port 5001
TCP window size:  208 KByte (default)
------------------------------------------------------------
[  4] local 195.198.8.236 port 1756 connected with 195.198.8.234 port 5001
[ ID] Interval       Transfer     Bandwidth
[  4]  0.0-10.0 sec  61.6 MBytes  51.5 Mbits/sec
[  4] local 195.198.8.236 port 5001 connected with 195.198.8.234 port 59267
[  4]  0.0-10.0 sec  45.3 MBytes  38.0 Mbits/sec

C:\Users\Jon\Downloads\iperf-2.0.9-win64\iperf-2.0.9-win64>iperf -c 195.198.8.234 -r
------------------------------------------------------------
Server listening on TCP port 5001
TCP window size:  208 KByte (default)
------------------------------------------------------------
------------------------------------------------------------
Client connecting to 195.198.8.234, TCP port 5001
TCP window size:  208 KByte (default)
------------------------------------------------------------
[  4] local 195.198.8.236 port 1759 connected with 195.198.8.234 port 5001
[ ID] Interval       Transfer     Bandwidth
[  4]  0.0-10.0 sec  61.9 MBytes  51.8 Mbits/sec
[  4] local 195.198.8.236 port 5001 connected with 195.198.8.234 port 59268
[  4]  0.0-10.0 sec  45.2 MBytes  37.9 Mbits/sec

C:\Users\Jon\Downloads\iperf-2.0.9-win64\iperf-2.0.9-win64>iperf -c 195.198.8.234 -i 5 -t 20 -d -V
------------------------------------------------------------
Server listening on TCP port 5001
TCP window size:  208 KByte (default)
------------------------------------------------------------
------------------------------------------------------------
Client connecting to 195.198.8.234, TCP port 5001
TCP window size:  208 KByte (default)
------------------------------------------------------------
[  4] local 195.198.8.236 port 1763 connected with 195.198.8.234 port 5001
[ ID] Interval       Transfer     Bandwidth
[  4]  0.0- 5.0 sec  31.4 MBytes  52.6 Mbits/sec
[  4]  5.0-10.0 sec  30.9 MBytes  51.8 Mbits/sec
[  4] 10.0-15.0 sec  30.2 MBytes  50.8 Mbits/sec
[  4] 15.0-20.0 sec  30.9 MBytes  51.8 Mbits/sec
[  4]  0.0-20.0 sec   124 MBytes  51.7 Mbits/sec

  • Hi Jon,

    Thanks for your query.

    I will check it and get back to you.

    To be on same page we are referring example mentioned in https://software-dl.ti.com/mcu-plus-sdk/esd/AM64X/08_06_00_45/exports/docs/api_guide_am64x/EXAMPLES_ENET_LWIP_ICSSG.html ?

    Meanwhile, can you please try with direct connection between PC <=> AM64x-EVM ?

    Are you getting same performance on both ports of ICSSG ?

    Best Regards

    Ashwani

  • Hi Ashwani,

    Yes, that's the example (but I'm using 08.06.00.43 rather than 08.06.00.45 as the TCP server example seems to be broken in 45 (see my post https://e2e.ti.com/support/processors-group/processors/f/processors-forum/1244367/tmds64evm-enet_icssg_tcpserver-example-seems-to-be-broken-with-mcu-sdk-v08-06-00-45)

    Direct connection doesn't assign an IP address, I'm not sure why because the PHY seems to support auto MDI-X but it seems to need the external connection through a DHCP router as shown in the connection diagram. The log is below

    ▒
    Starting NULL Bootloader ...
    
    DMSC Firmware Version 8.6.4--v08.06.04 (Chill Capybar
    DMSC Firmware revision 0x8
    DMSC ABI revision 3.1
    
    INFO: Bootloader_runCpu:155: CPU r5f1-0  is initialized to 800000000 Hz !!!
    INFO: Bootloader_runCpu:155: CPU r5f1-1 is initialized to 800000000 Hz !!!
    INFO: Bootloader_runCpu:155: CPU m4f0-0 is initialized to 400000000 Hz !!!
    INFO: Bootloader_runCpu:155: CPU a530-0 is initialized to 800000000 Hz !!!
    INFO: Bootloader_runCpu:155: CPU a530-1 is initialized to 800000000 Hz !!!
    INFO: Bootloader_loadSelfCpu:207: CPU r5f0-0 is initialized to 800000000 Hz !!!
    INFO: Bootloader_loadSelfCpu:207: CPU r5f0-1 is initialized to 800000000 Hz !!!
    INFO: Bootloader_runSelfCpu:217: All done, reseting self ...
    
    ==========================
          ENET LWIP App
    ==========================
    Enabling clocks!
    Mdio_open: MDIO Manual_Mode enabled
    EnetPhy_bindDriver: PHY 15: OUI:080028 Model:0f Ver:01 <-> 'dp83869' : OK
    PHY 3 is alive
    PHY 15 is alive
    Starting lwIP, local interface IP is dhcp-enabled
    [LWIPIF_LWIP] NETIF INIT SUCCESS
    Host MAC address-0 : 34:08:e1:80:b7:b3
    [LWIPIF_LWIP] Enet has been started successfully
    [0]status_callback==UP, local interface IP is 0.0.0.0
    UDP server listening on port 5001
    Icssg_handleLinkUp: icssg1-1: Port 1: Link up: 1-Gbps Full-Duplex
    link_callback==UP
          5.150s : CPU load =   2.88 %
         10.150s : CPU load =   2.49 %
         15.150s : CPU load =   2.45 %
    

    Not sure how to swap ports, I tried changing to ENET_MAC_PORT_2 but again it didn't assign an IP address.

    Kind regards,

    Jon

  • Hi Jon,

    Thanks for updates.

    I will check and get back to you.

    Best Regards

    Ashwani

  • Hi Jon,

    An update:

    I am able to build and run "C:\ti\mcu_plus_sdk_am64x_08_06_00_45\examples\networking\lwip\enet_lwip_icssg".

    Can you try on your side and update the results ?

    Best Regards

    Ashwani

  • Hi Ashwani,

    I note you are also seeing 100% CPU utilisation (50% shown in the accompanying readme) and you haven't reported the iperf thru-put Mb/s you're getting. Please could you add this. What SBL are you using ?

    I get very similar results with the 08.06.00.45 SDK as I did with the 08.06.00.43 ; marginally worse if anything.

    C:\Users\Jon\Downloads\iperf-2.0.9-win64\iperf-2.0.9-win64>iperf -c 195.198.8.234 -i 5 -t 20 -d
    ------------------------------------------------------------
    Server listening on TCP port 5001
    TCP window size:  208 KByte (default)
    ------------------------------------------------------------
    ------------------------------------------------------------
    Client connecting to 195.198.8.234, TCP port 5001
    TCP window size:  208 KByte (default)
    ------------------------------------------------------------
    [  4] local 195.198.8.239 port 13612 connected with 195.198.8.234 port 5001
    [  5] local 195.198.8.239 port 5001 connected with 195.198.8.234 port 50284
    [ ID] Interval       Transfer     Bandwidth
    [  4]  0.0- 5.0 sec  17.0 MBytes  28.5 Mbits/sec
    [  4]  5.0-10.0 sec  32.0 MBytes  53.7 Mbits/sec
    [  4] 10.0-15.0 sec  30.6 MBytes  51.4 Mbits/sec
    [  4] 15.0-20.0 sec  29.5 MBytes  49.5 Mbits/sec
    [  4]  0.0-20.0 sec   109 MBytes  45.8 Mbits/sec
    
    C:\Users\Jon\Downloads\iperf-2.0.9-win64\iperf-2.0.9-win64>
    
    C:\Users\Jon\Downloads\iperf-2.0.9-win64\iperf-2.0.9-win64>iperf -c 195.198.8.234 -r
    ------------------------------------------------------------
    Server listening on TCP port 5001
    TCP window size:  208 KByte (default)
    ------------------------------------------------------------
    ------------------------------------------------------------
    Client connecting to 195.198.8.234, TCP port 5001
    TCP window size:  208 KByte (default)
    ------------------------------------------------------------
    [  4] local 195.198.8.239 port 13626 connected with 195.198.8.234 port 5001
    [ ID] Interval       Transfer     Bandwidth
    [  4]  0.0-10.0 sec  65.2 MBytes  54.6 Mbits/sec
    [  4] local 195.198.8.239 port 5001 connected with 195.198.8.234 port 50285
    

    Kind regards,

    Jon

  • Thanks for update Jon,

    I note you are also seeing 100% CPU utilisation (50% shown in the accompanying readme) and you haven't reported the iperf thru-put Mb/s you're getting.

    I am working with dev team to confirm the behavior. Just wan to update you that latest release is building properly.

    What SBL are you using ?

    My setup is with OSPI mode.

    Best Regards

    Ashwani

  • Hi Ashwani,

    Thanks.

    I'm using SBL NULL booting from an SD card and debugging with CCS at the moment. I was wondering if the performance could be tied in part to the DDR4 initialisation settings but I imagine there is more too it than just this ?

    Kind regards,

    Jon

  • Hi Eigo,

    As I am on leave, So please expect delay in my response.

    Best Regards

    Ashwani

  • Hi Ashwani,

    I hope you enjoyed your holiday. Any update on this ?

    Kind regards,

    Jon

  • Hi Jon,

    Can you please syscfg file, you are using using in your setup?

    Best Regards

    Ashwani

  • Hi Ashwani,

    It's just the standard syscfg from the example

    C:\ti\mcu_plus_sdk_am64x_08_06_00_43\examples\networking\lwip\enet_lwip_icssg\am64x-evm\r5fss0-0_freertos\example.syscfg

    Kind regards,

    Jon

  • Thanks Jon for confirmation.

    Means, you have not made any changes locally.

    Can you please try with UDP packets as well and update the results?

    Best Regards

    Ashwani 

  • Hi Ashwani,

    Correct, the TI example is unmodified.

    I will repeat the test with UDP packets later but what are you expecting this to show when the typical bandwidth is limited to 1Mb/s ? You have already replicated my results and determined yourself that the performance doesn't match the expected performance of a GbE connection or that shown in the documentation for the example.

    Kind regards,

    Jon

  • HI Jon,

    I will repeat the test with UDP packets later

    Will wait for the results....It should be better than TCP.

    performance doesn't match the expected performance of a GbE

    We are tracking this as a bug internally.

    Best Regards

    Ashwani

  • Hi Ashwani,

    Sorry for the delay I've been busy on other projects. Updated results below. I've swapped to a Netgear GS108 switch and BB router for the DHCP. Any update from your end on fixing this issue ?

    Many thanks,

    Jon

    TMDS64EVM output

    Starting NULL Bootloader ...
    
    DMSC Firmware Version 8.6.4--v08.06.04 (Chill Capybar
    DMSC Firmware revision 0x8
    DMSC ABI revision 3.1
    
    INFO: Bootloader_runCpu:155: CPU r5f1-0  is initialized to 800000000 Hz !!!
    INFO: Bootloader_runCpu:155: CPU r5f1-1 is initialized to 800000000 Hz !!!
    INFO: Bootloader_runCpu:155: CPU m4f0-0 is initialized to 400000000 Hz !!!
    INFO: Bootloader_runCpu:155: CPU a530-0 is initialized to 800000000 Hz !!!
    INFO: Bootloader_runCpu:155: CPU a530-1 is initialized to 800000000 Hz !!!
    INFO: Bootloader_loadSelfCpu:207: CPU r5f0-0 is initialized to 800000000 Hz !!!
    INFO: Bootloader_loadSelfCpu:207: CPU r5f0-1 is initialized to 800000000 Hz !!!
    INFO: Bootloader_runSelfCpu:217: All done, reseting self ...
    
    ==========================
          ENET LWIP App
    ==========================
    Enabling clocks!
    Mdio_open: MDIO Manual_Mode enabled
    EnetPhy_bindDriver: PHY 15: OUI:080028 Model:0f Ver:01 <-> 'dp83869' : OK
    EnetPhy_bindDriver: PHY 3: OUI:080028 Model:0f Ver:01 <-> 'dp83869' : OK
    PHY 3 is alive
    PHY 15 is alive
    Starting lwIP, local interface IP is dhcp-enabled
    [LWIPIF_LWIP] NETIF INIT SUCCESS
    Host MAC address-0 : 34:08:e1:80:b7:b3
    [LWIPIF_LWIP] Enet has been started successfully
    [0]status_callback==UP, local interface IP is 0.0.0.0
    UDP server listening on port 5001
    Icssg_handleLinkUp: icssg1: Port 1: Link up: 1-Gbps Full-Duplex
    link_callback==UP
    [0]status_callback==UP, local interface IP is 192.168.1.6
          5.157s : CPU load =   4.17 %
         10.157s : CPU load =   3.70 %
         15.157s : CPU load =   3.56 %
         20.157s : CPU load =   3.68 %
         25.157s : CPU load =   3.58 %
         30.157s : CPU load =   3.68 %
         35.157s : CPU load =   3.72 %
         40.157s : CPU load =   3.58 %
         45.157s : CPU load =   3.69 %
         50.157s : CPU load =   3.58 %
         55.157s : CPU load =   3.69 %
         60.157s : CPU load =   3.70 %
         65.157s : CPU load =  64.76 %
         70.157s : CPU load =  98.97 %
         75.157s : CPU load =  98.17 %
         80.157s : CPU load =  99.30 %
    IPERF report: type=1, remote: 192.168.1.42:5001, total bytes: 98368984, duration in ms: 20000, kbits/s: 39344
                                                                                                                 IPERF report: type=0, remote: 192.168.1.42:1420, total bytes: 3014680, duration in ms: 20071, kbits/s: 1200
                                                                                       85.157s : CPU load =  39.19 %
         90.157s : CPU load =   4. 8 %
         95.157s : CPU load =   5.74 %
    [  1]  0.0-10.0 sec  1.25 MBytes  1.05 Mbits/sec     0/  893 (0.0e-308%)
        100.157s : CPU load =   5.63 %
        105.157s : CPU load =   5.74 %
    [  1]  0.0-20.0 sec  2.50 MBytes  1.05 Mbits/sec     0/ 1785 (0.0e-308%)
        110.157s : CPU load =  22.34 %
        115.157s : CPU load = 100. 0 %
        120.157s : CPU load = 100. 0 %
        125.157s : CPU load = 100. 0 %
        130.157s : CPU load = 100. 0 %
        135.157s : CPU load =  33.94 %
        140.157s : CPU load =   3.70 %
        145.157s : CPU load =   3.70 %
        150.157s : CPU load =   3.59 %
        155.157s : CPU load =   3.71 %
        160.157s : CPU load =   3.60 %
        165.157s : CPU load =   3.71 %
        170.157s : CPU load =   3.61 %
    UDP test passed Successfully
        175.157s : CPU load =  29.71 %
        180.157s : CPU load =  56.41 %
        185.157s : CPU load =  45.80 %
        190.157s : CPU load =  54.17 %
        195.157s : CPU load =  28.51 %
        200.157s : CPU load =   3.72 %
        205.157s : CPU load =  74.12 %
        210.157s : CPU load =  98.87 %
        215.157s : CPU load =  98.41 %
        220.157s : CPU load =  99.36 %
    IPERF report: type=1, remote: 192.168.1.42:5001, total bytes: 98147064, duration in ms: 20000, kbits/s: 39256
                                                                                                                 IPERF report: type=0, remote: 192.168.1.42:1728, total bytes: 2415234, duration in ms: 20105, kbits/s: 960
                                                                                     225.157s : CPU load =  27.41 %
        230.157s : CPU load =   3.73 %
        235.157s : CPU load =   3.60 %
        240.157s : CPU load =   3.72 %
        245.157s : CPU load =  11.46 %
        250.157s : CPU load =  98.66 %
    IPERF report: type=0, remote: 192.168.1.42:1757, total bytes: 67520064, duration in ms: 10037, kbits/s: 53816
                                                                                                                     255.157s : CPU load =  97.51 %
        260.157s : CPU load =  99.34 %
    IPERF report: type=1, remote: 192.168.1.42:5001, total bytes: 50145184, duration in ms: 10000, kbits/s: 40112
                                                                                                                     265.157s : CPU load =  92.85 %
        270.157s : CPU load =  19.24 %
        275.157s : CPU load =  51.84 %
    [  2]  0.0-10.0 sec  74.2 MBytes  62.3 Mbits/sec  535814/588767 (91%)
        280.157s : CPU load =  67.21 %
        285.157s : CPU load = 100. 0 %
    UDP test passed Successfully
        290.157s : CPU load =  92.79 %
        295.157s : CPU load =   3.58 %
        300.157s : CPU load =   3.74 %
        305.157s : CPU load =   3.61 %
        310.157s : CPU load =   3.75 %
        315.157s : CPU load =   3.77 %
        320.157s : CPU load =   3.59 %
    

    PC output

    C:\Users\Jon\Downloads\iperf-2.0.9-win64\iperf-2.0.9-win64>iperf -c 192.168.1.6 -i 5 -t 20 -d -u -b 1000M
    ------------------------------------------------------------
    Server listening on UDP port 5001
    Receiving 1470 byte datagrams
    UDP buffer size:  208 KByte (default)
    ------------------------------------------------------------
    ------------------------------------------------------------
    Client connecting to 192.168.1.6, UDP port 5001
    Sending 1470 byte datagrams, IPG target: 11.76 us (kalman adjust)
    UDP buffer size:  208 KByte (default)
    ------------------------------------------------------------
    [  4] local 192.168.1.42 port 55306 connected with 192.168.1.6 port 5001
    [ ID] Interval       Transfer     Bandwidth
    [  4]  0.0- 5.0 sec   406 MBytes   681 Mbits/sec
    [  4]  5.0-10.0 sec   553 MBytes   927 Mbits/sec
    [  4] 10.0-15.0 sec   414 MBytes   695 Mbits/sec
    [  4]  0.0-20.0 sec  1.74 GBytes   749 Mbits/sec
    [  4] Sent 1274385 datagrams
    [  4] WARNING: did not receive ack of last datagram after 10 tries.
    
    C:\Users\Jon\Downloads\iperf-2.0.9-win64\iperf-2.0.9-win64>iperf -c 192.168.1.6 -i 5 -t 20 -d -b 1000M
    ------------------------------------------------------------
    Server listening on TCP port 5001
    TCP window size:  208 KByte (default)
    ------------------------------------------------------------
    ------------------------------------------------------------
    Client connecting to 192.168.1.6, TCP port 5001
    TCP window size:  208 KByte (default)
    ------------------------------------------------------------
    [  4] local 192.168.1.42 port 1728 connected with 192.168.1.6 port 5001
    [  5] local 192.168.1.42 port 5001 connected with 192.168.1.6 port 50285
    [ ID] Interval       Transfer     Bandwidth
    [  5]  0.0- 5.0 sec  23.1 MBytes  38.7 Mbits/sec
    [  4]  0.0- 5.0 sec   830 KBytes  1.36 Mbits/sec
    [  5]  5.0-10.0 sec  23.5 MBytes  39.5 Mbits/sec
    [  4]  5.0-10.0 sec   528 KBytes   866 Kbits/sec
    [  5] 10.0-15.0 sec  23.4 MBytes  39.3 Mbits/sec
    [  4] 10.0-15.0 sec   524 KBytes   858 Kbits/sec
    [  5] 15.0-20.0 sec  23.6 MBytes  39.5 Mbits/sec
    [  5]  0.0-20.0 sec  93.6 MBytes  39.2 Mbits/sec
    [  4] 15.0-20.0 sec   477 KBytes   781 Kbits/sec
    [  4]  0.0-20.1 sec  2.30 MBytes   962 Kbits/sec
    
    C:\Users\Jon\Downloads\iperf-2.0.9-win64\iperf-2.0.9-win64>iperf -c 192.168.1.6 -r -b 1000M
    ------------------------------------------------------------
    Server listening on TCP port 5001
    TCP window size:  208 KByte (default)
    ------------------------------------------------------------
    ------------------------------------------------------------
    Client connecting to 192.168.1.6, TCP port 5001
    TCP window size:  208 KByte (default)
    ------------------------------------------------------------
    [  4] local 192.168.1.42 port 1757 connected with 192.168.1.6 port 5001
    [ ID] Interval       Transfer     Bandwidth
    [  4]  0.0-10.0 sec  64.4 MBytes  54.0 Mbits/sec
    [  4] local 192.168.1.42 port 5001 connected with 192.168.1.6 port 50286
    [  4]  0.0-10.0 sec  47.8 MBytes  40.1 Mbits/sec
    
    C:\Users\Jon\Downloads\iperf-2.0.9-win64\iperf-2.0.9-win64>iperf -c 192.168.1.6 -r -u -b 1000M
    ------------------------------------------------------------
    Server listening on UDP port 5001
    Receiving 1470 byte datagrams
    UDP buffer size:  208 KByte (default)
    ------------------------------------------------------------
    ------------------------------------------------------------
    Client connecting to 192.168.1.6, UDP port 5001
    Sending 1470 byte datagrams, IPG target: 11.76 us (kalman adjust)
    UDP buffer size:  208 KByte (default)
    ------------------------------------------------------------
    [  4] local 192.168.1.42 port 55176 connected with 192.168.1.6 port 5001
    [ ID] Interval       Transfer     Bandwidth
    [  4]  0.0-10.0 sec   825 MBytes   692 Mbits/sec
    [  4] Sent 588767 datagrams
    [  4] Server Report:
    [  4]  0.0- 0.0 sec  4.00 GBytes   nan Bytes/sec  875903462271.985 ms -1000/808530483 (-0.00012%)
    [  4] 0.00-0.00 sec  1000000000 datagrams received out-of-order
    [  3] local 192.168.1.42 port 5001 connected with 192.168.1.6 port 5001
    [  3]  0.0-11.2 sec  70.1 MBytes  52.3 Mbits/sec   0.220 ms    1/49999 (0.002%)
    [  3] 0.00-11.24 sec  1 datagrams received out-of-order
    
    C:\Users\Jon\Downloads\iperf-2.0.9-win64\iperf-2.0.9-win64>

  • Thanks Jon for follow up.

    I have an update for you.

    MCUSDK release is out: www.ti.com/.../09.00.00.31

    We are getting good performance numbers on CPSW port with this release.

    ICSSG part is on going (still not out). It will be part of upcoming Industrial Communication SDK.

    Best Regards

    Ashwani

  • Hi Jon,

    I have ran the iperf tests and the results are as follows in our test environment.

    PC:
    Linux PC : Ubuntu 20.04.1 LTS 
    Iperf version 2.0.13 

    SDK: mcu_plus_sdk_am64x_08_06_00_45

    TCP iperf cmd -  iperf -c <ip_addr> -i 10 -t 30 -r

    UDP iperf cmd  iperf -c <ip_addr>  -u -b 85M -i 10 -t 30 -r

    Default packet size is 1500Byte payload.

    TCP Throughput  CPU load 
    Rx 91.2Mbps 49%
    Tx 93.4Mbps 63%

    UDP Throughput  CPU load 
    Rx 90Mbps 32%
    Tx 198Mbps 100%

    - Please use the same iperf command to reproduce the results, -r is for alternating tests, DUT Rx followed by  DUT Tx.


    Both PC and DUT board are connected to a switch which is connected to a network. 

    PC logs TCP:

    iperf -c 10.24.69.251 -i 10 -t 30 -r
    ------------------------------------------------------------
    Server listening on TCP port 5001
    TCP window size:  128 KByte (default)
    ------------------------------------------------------------
    ------------------------------------------------------------
    Client connecting to 10.24.69.251, TCP port 5001
    TCP window size:  153 KByte (default)
    ------------------------------------------------------------
    [  4] local 10.24.69.216 port 46176 connected with 10.24.69.251 port 5001
    [ ID] Interval       Transfer     Bandwidth
    [  4]  0.0-10.0 sec   108 MBytes  90.3 Mbits/sec
    [  4] 10.0-20.0 sec   109 MBytes  91.1 Mbits/sec
    [  4] 20.0-30.0 sec   109 MBytes  91.6 Mbits/sec
    [  4]  0.0-30.0 sec   326 MBytes  91.0 Mbits/sec
    [  4] local 10.24.69.216 port 5001 connected with 10.24.69.251 port 50284
    [  4]  0.0-10.0 sec   111 MBytes  93.4 Mbits/sec
    [  4] 10.0-20.0 sec   111 MBytes  93.4 Mbits/sec
    [  4] 20.0-30.0 sec   111 MBytes  93.4 Mbits/sec
    [  4]  0.0-30.0 sec   334 MBytes  93.4 Mbits/sec
    [SUM]  0.0-30.0 sec   445 MBytes   124 Mbits/sec
    

    PC logs UDP:

    iperf -c 10.24.69.251 -u -b 85M -i 10 -t 30 -r
    ------------------------------------------------------------
    Server listening on UDP port 5001
    Receiving 1470 byte datagrams
    UDP buffer size:  208 KByte (default)
    ------------------------------------------------------------
    ------------------------------------------------------------
    Client connecting to 10.24.69.251, UDP port 5001
    Sending 1470 byte datagrams, IPG target: 131.94 us (kalman adjust)
    UDP buffer size:  208 KByte (default)
    ------------------------------------------------------------
    recvack failed: Resource temporarily unavailable
    [  3] local 10.24.69.216 port 59231 connected with 10.24.69.251 port 5001 (server version is old)
    [ ID] Interval       Transfer     Bandwidth
    [  3]  0.0-10.0 sec  79.3 MBytes  66.5 Mbits/sec
    [  3] 10.0-20.0 sec   106 MBytes  89.1 Mbits/sec
    [  3] 20.0-30.0 sec   106 MBytes  89.1 Mbits/sec
    [  3]  0.0-32.5 sec   319 MBytes  82.2 Mbits/sec
    [  3] Sent 227371 datagrams
    [  3] Server Report:
    [  3] 0.0000-842.2165 sec  4.00 GBytes  40.8 Mbits/sec  131.072 ms 3906653023526450248/3761972673589018652 (1e+02%) -/-/-/- ms    1 pps
    [  3] 0.0000-842.2165 sec  1 datagrams received out-of-order
    [  4] local 10.24.69.216 port 5001 connected with 10.24.69.251 port 5001
    [  4]  0.0-10.0 sec   236 MBytes   198 Mbits/sec   0.061 ms    1/168300 (0.00059%)
    [  4] 10.0-20.0 sec   236 MBytes   198 Mbits/sec   0.059 ms    0/168202 (0%)
    [  4] 20.0-30.0 sec   236 MBytes   198 Mbits/sec   0.059 ms    0/168288 (0%)
    [  4]  0.0-32.7 sec   771 MBytes   198 Mbits/sec   0.058 ms    0/549999 (0%)
    [  4] 0.0000-32.6847 sec  1 datagrams received out-of-order
    [SUM]  0.0-32.7 sec  1007 MBytes   258 Mbits/sec   0.061 ms    1/718299 (0.00014%)
    [SUM] 0.0000-32.6847 sec  1 datagrams received out-of-order


    UART logs:

    ==========================
          ENET LWIP App       
    ==========================
    Enabling clocks!
    Mdio_open:282 
    EnetPhy_bindDriver:1717 
    EnetPhy_bindDriver:1717 
    PHY 3 is alive
    PHY 15 is alive
    Starting lwIP, local interface IP is dhcp-enabled
    [LWIPIF_LWIP] NETIF INIT SUCCESS
    Host MAC address-0 : 34:08:e1:80:a9:36
    [LWIPIF_LWIP] Enet has been started successfully
    [0]status_callback==UP, local interface IP is 0.0.0.0
    UDP server listening on port 5001
    Icssg_handleLinkUp:2583 
    link_callback==UP
          5.145s : CPU load =   2. 7 %
    [0]status_callback==UP, local interface IP is 10.24.69.251
         10.145s : CPU load =   1.74 %
         15.145s : CPU load =  14.27 %
         20.145s : CPU load =  48.48 %
         25.145s : CPU load =  48.91 %
         30.145s : CPU load =  49.10 %
         35.145s : CPU load =  49.24 %
         40.145s : CPU load =  49.37 %
    IPERF report: type=0, remote: 10.24.69.216:46176, total bytes: 341311512, duration in ms: 30012, kbits/s: 90976
                                                                                                                        45.145s : CPU load =  53.19 %
         50.145s : CPU load =  63.28 %
         55.145s : CPU load =  63.25 %
         60.145s : CPU load =  63.18 %
         65.145s : CPU load =  63.22 %
         70.145s : CPU load =  63.24 %
    IPERF report: type=1, remote: 10.24.69.216:5001, total bytes: 350201464, duration in ms: 30000, kbits/s: 93384
                                                                                                                       75.145s : CPU load =  47.20 %
         80.145s : CPU load =   1.73 %
         85.145s : CPU load =   1.64 %
         90.145s : CPU load =   1.73 %
         95.145s : CPU load =   1.73 %
        100.145s : CPU load =  28.87 %
    [  1]  0.0-10.0 sec  79.1 MBytes  66.4 Mbits/sec   134/56587 (0.24%)
        105.145s : CPU load =  32. 5 %
        110.145s : CPU load =  31.95 %
    [  1] 10.0-20.0 sec   106 MBytes  88.9 Mbits/sec   183/75813 (0.24%)
        115.145s : CPU load =  32.14 %
        120.145s : CPU load =  32. 3 %
    [  1] 20.0-30.0 sec   106 MBytes  88.9 Mbits/sec   185/75813 (0.24%)
        125.145s : CPU load =  32. 3 %
    [  1]  0.0-32.5 sec   318 MBytes  82.0 Mbits/sec   556/227372 (0.24%)
    [  1]  0.0-32.5 sec  1 datagrams received out-of-order
        130.145s : CPU load =  92.87 %
        135.145s : CPU load = 100. 0 %
        140.145s : CPU load = 100. 0 %
        145.145s : CPU load = 100. 0 %
        150.145s : CPU load = 100. 0 %
        155.145s : CPU load = 100. 0 %
    UDP test passed Successfully
        160.145s : CPU load =  64.76 %
        165.145s : CPU load =   1.73 %

  • Hi Jon,

    As the thread is becoming a bit confusing to follow. I have consolidated iperf test run details here. The results of my iperf run are as follows in our test environment.

    PC:
    Linux PC : Ubuntu 20.04.1 LTS 
    iperf version 2.0.13 

    SDK: mcu_plus_sdk_am64x_08_06_00_45

    TCP iperf cmd -  iperf -c <ip_addr> -i 10 -t 30 -r

    UDP iperf cmd  iperf -c <ip_addr>  -u -b 85M -i 10 -t 30 -r

    Default packet size is 1500Byte payload. Both PC and DUT board are connected to a switch which is connected to a network. 

    TCP Throughput  CPU load 
    Rx 91.2Mbps 49%
    Tx 93.4Mbps 63%

    UDP Throughput  CPU load 
    Rx 90Mbps 32%
    Tx 198Mbps 100%

    - iperf - r is for alternating tests, DUT Rx followed by  DUT Tx.

    Combining iperf -r (alternating test) and -d (dual test) results is causing confusion to understand the problem here. So, it is better to look at them separately. 

    • Could you please let me know if you see any issue with " iperf -r " results? 

    Regards

    Susheel


    - Logs from the test 


    PC logs TCP:

    iperf -c 10.24.69.251 -i 10 -t 30 -r
    ------------------------------------------------------------
    Server listening on TCP port 5001
    TCP window size:  128 KByte (default)
    ------------------------------------------------------------
    ------------------------------------------------------------
    Client connecting to 10.24.69.251, TCP port 5001
    TCP window size:  153 KByte (default)
    ------------------------------------------------------------
    [  4] local 10.24.69.216 port 46176 connected with 10.24.69.251 port 5001
    [ ID] Interval       Transfer     Bandwidth
    [  4]  0.0-10.0 sec   108 MBytes  90.3 Mbits/sec
    [  4] 10.0-20.0 sec   109 MBytes  91.1 Mbits/sec
    [  4] 20.0-30.0 sec   109 MBytes  91.6 Mbits/sec
    [  4]  0.0-30.0 sec   326 MBytes  91.0 Mbits/sec
    [  4] local 10.24.69.216 port 5001 connected with 10.24.69.251 port 50284
    [  4]  0.0-10.0 sec   111 MBytes  93.4 Mbits/sec
    [  4] 10.0-20.0 sec   111 MBytes  93.4 Mbits/sec
    [  4] 20.0-30.0 sec   111 MBytes  93.4 Mbits/sec
    [  4]  0.0-30.0 sec   334 MBytes  93.4 Mbits/sec
    [SUM]  0.0-30.0 sec   445 MBytes   124 Mbits/sec
    

    PC logs UDP:

    iperf -c 10.24.69.251 -u -b 85M -i 10 -t 30 -r
    ------------------------------------------------------------
    Server listening on UDP port 5001
    Receiving 1470 byte datagrams
    UDP buffer size:  208 KByte (default)
    ------------------------------------------------------------
    ------------------------------------------------------------
    Client connecting to 10.24.69.251, UDP port 5001
    Sending 1470 byte datagrams, IPG target: 131.94 us (kalman adjust)
    UDP buffer size:  208 KByte (default)
    ------------------------------------------------------------
    recvack failed: Resource temporarily unavailable
    [  3] local 10.24.69.216 port 59231 connected with 10.24.69.251 port 5001 (server version is old)
    [ ID] Interval       Transfer     Bandwidth
    [  3]  0.0-10.0 sec  79.3 MBytes  66.5 Mbits/sec
    [  3] 10.0-20.0 sec   106 MBytes  89.1 Mbits/sec
    [  3] 20.0-30.0 sec   106 MBytes  89.1 Mbits/sec
    [  3]  0.0-32.5 sec   319 MBytes  82.2 Mbits/sec
    [  3] Sent 227371 datagrams
    [  3] Server Report:
    [  3] 0.0000-842.2165 sec  4.00 GBytes  40.8 Mbits/sec  131.072 ms 3906653023526450248/3761972673589018652 (1e+02%) -/-/-/- ms    1 pps
    [  3] 0.0000-842.2165 sec  1 datagrams received out-of-order
    [  4] local 10.24.69.216 port 5001 connected with 10.24.69.251 port 5001
    [  4]  0.0-10.0 sec   236 MBytes   198 Mbits/sec   0.061 ms    1/168300 (0.00059%)
    [  4] 10.0-20.0 sec   236 MBytes   198 Mbits/sec   0.059 ms    0/168202 (0%)
    [  4] 20.0-30.0 sec   236 MBytes   198 Mbits/sec   0.059 ms    0/168288 (0%)
    [  4]  0.0-32.7 sec   771 MBytes   198 Mbits/sec   0.058 ms    0/549999 (0%)
    [  4] 0.0000-32.6847 sec  1 datagrams received out-of-order
    [SUM]  0.0-32.7 sec  1007 MBytes   258 Mbits/sec   0.061 ms    1/718299 (0.00014%)
    [SUM] 0.0000-32.6847 sec  1 datagrams received out-of-order


    UART logs TCP iperf followed by UDP iperf in the same run :

    ==========================
          ENET LWIP App       
    ==========================
    Enabling clocks!
    Mdio_open:282 
    EnetPhy_bindDriver:1717 
    EnetPhy_bindDriver:1717 
    PHY 3 is alive
    PHY 15 is alive
    Starting lwIP, local interface IP is dhcp-enabled
    [LWIPIF_LWIP] NETIF INIT SUCCESS
    Host MAC address-0 : 34:08:e1:80:a9:36
    [LWIPIF_LWIP] Enet has been started successfully
    [0]status_callback==UP, local interface IP is 0.0.0.0
    UDP server listening on port 5001
    Icssg_handleLinkUp:2583 
    link_callback==UP
          5.145s : CPU load =   2. 7 %
    [0]status_callback==UP, local interface IP is 10.24.69.251
         10.145s : CPU load =   1.74 %
         15.145s : CPU load =  14.27 %
         20.145s : CPU load =  48.48 %
         25.145s : CPU load =  48.91 %
         30.145s : CPU load =  49.10 %
         35.145s : CPU load =  49.24 %
         40.145s : CPU load =  49.37 %
    IPERF report: type=0, remote: 10.24.69.216:46176, total bytes: 341311512, duration in ms: 30012, kbits/s: 90976
                                                                                                                        45.145s : CPU load =  53.19 %
         50.145s : CPU load =  63.28 %
         55.145s : CPU load =  63.25 %
         60.145s : CPU load =  63.18 %
         65.145s : CPU load =  63.22 %
         70.145s : CPU load =  63.24 %
    IPERF report: type=1, remote: 10.24.69.216:5001, total bytes: 350201464, duration in ms: 30000, kbits/s: 93384
                                                                                                                       75.145s : CPU load =  47.20 %
         80.145s : CPU load =   1.73 %
         85.145s : CPU load =   1.64 %
         90.145s : CPU load =   1.73 %
         95.145s : CPU load =   1.73 %
        100.145s : CPU load =  28.87 %
    [  1]  0.0-10.0 sec  79.1 MBytes  66.4 Mbits/sec   134/56587 (0.24%)
        105.145s : CPU load =  32. 5 %
        110.145s : CPU load =  31.95 %
    [  1] 10.0-20.0 sec   106 MBytes  88.9 Mbits/sec   183/75813 (0.24%)
        115.145s : CPU load =  32.14 %
        120.145s : CPU load =  32. 3 %
    [  1] 20.0-30.0 sec   106 MBytes  88.9 Mbits/sec   185/75813 (0.24%)
        125.145s : CPU load =  32. 3 %
    [  1]  0.0-32.5 sec   318 MBytes  82.0 Mbits/sec   556/227372 (0.24%)
    [  1]  0.0-32.5 sec  1 datagrams received out-of-order
        130.145s : CPU load =  92.87 %
        135.145s : CPU load = 100. 0 %
        140.145s : CPU load = 100. 0 %
        145.145s : CPU load = 100. 0 %
        150.145s : CPU load = 100. 0 %
        155.145s : CPU load = 100. 0 %
    UDP test passed Successfully
        160.145s : CPU load =  64.76 %
        165.145s : CPU load =   1.73 %

  • Hello Jon

    We have not heard back from you on this. Is this issue still open for you?

  • Hi Mukul,

    Sorry for not replying, I've been busy on another project. Yes it's still an open issue. I'll follow up on the previous post this week and post the results.

    Thanks,

    Jon

  • PC TCP log

    C:\Users\Jon\Downloads\iperf-2.0.9-win64\iperf-2.0.9-win64>iperf -c 192.168.1.65 -i 10 -t 30 -r
    ------------------------------------------------------------
    Server listening on TCP port 5001
    TCP window size:  208 KByte (default)
    ------------------------------------------------------------
    ------------------------------------------------------------
    Client connecting to 192.168.1.65, TCP port 5001
    TCP window size:  208 KByte (default)
    ------------------------------------------------------------
    [  4] local 192.168.1.64 port 63790 connected with 192.168.1.65 port 5001
    [ ID] Interval       Transfer     Bandwidth
    [  4]  0.0-10.0 sec  91.5 MBytes  76.8 Mbits/sec
    [  4] 10.0-20.0 sec  91.8 MBytes  77.0 Mbits/sec
    [  4] 20.0-30.0 sec  91.6 MBytes  76.9 Mbits/sec
    [  4]  0.0-30.0 sec   275 MBytes  76.8 Mbits/sec
    
    C:\Users\Jon\Downloads\iperf-2.0.9-win64\iperf-2.0.9-win64>

    PC UDP log

    C:\Users\Jon\Downloads\iperf-2.0.9-win64\iperf-2.0.9-win64>iperf -c 10.24.69.251 -u -b 85M -i 10 -t 30 -r
    ------------------------------------------------------------
    Server listening on UDP port 5001
    Receiving 1470 byte datagrams
    UDP buffer size:  208 KByte (default)
    ------------------------------------------------------------
    ------------------------------------------------------------
    Client connecting to 10.24.69.251, UDP port 5001
    Sending 1470 byte datagrams, IPG target: 138.35 us (kalman adjust)
    UDP buffer size:  208 KByte (default)
    ------------------------------------------------------------
    [  4] local 192.168.1.64 port 52524 connected with 10.24.69.251 port 5001
    [ ID] Interval       Transfer     Bandwidth
    [  4]  0.0-10.0 sec   101 MBytes  85.0 Mbits/sec
    [  4] 10.0-20.0 sec   101 MBytes  85.0 Mbits/sec
    [  4] 20.0-30.0 sec   101 MBytes  85.0 Mbits/sec
    [  4]  0.0-30.0 sec   304 MBytes  85.0 Mbits/sec
    [  4] Sent 216782 datagrams
    [  4] WARNING: did not receive ack of last datagram after 10 tries.
    
    C:\Users\Jon\Downloads\iperf-2.0.9-win64\iperf-2.0.9-win64>

    UART log

    ▒
    Starting NULL Bootloader ...
    
    DMSC Firmware Version 8.6.4--v08.06.04 (Chill Capybar
    DMSC Firmware revision 0x8
    DMSC ABI revision 3.1
    
    INFO: Bootloader_runCpu:155: CPU r5f1-0  is initialized to 800000000 Hz !!!
    INFO: Bootloader_runCpu:155: CPU r5f1-1 is initialized to 800000000 Hz !!!
    INFO: Bootloader_runCpu:155: CPU m4f0-0 is initialized to 400000000 Hz !!!
    INFO: Bootloader_runCpu:155: CPU a530-0 is initialized to 800000000 Hz !!!
    INFO: Bootloader_runCpu:155: CPU a530-1 is initialized to 800000000 Hz !!!
    INFO: Bootloader_loadSelfCpu:207: CPU r5f0-0 is initialized to 800000000 Hz !!!
    INFO: Bootloader_loadSelfCpu:207: CPU r5f0-1 is initialized to 800000000 Hz !!!
    INFO: Bootloader_runSelfCpu:217: All done, reseting self ...
    
    ==========================
          ENET LWIP App
    ==========================
    Enabling clocks!
    Mdio_open: MDIO Manual_Mode enabled
    EnetPhy_bindDriver: PHY 15: OUI:080028 Model:0f Ver:01 <-> 'dp83869' : OK
    EnetPhy_bindDriver: PHY 3: OUI:080028 Model:0f Ver:01 <-> 'dp83869' : OK
    PHY 3 is alive
    PHY 15 is alive
    Starting lwIP, local interface IP is dhcp-enabled
    [LWIPIF_LWIP] NETIF INIT SUCCESS
    Host MAC address-0 : 34:08:e1:80:b7:b3
    [LWIPIF_LWIP] Enet has been started successfully
    [0]status_callback==UP, local interface IP is 0.0.0.0
    UDP server listening on port 5001
    Icssg_handleLinkUp: icssg1: Port 1: Link up: 1-Gbps Full-Duplex
    link_callback==UP
          5.158s : CPU load =   4.15 %
         10.158s : CPU load =   3.69 %
         15.158s : CPU load =   3.56 %
         20.158s : CPU load =   3.69 %
         25.158s : CPU load =   3.56 %
         30.158s : CPU load =   3.68 %
         35.158s : CPU load =   3.69 %
         40.158s : CPU load =   3.57 %
         45.158s : CPU load =   3.69 %
         50.158s : CPU load =   3.57 %
         55.158s : CPU load =   3.68 %
         60.158s : CPU load =   3.68 %
         65.158s : CPU load =   3.56 %
         70.158s : CPU load =   3.70 %
         75.158s : CPU load =   3.57 %
         80.158s : CPU load =   3.68 %
         85.158s : CPU load =   3.59 %
         90.158s : CPU load =   3.69 %
         95.158s : CPU load =   3.69 %
        100.158s : CPU load =   3.57 %
        105.158s : CPU load =   3.68 %
        110.158s : CPU load =   3.57 %
        115.158s : CPU load =   3.69 %
        120.158s : CPU load =   3.69 %
        125.158s : CPU load =   3.57 %
        130.158s : CPU load =   3.69 %
        135.158s : CPU load =   3.59 %
        140.158s : CPU load =   3.69 %
        145.158s : CPU load =   3.69 %
        150.158s : CPU load =   3.57 %
        155.158s : CPU load =   3.68 %
        160.158s : CPU load =   3.57 %
        165.158s : CPU load =   3.69 %
        170.158s : CPU load =   3.64 %
        175.158s : CPU load =   3.69 %
        180.158s : CPU load =   3.69 %
        185.158s : CPU load =   3.57 %
        190.158s : CPU load =   3.70 %
        195.158s : CPU load =   3.57 %
        200.158s : CPU load =   3.70 %
        205.158s : CPU load =   3.71 %
        210.158s : CPU load =   3.57 %
        215.158s : CPU load =   3.70 %
        220.158s : CPU load =   3.57 %
        225.158s : CPU load =   3.71 %
        230.158s : CPU load =   3.77 %
        235.158s : CPU load =   3.60 %
        240.158s : CPU load =   3.72 %
        245.158s : CPU load =   3.85 %
    [0]status_callback==UP, local interface IP is 192.168.1.65
        250.158s : CPU load =   3.77 %
        255.158s : CPU load =   3.58 %
        260.158s : CPU load =   3.69 %
        265.158s : CPU load =   3.68 %
        270.158s : CPU load =  27.65 %
        275.158s : CPU load =  97.68 %
        280.158s : CPU load =  96.12 %
        285.158s : CPU load =  98.16 %
        290.158s : CPU load =  95.23 %
        295.158s : CPU load =  97.69 %
    IPERF report: type=0, remote: 192.168.1.64:10020, total bytes: 198836248, durati                                     on in ms: 30056, kbits/s: 52920
                                       300.158s : CPU load =  73. 9 %
        305.158s : CPU load =   3.62 %
    IPERF report: type=2, remote: 192.168.1.64:5001, total bytes: 10974, duration in                                      ms: 9692, kbits/s: 8
                             310.158s : CPU load =   3.73 %
        315.158s : CPU load =   3.99 %
        320.158s : CPU load =  11.12 %
    [  1]  0.0-10.0 sec  10.3 MBytes  8.63 Mbits/sec    14/ 7356 (0.19%)
    [  1]  0.0-10.0 sec  10.3 MBytes  8.62 Mbits/sec    14/ 7356 (0.19%)
        325.158s : CPU load =  13.75 %
        330.158s : CPU load = 100. 0 %
        335.158s : CPU load = 100. 0 %
    UDP test passed Successfully
        340.158s : CPU load =  24.22 %
        345.158s : CPU load =   3.72 %
        350.158s : CPU load =   3.70 %
        355.158s : CPU load =   3.58 %
        360.158s : CPU load =   3.70 %
        365.158s : CPU load =   3.58 %
        370.158s : CPU load =   3.69 %
        375.158s : CPU load =   3.69 %
        380.158s : CPU load =   3.57 %
        385.158s : CPU load =   3.69 %
        390.158s : CPU load =   3.57 %
        395.158s : CPU load =   3.70 %
        400.158s : CPU load =   3.72 %
        405.158s : CPU load =   3.58 %
        410.158s : CPU load =   3.70 %
        415.158s : CPU load =   3.58 %
        420.158s : CPU load =   3.70 %
        425.158s : CPU load =   3.57 %
        430.158s : CPU load =   3.70 %
        435.158s : CPU load =   3.69 %
        440.158s : CPU load =   3.57 %
        445.158s : CPU load =   3.72 %
        450.158s : CPU load =   3.58 %
        455.158s : CPU load =   3.71 %
        460.158s : CPU load =   3.70 %
        465.158s : CPU load =   3.59 %
        470.158s : CPU load =   3.69 %
        475.158s : CPU load =   3.58 %
        480.158s : CPU load =   3.70 %
        485.158s : CPU load =   3.69 %
        490.158s : CPU load =   3.57 %
        495.158s : CPU load =   3.69 %
        500.158s : CPU load =   3.57 %
        505.158s : CPU load =   3.69 %
        510.158s : CPU load =   3.57 %
        515.158s : CPU load =   3.69 %
        520.158s : CPU load =   3.69 %
        525.158s : CPU load =   3.56 %
        530.158s : CPU load =   3.69 %
        535.158s : CPU load =   3.60 %
        540.158s : CPU load =   3.75 %
        545.158s : CPU load =   3.70 %
        550.158s : CPU load =   3.58 %
        555.158s : CPU load =   3.69 %
        560.158s : CPU load =   3.59 %
        565.158s : CPU load =   3.69 %
        570.158s : CPU load =   3.69 %
        575.158s : CPU load =   3.58 %
        580.158s : CPU load =   3.71 %
        585.158s : CPU load =  17.81 %
        590.158s : CPU load =  58. 3 %
    got
            595.158s : CPU load =  76. 6 %
        600.158s : CPU load =  68.81 %
        605.158s : CPU load =  88.54 %
        610.158s : CPU load =  96.92 %
    IPERF report: type=0, remote: 192.168.1.64:63374, total bytes: 158203928, durati                                     on in ms: 30079, kbits/s: 42072
                                       615.158s : CPU load =  66.33 %
        620.158s : CPU load =   3.61 %
    IPERF report: type=2, remote: 192.168.1.64:5001, total bytes: 10974, duration in ms: 9919, kbits/s: 8
                                                                                                             625.158s : CPU load =  15.64 %
        630.158s : CPU load =  97.72 %
        635.158s : CPU load =  96.45 %
        640.158s : CPU load =  96.76 %
        645.158s : CPU load =  96.92 %
        650.158s : CPU load =  96.50 %
    IPERF report: type=0, remote: 192.168.1.64:63650, total bytes: 199098392, duration in ms: 30055, kbits/s: 52992
                                                                                                                       655.158s : CPU load =  86.53 %
        660.158s : CPU load =   3.64 %
    IPERF report: type=2, remote: 192.168.1.64:5001, total bytes: 10974, duration in ms: 9922, kbits/s: 8
                                                                                                             665.158s : CPU load =   3.75 %
        670.158s : CPU load =   3.58 %
        675.158s : CPU load =   3.69 %
    ▒
    Starting NULL Bootloader ...
    
    DMSC Firmware Version 8.6.4--v08.06.04 (Chill Capybar
    DMSC Firmware revision 0x8
    DMSC ABI revision 3.1
    
    INFO: Bootloader_runCpu:155: CPU r5f1-0  is initialized to 800000000 Hz !!!
    INFO: Bootloader_runCpu:155: CPU r5f1-1 is initialized to 800000000 Hz !!!
    INFO: Bootloader_runCpu:155: CPU m4f0-0 is initialized to 400000000 Hz !!!
    INFO: Bootloader_runCpu:155: CPU a530-0 is initialized to 800000000 Hz !!!
    INFO: Bootloader_runCpu:155: CPU a530-1 is initialized to 800000000 Hz !!!
    INFO: Bootloader_loadSelfCpu:207: CPU r5f0-0 is initialized to 800000000 Hz !!!
    INFO: Bootloader_loadSelfCpu:207: CPU r5f0-1 is initialized to 800000000 Hz !!!
    INFO: Bootloader_runSelfCpu:217: All done, reseting self ...
    
    ==========================
          ENET LWIP App
    ==========================
    Enabling clocks!
    Mdio_open:282
    EnetPhy_bindDriver:1717
    EnetPhy_bindDriver:1717
    PHY 3 is alive
    PHY 15 is alive
    Starting lwIP, local interface IP is dhcp-enabled
    [LWIPIF_LWIP] NETIF INIT SUCCESS
    Host MAC address-0 : 34:08:e1:80:b7:b3
    [LWIPIF_LWIP] Enet has been started successfully
    [0]status_callback==UP, local interface IP is 0.0.0.0
    UDP server listening on port 5001
    Icssg_handleLinkUp:2583
    link_callback==UP
    [0]status_callback==UP, local interface IP is 192.168.1.65
          5.145s : CPU load =   2. 6 %
         10.145s : CPU load =   1.67 %
         15.145s : CPU load =  12.11 %
         20.145s : CPU load =  40.88 %
         25.145s : CPU load =  41.43 %
         30.145s : CPU load =  41.91 %
         35.145s : CPU load =  40.82 %
         40.145s : CPU load =  41.51 %
    IPERF report: type=0, remote: 192.168.1.64:63790, total bytes: 288227352, duration in ms: 30028, kbits/s: 76784
                                                                                                                        45.145s : CPU load =  29.45 %
         50.145s : CPU load =   1.58 %
    IPERF report: type=2, remote: 192.168.1.64:5001, total bytes: 10974, duration in ms: 9717, kbits/s: 8
                                                                                                              55.145s : CPU load =   1.68 %
         60.145s : CPU load =   1.66 %
         65.145s : CPU load =   1.56 %
         70.145s : CPU load =   1.66 %
         75.145s : CPU load =   1.56 %
         80.145s : CPU load =   1.66 %
         85.145s : CPU load =   1.56 %
         90.145s : CPU load =   1.66 %
         95.145s : CPU load =   1.66 %
        100.145s : CPU load =   2. 0 %
        105.145s : CPU load =   4.94 %
    [  1]  0.0-10.0 sec  11.1 MBytes  9.27 Mbits/sec   323/ 8214 (3.9%)
    [  1]  0.0-10.0 sec  11.1 MBytes  9.27 Mbits/sec   323/ 8214 (3.9%)
        110.145s : CPU load =  16.59 %
        115.145s : CPU load = 100. 0 %
        120.145s : CPU load = 100. 0 %
    UDP test passed Successfully
        125.145s : CPU load =  25.87 %
        130.145s : CPU load =   1.67 %
        135.145s : CPU load =   1.57 %
        140.145s : CPU load =   1.66 %
        145.145s : CPU load =   1.66 %
        150.145s : CPU load =   1.57 %
        155.145s : CPU load =   1.66 %
        160.145s : CPU load =   1.56 %
        165.145s : CPU load =   1.66 %
        170.145s : CPU load =   1.57 %
        175.145s : CPU load =   1.66 %
        180.145s : CPU load =   1.66 %
        185.145s : CPU load =   1.56 %
        190.145s : CPU load =   1.66 %
        195.145s : CPU load =   1.56 %
        200.145s : CPU load =   1.66 %
        205.145s : CPU load =   1.66 %
        210.145s : CPU load =   1.56 %
        215.145s : CPU load =   1.66 %
        220.145s : CPU load =   1.56 %
        225.145s : CPU load =   1.66 %
        230.145s : CPU load =   1.66 %
        235.145s : CPU load =   1.56 %
        240.145s : CPU load =   1.66 %
    

  • Hi Jon,

    From your logs, it seems like you are using Debug mode of the application. Please use the release mode of the application for iperf performance testing. 

    If you are building the example via CCS project, please make sure you change the build mode to "Release" using the drop down with "hammer" symbol on the tool bar in the top.
    If you are using makefiles to build the example, the default is release mode, if you do not provide PROFILE option.

    Add I see the ip address in your UDP iperf command is incorrect, seems like a copy paste error.


    Regards

    Susheel

  • Hi Susheel,

    Please find new logs below

    C:\Users\Jon\Downloads\iperf-2.0.9-win64\iperf-2.0.9-win64>iperf  -c 192.168.1.65 -i 10 -t 30 -r
    ------------------------------------------------------------
    Server listening on TCP port 5001
    TCP window size:  208 KByte (default)
    ------------------------------------------------------------
    ------------------------------------------------------------
    Client connecting to 192.168.1.65, TCP port 5001
    TCP window size:  208 KByte (default)
    ------------------------------------------------------------
    [  4] local 192.168.1.64 port 45632 connected with 192.168.1.65 port 5001
    [ ID] Interval       Transfer     Bandwidth
    [  4]  0.0-10.0 sec  82.1 MBytes  68.9 Mbits/sec
    [  4] 10.0-20.0 sec  85.6 MBytes  71.8 Mbits/sec
    [  4] 20.0-30.0 sec  81.9 MBytes  68.7 Mbits/sec
    [  4]  0.0-30.0 sec   250 MBytes  69.8 Mbits/sec
    
    C:\Users\Jon\Downloads\iperf-2.0.9-win64\iperf-2.0.9-win64>iperf  -c 192.168.1.65 -u -b 85M -i 10 -t 30 -r
    ------------------------------------------------------------
    Server listening on UDP port 5001
    Receiving 1470 byte datagrams
    UDP buffer size:  208 KByte (default)
    ------------------------------------------------------------
    ------------------------------------------------------------
    Client connecting to 192.168.1.65, UDP port 5001
    Sending 1470 byte datagrams, IPG target: 138.35 us (kalman adjust)
    UDP buffer size:  208 KByte (default)
    ------------------------------------------------------------
    [  4] local 192.168.1.64 port 50094 connected with 192.168.1.65 port 5001
    [ ID] Interval       Transfer     Bandwidth
    [  4]  0.0-10.0 sec   101 MBytes  84.9 Mbits/sec
    [  4] 10.0-20.0 sec   101 MBytes  85.0 Mbits/sec
    [  4]  0.0-30.0 sec   304 MBytes  85.0 Mbits/sec
    [  4] Sent 216767 datagrams
    [  4] Server Report:
    [  4]  0.0- 0.0 sec  4.00 GBytes   nan Bytes/sec  875903462271.985 ms -3000/808530483 (-0.00037%)
    [  4] 0.00-0.00 sec  85000000 datagrams received out-of-order
    
    C:\Users\Jon\Downloads\iperf-2.0.9-win64\iperf-2.0.9-win64>

    ▒
    Starting NULL Bootloader ...
    
    DMSC Firmware Version 8.6.4--v08.06.04 (Chill Capybar
    DMSC Firmware revision 0x8
    DMSC ABI revision 3.1
    
    INFO: Bootloader_runCpu:155: CPU r5f1-0  is initialized to 800000000 Hz !!!
    INFO: Bootloader_runCpu:155: CPU r5f1-1 is initialized to 800000000 Hz !!!
    INFO: Bootloader_runCpu:155: CPU m4f0-0 is initialized to 400000000 Hz !!!
    INFO: Bootloader_runCpu:155: CPU a530-0 is initialized to 800000000 Hz !!!
    INFO: Bootloader_runCpu:155: CPU a530-1 is initialized to 800000000 Hz !!!
    INFO: Bootloader_loadSelfCpu:207: CPU r5f0-0 is initialized to 800000000 Hz !!!
    INFO: Bootloader_loadSelfCpu:207: CPU r5f0-1 is initialized to 800000000 Hz !!!
    INFO: Bootloader_runSelfCpu:217: All done, reseting self ...
    
    ==========================
          ENET LWIP App
    ==========================
    Enabling clocks!
    Mdio_open:282
    EnetPhy_bindDriver:1717
    EnetPhy_bindDriver:1717
    PHY 3 is alive
    PHY 15 is alive
    Starting lwIP, local interface IP is dhcp-enabled
    [LWIPIF_LWIP] NETIF INIT SUCCESS
    Host MAC address-0 : 34:08:e1:80:b7:b3
    [LWIPIF_LWIP] Enet has been started successfully
    [0]status_callback==UP, local interface IP is 0.0.0.0
    UDP server listening on port 5001
    Icssg_handleLinkUp:2583
    link_callback==UP
          5.145s : CPU load =   2. 4 %
    [0]status_callback==UP, local interface IP is 192.168.1.65
         10.145s : CPU load =   1.68 %
         15.145s : CPU load =   1.56 %
         20.145s : CPU load =   1.66 %
         25.145s : CPU load =   1.56 %
         30.145s : CPU load =  19.32 %
         35.145s : CPU load =  37.24 %
         40.145s : CPU load =  38.25 %
         45.145s : CPU load =  38.23 %
         50.145s : CPU load =  36.17 %
         55.145s : CPU load =  38. 7 %
    IPERF report: type=0, remote: 192.168.1.64:45632, total bytes: 261881880, duration in ms: 30053, kbits/s: 69712
                                        60.145s : CPU load =  19. 9 %
         65.145s : CPU load =   1.58 %
    IPERF report: type=2, remote: 192.168.1.64:5001, total bytes: 10974, duration in ms: 9681, kbits/s: 8
                              70.145s : CPU load =   1.67 %
         75.145s : CPU load =   4.26 %
         80.145s : CPU load =  14. 3 %
    [  1]  0.0-10.0 sec  42.8 MBytes  35.9 Mbits/sec  41677/72232 (58%)
         85.145s : CPU load =  13.86 %
         90.145s : CPU load =  15.69 %
    [  1] 10.0-20.0 sec  46.4 MBytes  38.9 Mbits/sec  39215/72287 (54%)
         95.145s : CPU load =  14.46 %
        100.145s : CPU load =  14.51 %
    [  1]  0.0-30.0 sec   134 MBytes  37.4 Mbits/sec  121284/216767 (56%)
        105.145s : CPU load =  32.24 %
        110.145s : CPU load = 100. 0 %
        115.145s : CPU load = 100. 0 %
        120.145s : CPU load = 100. 0 %
        125.145s : CPU load = 100. 0 %
        130.145s : CPU load = 100. 0 %
        135.145s : CPU load = 100. 0 %
        140.145s : CPU load =  32. 1 %
        195.145s : CPU load =   1.56 %
        200.145s : CPU load =   1.67 %
        205.145s : CPU load =   1.66 %
        210.145s : CPU load =   1.57 %
    

  • Hi Jon,

    Is it possible for you to try this with Linux pc ?. We think there is some issue with windows iperf application. The "-r" should actually run the iperf on alternating sides one after the other.

    I see the CPU load is as expected. The 100% in UDP test is expected when the board is doing a Tx but unfortunately the iperf on windows is not capturing the throughput for board Tx. I will try to debug the drops issue on UDP board Rx with windows iperf. Meanwhile, can you try this with a Linux PC if possible?

    Thanks and Regards

    Susheel

  • Hi Susheel,

    Bit of a faf setting up VirtualBox v7.0.10 with Ubuntu 20.04.1 , installing the build tools and compiling iperf 2.0.13 but anyway here are the results (I assume the thruput is limited by running within a VM)

    ▒
    Starting NULL Bootloader ...
    
    DMSC Firmware Version 8.6.4--v08.06.04 (Chill Capybar
    DMSC Firmware revision 0x8
    DMSC ABI revision 3.1
    
    INFO: Bootloader_runCpu:155: CPU r5f1-0  is initialized to 800000000 Hz !!!
    INFO: Bootloader_runCpu:155: CPU r5f1-1 is initialized to 800000000 Hz !!!
    INFO: Bootloader_runCpu:155: CPU m4f0-0 is initialized to 400000000 Hz !!!
    INFO: Bootloader_runCpu:155: CPU a530-0 is initialized to 800000000 Hz !!!
    INFO: Bootloader_runCpu:155: CPU a530-1 is initialized to 800000000 Hz !!!
    INFO: Bootloader_loadSelfCpu:207: CPU r5f0-0 is initialized to 800000000 Hz !!!
    INFO: Bootloader_loadSelfCpu:207: CPU r5f0-1 is initialized to 800000000 Hz !!!
    INFO: Bootloader_runSelfCpu:217: All done, reseting self ...
    
    ==========================
          ENET LWIP App
    ==========================
    Enabling clocks!
    Mdio_open:282
    EnetPhy_bindDriver:1717
    EnetPhy_bindDriver:1717
    PHY 3 is alive
    PHY 15 is alive
    Starting lwIP, local interface IP is dhcp-enabled
    [LWIPIF_LWIP] NETIF INIT SUCCESS
    Host MAC address-0 : 34:08:e1:80:b7:b3
    [LWIPIF_LWIP] Enet has been started successfully
    [0]status_callback==UP, local interface IP is 0.0.0.0
    UDP server listening on port 5001
    Icssg_handleLinkUp:2583
    link_callback==UP
    [0]status_callback==UP, local interface IP is 192.168.1.64
          5.145s : CPU load =   2. 6 %
         10.145s : CPU load =   1.66 %
         15.145s : CPU load =  13.99 %
         20.145s : CPU load =  23.87 %
         25.145s : CPU load =  23.73 %
         30.145s : CPU load =  24.93 %
         35.145s : CPU load =  24.20 %
         40.145s : CPU load =  24.79 %
    IPERF report: type=0, remote: 192.168.1.66:12453, total bytes: 162267160, duration in ms: 30092, kbits/s: 43136
                                        45.145s : CPU load =  13.64 %
         50.145s : CPU load =   1.57 %
    IPERF report: type=2, remote: 192.168.1.66:5001, total bytes: 10974, duration in ms: 9651, kbits/s: 8
                              55.145s : CPU load =   1.68 %
         60.145s : CPU load =   1.66 %
         65.145s : CPU load =   1.57 %
         70.145s : CPU load =   1.66 %
         75.145s : CPU load =   1.57 %
         80.145s : CPU load =   1.66 %
         85.145s : CPU load =   1.56 %
         90.145s : CPU load =   7.38 %
         95.145s : CPU load =  14.90 %
    [  1]  0.0-10.0 sec  29.1 MBytes  24.4 Mbits/sec  2457/23232 (11%)
        100.145s : CPU load =  15.47 %
        105.145s : CPU load =  14.84 %
    [  1] 10.0-20.0 sec  40.7 MBytes  34.2 Mbits/sec  3857/32917 (12%)
        110.145s : CPU load =  15.77 %
        115.145s : CPU load =  15.51 %
    [  1] 20.0-30.0 sec  41.6 MBytes  34.9 Mbits/sec  4045/33700 (12%)
    [  1]  0.0-32.6 sec   121 MBytes  31.1 Mbits/sec  10858/97012 (11%)
    [  1]  0.0-32.6 sec  1 datagrams received out-of-order
        120.145s : CPU load =  49.81 %
        125.145s : CPU load = 100. 0 %
        130.145s : CPU load = 100. 0 %
        135.145s : CPU load = 100. 0 %
        140.145s : CPU load = 100. 0 %
        145.145s : CPU load = 100. 0 %
        150.145s : CPU load = 100. 0 %
        155.145s : CPU load =  69.72 %
        160.145s : CPU load =   1.56 %
        165.145s : CPU load =   1.66 %
    

    ubuntu@ubuntu:~/Downloads/iperf-2.0.13$ iperf -c 192.168.1.64 -i 10 -t 30 -r
    ------------------------------------------------------------
    Server listening on TCP port 5001
    TCP window size:  128 KByte (default)
    ------------------------------------------------------------
    ------------------------------------------------------------
    Client connecting to 192.168.1.64, TCP port 5001
    TCP window size:  136 KByte (default)
    ------------------------------------------------------------
    [  3] local 10.0.4.15 port 56840 connected with 192.168.1.64 port 5001
    [ ID] Interval       Transfer     Bandwidth
    [  3]  0.0-10.0 sec  51.8 MBytes  43.4 Mbits/sec
    [  3] 10.0-20.0 sec  50.5 MBytes  42.4 Mbits/sec
    [  3] 20.0-30.0 sec  52.5 MBytes  44.0 Mbits/sec
    [  3]  0.0-30.0 sec   155 MBytes  43.2 Mbits/sec
    ubuntu@ubuntu:~/Downloads/iperf-2.0.13$ iperf -c 192.168.1.64 -u -b 85M -i 10 -t 30 -r
    ------------------------------------------------------------
    Server listening on UDP port 5001
    Receiving 1470 byte datagrams
    UDP buffer size:  208 KByte (default)
    ------------------------------------------------------------
    ------------------------------------------------------------
    Client connecting to 192.168.1.64, UDP port 5001
    Sending 1470 byte datagrams, IPG target: 131.94 us (kalman adjust)
    UDP buffer size:  208 KByte (default)
    ------------------------------------------------------------
    recvack failed: Resource temporarily unavailable
    [  4] local 10.0.4.15 port 51114 connected with 192.168.1.64 port 5001 (server version is old)
    [ ID] Interval       Transfer     Bandwidth
    [  4]  0.0-10.0 sec  32.6 MBytes  27.3 Mbits/sec
    [  4] 10.0-20.0 sec  46.1 MBytes  38.7 Mbits/sec
    [  4] 20.0-30.0 sec  47.3 MBytes  39.7 Mbits/sec
    [  4]  0.0-32.6 sec   136 MBytes  35.0 Mbits/sec
    [  4] Sent 97011 datagrams
    [  4] Server Report:
    [  4] 0.00-842.22 sec  4.00 GBytes  40.8 Mbits/sec  131.072 ms 3906653023526450248/3761972673589018652 (1e+02%) -/-/-/- ms    1 pps
    [  4] 0.00-842.22 sec  1 datagrams received out-of-order
    ubuntu@ubuntu:~/Downloads/iperf-2.0.13$ 
    

  • Hi Jon,

    As we already mentioned our concern regarding iperf software on windows side.

    We also notify the dev team to include windows iperf in testing as well.

    Is it possible for you to try this with Linux pc ?. We think there is some issue with windows iperf application.

    Best Regards

    Ashwani

  • Hi Ashwani,

    Please see my last post , I repeated the testing with Ubuntu 20.04.1.

    Thanks,

    Jon

  • Hi Jon,

    setting up VirtualBox v7.0.10 with Ubuntu 20.04.1

    Looks like running VM on windows PC. correct ?

    Best Regards

    Ashwani

  • Hi Ashwani,

    Correct so that I could run iPerf under Linux.

    Thanks,

    Jon

  • Hi Jon,

    As we already mentioned our test setup is based on linux PC only.

    Now, we are evaluating iperf(windows edition) and noticed some issue there.

    I am waiting for dev team response on this.

    Best Regards

    Ashwani