This thread has been locked.

If you have a related question, please click the "Ask a related question" button in the top right corner. The newly created question will be automatically linked to this question.

AM62A7-Q1: Question related to gstreamer pipeline latency

Part Number: AM62A7-Q1


Dear Ti staff,

We are having trouble outputing images from ox05B sensor at top speed.

According to Omnivision, this RGB-IR sensor can output at 60fps, with RGB and IR frames in 30fps each.

With the following gstreamer command, we evaluated the latency using the gst_tracer:

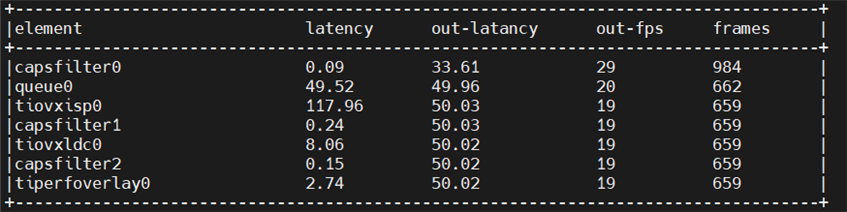
1. Streaming RGB frames:

gst-launch-1.0 \
v4l2src device=/dev/video2 io-mode=5 ! \
video/x-bayer, width=2592, height=1944, format=bggi10 ! queue leaky=2 ! \
tiovxisp sensor-name=SENSOR_OX05B_RGBIR \
dcc-isp-file=/opt/imaging/ox05b/dcc_viss.bin \
sink_0::dcc-2a-file=/opt/imaging/ox05b/dcc_2a.bin sink_0::device=/dev/v4l-subdev2 format-msb=9 \
sink_0::pool-size=8 src::pool-size=8 ! \
video/x-raw, format=NV12 ! tiovxldc dcc-file=/opt/imaging/ox05b/dcc_ldc.bin sensor-name=SENSOR_OX05B_RGBIR ! \
video/x-raw, format=NV12, width=1920, height=1080 , framerate=60/1 ! \
tiperfoverlay main-title="TI EdgeAI Hirain" title="Camera Demo" ! \
kmssink driver-name=tidss sync=false

the result was:

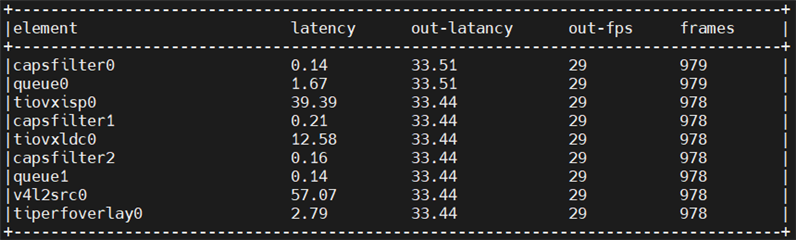
2. Streaming IR frames:

gst-launch-1.0 \
v4l2src device=/dev/video3 io-mode=5 ! \
video/x-bayer, width=2592, height=1944, format=bggi10 ! queue leaky=2 ! \
tiovxisp using_ir_mode=True sensor-name=SENSOR_OX05B_RGBIR \
dcc-isp-file=/opt/imaging/ox05b/dcc_viss.bin \
sink_0::dcc-2a-file=/opt/imaging/ox05b/dcc_2a.bin sink_0::device=/dev/v4l-subdev2 format-msb=9 \
sink_0::pool-size=8 src::pool-size=8 ! \
video/x-raw, format=GRAY8, width=2592, height=1944 ! videoconvert ! \
video/x-raw, format=NV12 ! tiovxldc dcc-file=/opt/imaging/ox05b/dcc_ldc.bin sensor-name=SENSOR_OX05B_RGBIR ! \
video/x-raw, format=NV12, width=1920, height=1080, framerate=60/1 ! \
tiperfoverlay main-title="TI EdgeAI Hirain" title="Camera Demo" ! \
kmssink driver-name=tidss sync=false

the result was:

I'm not sure the final pipeline structure we'll be using for the application, but our current commands for testing are facing severe performance issue. We would like to ask for some help regarding this problem, here are some related information:

1. Our goal is to output RGB or IR frames in 30fps seperately, whether using kmssink or filesink.

2. ISP algorithm for IR frames should be under development at the moment, so we are trying to use the algorithm for RGB frames instead, which seems to cause dramatic latency. 

3. The 'using_ir_mode‘ parameter was added by me to distinguish the stream source, in order to invoke correponding v4l2 controls to adjust the exposure parameters. Theoratically this modifications should not affect the frame rate, but we'll try to confirm it by testing on the original setup.


Thank you for the support in advance and looking forward to your reply.


Huang Jingjie

  • Hello Jingjie,

    The streaming performance can be impacted by your system load. Are you running anything else in parallel? One thing that you can try is to set the GStreamer thread priority to highest. 

    Let me also investigate this on my end with ov2312.

    Regards,

    Jianzhong

  • Hi Jianzhong,

    I’ve run the test with the original driver provided by omnivision and here are the details:

    1. the streaming command is as follows:

    GST_DEBUG_FILE=/run/trace.log GST_DEBUG_NO_COLOR=1 GST_DEBUG="GST_TRACER:7" GST_TRACERS="latency(flags=element)" \
    gst-launch-1.0 \
    v4l2src device=/dev/video2 io-mode=5 ! \
    video/x-bayer, width=2592, height=1944, format=bggi10 ! queue leaky=2 ! \
    tiovxisp sensor-name=SENSOR_OX05B_RGBIR \
    dcc-isp-file=/opt/imaging/ox05b/dcc_viss.bin \
    sink_0::dcc-2a-file=/opt/imaging/ox05b/dcc_2a.bin sink_0::device=/dev/v4l-subdev2 format-msb=9 \
    sink_0::pool-size=8 src::pool-size=8 ! \
    video/x-raw, format=NV12 ! tiovxldc dcc-file=/opt/imaging/ox05b/dcc_ldc.bin sensor-name=SENSOR_OX05B_RGBIR ! \
    video/x-raw, format=NV12, width=1920, height=1080 ! \
    tiperfoverlay main-title="TI EdgeAI Hirain" title="Camera Demo" ! \
    kmssink driver-name=tidss sync=false

    2. the result on gst tracer is almost the same as privious result with our modified driver:

    3. the output of ps -ef, there doesn't seems to be other thread consuming the core. And even if I use renice to reset the priority, the outcome won't change.

    UID          PID    PPID  C STIME TTY          TIME CMD
    root           1       0  0 10:38 ?        00:00:03 /sbin/init
    root           2       0  0 10:38 ?        00:00:00 [kthreadd]
    root           3       2  0 10:38 ?        00:00:00 [rcu_gp]
    root           4       2  0 10:38 ?        00:00:00 [rcu_par_gp]
    root           7       2  0 10:38 ?        00:00:00 [kworker/u8:0-events_unbound]
    root           8       2  0 10:38 ?        00:00:00 [mm_percpu_wq]
    root           9       2  0 10:38 ?        00:00:00 [rcu_tasks_kthre]
    root          10       2  0 10:38 ?        00:00:00 [rcu_tasks_trace]
    root          11       2  0 10:38 ?        00:00:00 [ksoftirqd/0]
    root          12       2  0 10:38 ?        00:00:00 [rcu_preempt]
    root          13       2  0 10:38 ?        00:00:00 [migration/0]
    root          14       2  0 10:38 ?        00:00:00 [cpuhp/0]
    root          15       2  0 10:38 ?        00:00:00 [cpuhp/1]
    root          16       2  0 10:38 ?        00:00:00 [migration/1]
    root          17       2  0 10:38 ?        00:00:00 [ksoftirqd/1]
    root          20       2  0 10:38 ?        00:00:00 [cpuhp/2]
    root          21       2  0 10:38 ?        00:00:00 [migration/2]
    root          22       2  0 10:38 ?        00:00:00 [ksoftirqd/2]
    root          25       2  0 10:38 ?        00:00:00 [cpuhp/3]
    root          26       2  0 10:38 ?        00:00:00 [migration/3]
    root          27       2  0 10:38 ?        00:00:00 [ksoftirqd/3]
    root          29       2  0 10:38 ?        00:00:00 [kworker/3:0H-kblockd]
    root          30       2  0 10:38 ?        00:00:00 [kdevtmpfs]
    root          31       2  0 10:38 ?        00:00:00 [netns]
    root          34       2  0 10:38 ?        00:00:00 [oom_reaper]
    root          35       2  0 10:38 ?        00:00:00 [writeback]
    root          36       2  0 10:38 ?        00:00:00 [kcompactd0]
    root          37       2  0 10:38 ?        00:00:00 [ksmd]
    root          38       2  0 10:38 ?        00:00:00 [khugepaged]
    root          49       2  0 10:38 ?        00:00:00 [cryptd]
    root          71       2  0 10:38 ?        00:00:00 [kintegrityd]
    root          72       2  0 10:38 ?        00:00:00 [kblockd]
    root          73       2  0 10:38 ?        00:00:00 [blkcg_punt_bio]
    root          74       2  0 10:38 ?        00:00:00 [kworker/1:2-events]
    root          75       2  0 10:38 ?        00:00:00 [tpm_dev_wq]
    root          76       2  0 10:38 ?        00:00:00 [edac-poller]
    root          77       2  0 10:38 ?        00:00:00 [devfreq_wq]
    root          78       2  0 10:38 ?        00:00:00 [watchdogd]
    root          79       2  0 10:38 ?        00:00:00 [kworker/u8:1-events_freezable_power_]
    root          80       2  0 10:38 ?        00:00:00 [kworker/1:1H-kblockd]
    root          81       2  0 10:38 ?        00:00:00 [rpciod]
    root          82       2  0 10:38 ?        00:00:00 [kworker/u9:0]
    root          83       2  0 10:38 ?        00:00:00 [xprtiod]
    root         111       2  0 10:38 ?        00:00:00 [kswapd0]
    root         112       2  0 10:38 ?        00:00:00 [nfsiod]
    root         114       2  0 10:38 ?        00:00:00 [kpcitest]
    root         115       2  0 10:38 ?        00:00:00 [kpcintb]
    root         116       2  0 10:38 ?        00:00:00 [vfio-irqfd-clea]
    root         117       2  0 10:38 ?        00:00:00 [kworker/u8:2-events_freezable_power_]
    root         121       2  0 10:38 ?        00:00:00 [irq/17-20000000]
    root         123       2  0 10:38 ?        00:00:00 [irq/18-20010000]
    root         125       2  0 10:38 ?        00:00:00 [kworker/1:6-cgroup_destroy]
    root         126       2  0 10:38 ?        00:00:00 [irq/19-20020000]
    root         129       2  0 10:38 ?        00:00:00 [ptp0]
    root         130       2  0 10:38 ?        00:00:00 [irq/254-8000000]
    root         131       2  0 10:38 ?        00:00:00 [sdhci]
    root         132       2  0 10:38 ?        00:00:00 [irq/20-mmc0]
    root         133       2  0 10:38 ?        00:00:00 [irq/30-2b10000.]
    root         134       2  0 10:38 ?        00:00:00 [irq/29-2b10000.]
    root         135       2  0 10:38 ?        00:00:00 [irq/383-1-0022]
    root         136       2  0 10:38 ?        00:00:00 [kworker/0:2-events]
    root         138       2  0 10:38 ?        00:00:00 [card0-crtc0]
    root         139       2  0 10:38 ?        00:00:00 [kworker/0:4-events]
    root         141       2  0 10:38 ?        00:00:00 [sdhci]
    root         142       2  0 10:38 ?        00:00:00 [irq/21-mmc1]
    root         143       2  0 10:38 ?        00:00:00 [mmc_complete]
    root         144       2  0 10:38 ?        00:00:00 [kworker/0:1H-mmc_complete]
    root         145       2  0 10:38 ?        00:00:00 [mmc_complete]
    root         146       2  0 10:38 ?        00:00:00 [kworker/2:1H-kblockd]
    root         147       2  0 10:38 ?        00:00:00 [jbd2/mmcblk1p2-]
    root         148       2  0 10:38 ?        00:00:00 [ext4-rsv-conver]
    root         150       2  0 10:38 ?        00:00:00 [kworker/3:2H]
    root         151       2  0 10:38 ?        00:00:00 [ipv6_addrconf]
    root         158       2  0 10:38 ?        00:00:00 [kworker/0:2H-mmc_complete]
    root         164       2  0 10:38 ?        00:00:00 [kworker/1:2H-kblockd]
    root         165       2  0 10:38 ?        00:00:00 [kworker/2:2H-kblockd]
    rpc          176       1  0 10:38 ?        00:00:00 /usr/sbin/rpcbind -w -f
    root         177       1  0 10:38 ?        00:00:00 /lib/systemd/systemd-journald
    root         180       2  0 10:38 ?        00:00:00 [cryptodev_queue]
    root         193       2  0 10:38 ?        00:00:00 [kworker/2:2-events]
    root         196       1  0 10:38 ?        00:00:01 /lib/systemd/systemd-udevd
    systemd+     216       1  0 10:38 ?        00:00:00 /lib/systemd/systemd-timesyncd
    root         225       2  0 10:38 ?        00:00:00 [hwrng]
    root         232       2  0 10:38 ?        00:00:00 [vpu_irq_thread]
    root         257       2  0 10:38 ?        00:00:00 [kworker/2:3-cgroup_destroy]
    root         710       2  0 10:38 ?        00:00:00 [jbd2/mmcblk0p1-]
    root         711       2  0 10:38 ?        00:00:00 [ext4-rsv-conver]
    root         712       1 15 10:38 ?        00:01:07 /usr/sbin/rngd -f -r /dev/hwrng
    root         724       1  0 10:38 ?        00:00:00 /usr/sbin/atd -f
    root         725       1  0 10:38 ?        00:00:00 /usr/sbin/crond -n
    message+     726       1  0 10:38 ?        00:00:00 /usr/bin/dbus-daemon --system --address=systemd: --nofork --nopidfile --systemd-activation --syslog-only
    root         731       1  0 10:38 ?        00:00:00 /usr/sbin/irqbalance --foreground
    root         738       1  0 10:38 ?        00:00:00 /usr/sbin/syslog-ng -F --enable-core --cfgfile /etc/syslog-ng/syslog-ng.conf --control /var/lib/syslog-ng/syslog-ng
    root         740       1  0 10:38 ?        00:00:00 /usr/sbin/tee-supplicant
    root         743       2  0 10:38 ?        00:00:00 [optee_bus_scan]
    root         751       1  0 10:38 ?        00:00:00 /lib/systemd/systemd-logind
    root         752       2  0 10:38 ?        00:00:00 [kworker/u8:3-events_power_efficient]
    systemd+     754       1  0 10:38 ?        00:00:00 /lib/systemd/systemd-networkd
    systemd+     760       1  0 10:38 ?        00:00:00 /lib/systemd/systemd-resolved
    root         761       2  0 10:38 ?        00:00:00 [kworker/3:3-events]
    avahi        762       1  0 10:38 ?        00:00:00 avahi-daemon: running [am62axx-evm.local]
    rpcuser      764       1  0 10:38 ?        00:00:00 /usr/sbin/rpc.statd -F
    root         765       1  0 10:38 ?        00:00:00 /usr/sbin/snmpd -Ls0-6d -a -f
    root         771       1  0 10:38 ?        00:00:00 /usr/sbin/vsftpd
    root         772       1  0 10:38 tty1     00:00:00 /sbin/agetty -o -p -- \u --noclear tty1 linux
    avahi        773     762  0 10:38 ?        00:00:00 avahi-daemon: chroot helper
    root         776       1  0 10:38 ttyS2    00:00:00 /bin/login --
    root         948       1  0 10:38 ?        00:00:00 /usr/sbin/telnetd
    root         962       1  0 10:38 ?        00:00:00 supervising syslog-ng
    root         963     962  0 10:38 ?        00:00:00 /usr/sbin/syslog-ng
    root        1279       1  0 10:38 ?        00:00:00 ntpd -s
    root        1282       1  0 10:38 ?        00:00:00 /lib/systemd/systemd --user
    root        1283    1282  0 10:38 ?        00:00:00 (sd-pam)
    root        1288     776  0 10:38 ttyS2    00:00:00 -sh
    root        1366       1  0 10:38 ?        00:00:00 ntpd -s
    root        1425       1  0 10:40 ?        00:00:01 /usr/bin/dockerd -H fd://
    root        1430       1  0 10:40 ?        00:00:00 /usr/libexec/ipsec/starter --daemon charon --nofork
    root        1435       1  0 10:40 ?        00:00:00 /usr/sbin/netserver
    root        1436       2  0 10:40 ?        00:00:00 [kworker/3:4-cgroup_destroy]
    root        1438       1  0 10:40 ?        00:00:00 /usr/sbin/lighttpd -D -f /etc/lighttpd/lighttpd.conf
    root        1439    1430  0 10:40 ?        00:00:00 /usr/libexec/ipsec/charon
    root        1536    1425  0 10:40 ?        00:00:01 containerd --config /var/run/docker/containerd/containerd.toml --log-level info
    root        1779       1  0 10:42 ?        00:00:00 /usr/sbin/dropbear -i -r /etc/dropbear/dropbear_rsa_host_key -B
    root        1781       1  0 10:42 ?        00:00:00 /usr/sbin/dropbear -i -r /etc/dropbear/dropbear_rsa_host_key -B
    root        1782    1779  0 10:42 pts/0    00:00:00 -sh
    root        1856    1781  0 10:42 ?        00:00:00 /usr/libexec/sftp-server
    root        1859    1779  0 10:42 ?        00:00:00 sh -c while true; do sleep 1;head -v -n 8 /proc/meminfo; head -v -n 2 /proc/stat /proc/version /proc/uptime /proc/l
    root        1968    1288 26 10:43 ttyS2    00:00:34 gst-launch-1.0 v4l2src device=/dev/video2 io-mode=5 ! video/x-bayer, width=2592, height=1944, format=bggi10 ! queue
    root        2004    1779  0 10:43 ?        00:00:00 sh -c while true; do sleep 1;head -v -n 8 /proc/meminfo; head -v -n 2 /proc/stat /proc/version /proc/uptime /proc/l
    root        2136    1859  0 10:43 ?        00:00:00 df -l
    root        2177       2  0 10:43 ?        00:00:00 [kworker/3:1H]
    root        2178       2  0 10:43 ?        00:00:00 [kworker/0:0H]
    root        2598       2  0 10:44 ?        00:00:00 [kworker/1:0-cgroup_destroy]
    root        2731       2  0 10:44 ?        00:00:00 [kworker/0:0-events]
    root        2935       1  0 10:45 ?        00:00:00 /sbin/agetty -8 -L ttyS0 115200 xterm
    root        2936    2004  0 10:45 ?        00:00:00 sleep 1
    root        2943    1782  0 10:45 pts/0    00:00:00 ps -ef

    Hope these info helps. Looking forward to your updates.

    Regards,

    Huang Jingjie

  • Hello Jingjie,

    Thanks for the additional information. To find out what caused the fps drop, can you do a few testing?

    1. Use "fpsdisplaysink" to display the fps instead of using the script "parse_gst_tracers.py". For example, below gst pipeline works on my setup with ov2312:

    root@am62axx-evm:/opt/edgeai-gst-apps# GST_DEBUG_FILE=/run/trace.log GST_DEBUG_NO_COLOR=1 GST_DEBUG="GST_TRACER:7" GST_TRACERS="latency(flags=pipeline+element)" \
    > gst-launch-1.0 -v v4l2src device=/dev/video3 io-mode=5 ! \
    > video/x-bayer, width=1600, height=1300, framerate=30/1, format=bggi10 ! queue leaky=2 ! \
    > tiovxisp sink_0::device=/dev/v4l-subdev4 sensor-name=SENSOR_OV2312_UB953_LI \
    > dcc-isp-file=/opt/imaging/ov2312/dcc_viss.bin sink_0::dcc-2a-file=/opt/imaging/ov2312/dcc_2a.bin format-msb=9 \
    > sink_0::pool-size=8 src::pool-size=8 ! \
    > video/x-raw, format=NV12, width=1600, height=1300, framerate=30/1 ! queue ! \
    > fpsdisplaysink text-overlay=false video-sink="kmssink driver-name=tidss sync=true show-preroll-frame=false" sync=true
    

    Below is the displayed fps information:

    /GstPipeline:pipeline0/GstFPSDisplaySink:fpsdisplaysink0: last-message = rendered: 15, dropped: 0, current: 29.32, average: 29.32
    /GstPipeline:pipeline0/GstFPSDisplaySink:fpsdisplaysink0: last-message = rendered: 30, dropped: 0, current: 28.13, average: 28.71
    /GstPipeline:pipeline0/GstFPSDisplaySink:fpsdisplaysink0: last-message = rendered: 44, dropped: 0, current: 27.17, average: 28.20
    /GstPipeline:pipeline0/GstFPSDisplaySink:fpsdisplaysink0: last-message = rendered: 58, dropped: 0, current: 27.94, average: 28.14
    /GstPipeline:pipeline0/GstFPSDisplaySink:fpsdisplaysink0: last-message = rendered: 73, dropped: 0, current: 28.13, average: 28.14
    /GstPipeline:pipeline0/GstFPSDisplaySink:fpsdisplaysink0: last-message = rendered: 88, dropped: 0, current: 27.28, average: 27.99
    /GstPipeline:pipeline0/GstFPSDisplaySink:fpsdisplaysink0: last-message = rendered: 103, dropped: 0, current: 29.04, average: 28.13
    /GstPipeline:pipeline0/GstFPSDisplaySink:fpsdisplaysink0: last-message = rendered: 119, dropped: 0, current: 30.00, average: 28.37
    /GstPipeline:pipeline0/GstFPSDisplaySink:fpsdisplaysink0: last-message = rendered: 135, dropped: 0, current: 30.01, average: 28.56
    /GstPipeline:pipeline0/GstFPSDisplaySink:fpsdisplaysink0: last-message = rendered: 151, dropped: 0, current: 30.01, average: 28.70
    /GstPipeline:pipeline0/GstFPSDisplaySink:fpsdisplaysink0: last-message = rendered: 167, dropped: 0, current: 30.01, average: 28.82
    /GstPipeline:pipeline0/GstFPSDisplaySink:fpsdisplaysink0: last-message = rendered: 183, dropped: 0, current: 30.00, average: 28.92
    /GstPipeline:pipeline0/GstFPSDisplaySink:fpsdisplaysink0: last-message = rendered: 199, dropped: 0, current: 30.01, average: 29.01
    

    As you can see, at the beginning, the fps is below 30, but it goes to 30 eventually. The initial fps drop may be due to the display.

    2. Use "fakesink" instead of the display. This will isolate any potential issues with the display. Below gst pipeline worked on my setup:

    root@am62axx-evm:/opt/edgeai-gst-apps# GST_DEBUG_FILE=/run/trace.log GST_DEBUG_NO_COLOR=1 GST_DEBUG="GST_TRACER:7" GST_TRACERS="latency(flags=pipeline+element)" \
    > gst-launch-1.0 -v v4l2src device=/dev/video3 io-mode=5 ! \
    > video/x-bayer, width=1600, height=1300, framerate=30/1, format=bggi10 ! queue leaky=2 ! \
    > tiovxisp sink_0::device=/dev/v4l-subdev4 sensor-name=SENSOR_OV2312_UB953_LI \
    > dcc-isp-file=/opt/imaging/ov2312/dcc_viss.bin sink_0::dcc-2a-file=/opt/imaging/ov2312/dcc_2a.bin format-msb=9 ! \
    > video/x-raw, format=NV12, width=1600, height=1300, framerate=30/1 ! queue ! \
    > fpsdisplaysink video-sink=fakesink sync=true
    

    And the displayed fps information:

    /GstPipeline:pipeline0/GstFPSDisplaySink:fpsdisplaysink0: last-message = rendered: 15, dropped: 0, current: 29.74, average: 29.74
    /GstPipeline:pipeline0/GstFPSDisplaySink:fpsdisplaysink0/GstTextOverlay:fps-display-text-overlay: text = rendered: 31, dropped: 0, current: 31.07, average: 30.41
    /GstPipeline:pipeline0/GstFPSDisplaySink:fpsdisplaysink0: last-message = rendered: 31, dropped: 0, current: 31.07, average: 30.41
    /GstPipeline:pipeline0/GstFPSDisplaySink:fpsdisplaysink0/GstTextOverlay:fps-display-text-overlay: text = rendered: 46, dropped: 0, current: 29.54, average: 30.12
    /GstPipeline:pipeline0/GstFPSDisplaySink:fpsdisplaysink0: last-message = rendered: 46, dropped: 0, current: 29.54, average: 30.12
    /GstPipeline:pipeline0/GstFPSDisplaySink:fpsdisplaysink0/GstTextOverlay:fps-display-text-overlay: text = rendered: 62, dropped: 0, current: 28.25, average: 29.62
    /GstPipeline:pipeline0/GstFPSDisplaySink:fpsdisplaysink0: last-message = rendered: 62, dropped: 0, current: 28.25, average: 29.62
    /GstPipeline:pipeline0/GstFPSDisplaySink:fpsdisplaysink0/GstTextOverlay:fps-display-text-overlay: text = rendered: 79, dropped: 0, current: 32.78, average: 30.24
    /GstPipeline:pipeline0/GstFPSDisplaySink:fpsdisplaysink0: last-message = rendered: 79, dropped: 0, current: 32.78, average: 30.24
    /GstPipeline:pipeline0/GstFPSDisplaySink:fpsdisplaysink0/GstTextOverlay:fps-display-text-overlay: text = rendered: 94, dropped: 0, current: 29.57, average: 30.13
    /GstPipeline:pipeline0/GstFPSDisplaySink:fpsdisplaysink0: last-message = rendered: 94, dropped: 0, current: 29.57, average: 30.13
    /GstPipeline:pipeline0/GstFPSDisplaySink:fpsdisplaysink0/GstTextOverlay:fps-display-text-overlay: text = rendered: 110, dropped: 0, current: 30.63, average: 30.21
    /GstPipeline:pipeline0/GstFPSDisplaySink:fpsdisplaysink0: last-message = rendered: 110, dropped: 0, current: 30.63, average: 30.21
    /GstPipeline:pipeline0/GstFPSDisplaySink:fpsdisplaysink0/GstTextOverlay:fps-display-text-overlay: text = rendered: 126, dropped: 0, current: 30.13, average: 30.20
    /GstPipeline:pipeline0/GstFPSDisplaySink:fpsdisplaysink0: last-message = rendered: 126, dropped: 0, current: 30.13, average: 30.20
    /GstPipeline:pipeline0/GstFPSDisplaySink:fpsdisplaysink0/GstTextOverlay:fps-display-text-overlay: text = rendered: 142, dropped: 0, current: 30.13, average: 30.19
    /GstPipeline:pipeline0/GstFPSDisplaySink:fpsdisplaysink0: last-message = rendered: 142, dropped: 0, current: 30.13, average: 30.19
    /GstPipeline:pipeline0/GstFPSDisplaySink:fpsdisplaysink0/GstTextOverlay:fps-display-text-overlay: text = rendered: 158, dropped: 0, current: 30.14, average: 30.18
    /GstPipeline:pipeline0/GstFPSDisplaySink:fpsdisplaysink0: last-message = rendered: 158, dropped: 0, current: 30.14, average: 30.18
    

    Can you do similar tests and provide the results?

    Regards,

    Jianzhong

  • Hi Jianzhong,

    I've tried your way to monitor fps, which didn't work (prints out nothing).

    But I refered your pipeline and used the old way, the output was 30fps.

    Here is the new pipeline for streaming RGB frames:

    GST_DEBUG_FILE=/run/trace.log GST_DEBUG_NO_COLOR=1 GST_DEBUG="GST_TRACER:7" GST_TRACERS="latency(flags=pipeline+element)" \
    gst-launch-1.0 \
    v4l2src device=/dev/video2 io-mode=5 ! \
    video/x-bayer, width=2592, height=1944, framerate=30/1, format=bggi10 ! queue leaky=2 ! \
    tiovxisp sensor-name=SENSOR_OX05B_RGBIR \
    dcc-isp-file=/opt/imaging/ox05b/dcc_viss.bin \
    sink_0::dcc-2a-file=/opt/imaging/ox05b/dcc_2a.bin sink_0::device=/dev/v4l-subdev2 format-msb=9 \
    sink_0::pool-size=8 src::pool-size=8 ! \
    video/x-raw, format=NV12 ! tiovxldc dcc-file=/opt/imaging/ox05b/dcc_ldc.bin sensor-name=SENSOR_OX05B_RGBIR ! \
    video/x-raw, format=NV12, width=1920, height=1080,framerate=30/1 ! queue ! \
    tiperfoverlay main-title="TI EdgeAI Hirain" title="Camera Demo" ! \
    kmssink driver-name=tidss sync=false

    And here is the trace log:

    Both tiperfoverlay and trace log showed that output framerate was around 30fps.

    As for your method, I'll take some more time later to find why it didn't print anything, as it's not so cruical currently.

    One more issue I encountered yesterday was that I can successfully probe ox05b, /dev/video3 present in v4l2-ctl, but I cannot utilize it anymore:

    1. when using gstreamer, the following error showed up:

    ERROR: from element /GstPipeline:pipeline0/GstV4l2Src:v4l2src0: Failed to allocate required memory.
    Additional debug info:
    ../gst-plugins-good-1.16.3/sys/v4l2/gstv4l2src.c(660): gst_v4l2src_decide_allocation (): /GstPipeline:pipeline0/GstV4l2Src:v4l2src0:
    Buffer pool activation failed
    

    2. when using v4l2-ctl, it said no dev:

    root@am62axx-evm:/opt/edgeai-gst-apps# v4l2-ctl -d /dev/video3 --set-fmt-video=width=2592,height=1944,pixelformat=BGI0  --stream-mmap --stream-skip=3 --stream-count=1 --stream-to=test00.raw
                    VIDIOC_STREAMON returned -1 (No such device)
    

    This problem only showed up in one system, but I have no clue about the cause yet. Would you please also help me with this glitch?

    Regards,

    Huang Jingjie

  • More info on IR stream: my colleague confirmed that by using the following pipeline, the board can output IR frames in 30fps(gst_tracer result):

    GST_DEBUG_FILE=/run/trace.log GST_DEBUG_NO_COLOR=1 GST_DEBUG="GST_TRACER:7" GST_TRACERS="latency(flags=pipeline+element)" \
    
    gst-launch-1.0 \
    
    v4l2src device=/dev/video3 io-mode=5 ! \
    
    video/x-bayer, width=2592, height=1944, format=bggi10 ! queue leaky=2 ! \
    
    tiovxisp using_ir_mode=True sensor-name=SENSOR_OX05B_RGBIR \
    
    dcc-isp-file=/opt/imaging/ox05b/dcc_viss_ir2.bin \
    
    sink_0::dcc-2a-file=/opt/imaging/ox05b/dcc_2a.bin sink_0::device=/dev/v4l-subdev2 format-msb=9 \
    
    sink_0::pool-size=8 src::pool-size=8 ! \
    
    video/x-raw, format=GRAY8, width=2592, height=1944  ! queue ! \
    
    fpsdisplaysink video-sink=fakesink sync=true
     

  • Hi Jingjie,

    Thanks for sharing the updates.

    Both tiperfoverlay and trace log showed that output framerate was around 30fps.

    Looks like adding the queue element made the difference in frame rate. 

    More info on IR stream: my colleague confirmed that by using the following pipeline, the board can output IR frames in 30fps(gst_tracer result):

    Do you also get 30fps if you use kmssink?

    Regards,

    Jianzhong

  • Hi Jianzhong,

    Thanks for your support, Xu have gone to the customer site to solve the problem with the customer. and have solved it by avoiding using videoconvert. so this thread can be closed.

    BR,

    Biao

  • Hi Jianzhong,

    The pipeline I sent is not suitable for kmssink due to its pixel format GRAY8, which leads to yet another question:

    My colleague wishes to stream the IR frames in 30fps via HDMI, but currently the only plugin we found for format converting is videoconvert, and as previously discussed this plugin causes a performance issue. I also checked other tiovx plugins but unfortunately tiovxcolorconvert and tiovxdlcolorconvert don't support GRAY8 as source.

    I just noticed that my colleague have sent a thread about this issue: https://e2e.ti.com/support/processors-group/processors/f/processors-forum/1247744/am62a7-how-to-convert-gray8-format-to-nv12. It would be better to continue there, and I thank you very much for your support here.

    Regards,

    Huang Jingjie

  • Hi Biao and Jingjie,

    Thanks for the updates. I'll close this thread and let's continue the discussion in the new thread.

    Regards,

    Jianzhong