This thread has been locked.

If you have a related question, please click the "Ask a related question" button in the top right corner. The newly created question will be automatically linked to this question.

AM6442: R5F Prefetch Abort debugging

Part Number: AM6442
Other Parts Discussed in Thread: SYSCONFIG

We are witnessing spurious Hardware Faults on one of the R5F cores which is also accessing the external DDR4 memory for both code & data. Our board is a proprietary design.

I have a incident of Prefetch Abort fault which I want to debug deeper; with the help of application note "sprad28". I would appreciate your confirmation.

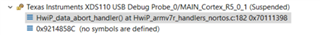
I am loading the multicore project via CCS and leave it to run. After a while the core R5_0_1 hangs while the other cores keep running. When pausing the CCS session, I can see that core R5_0_1 is caught in Prefetch Abort handler :

The core registers are as follows :

CPSR register M[4..0] is 10111 meaning currently in Abort mode.

SPSR register M[4..0] is 11111 meaning that the processor was previously in System mode.

So : it's understood that we went from System mode to Abort mode.

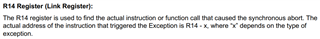
The Core register R14 is actually 0x00000001 : can I deduct anything from this value? It doesn't look like a proper address where code may reside...

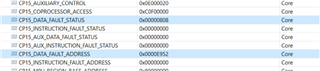
From the System registers in CCS

It looks like the prefetch abort is caused by a Instruction Fault and the IFSR Instruction Fault Status Register there is 0x0000000D. From ARM website I deduct that this would be an MMU Permission Fault : https://developer.arm.com/documentation/ddi0406/c/System-Level-Architecture/Virtual-Memory-System-Architecture--VMSA-/Exception-reporting-in-a-VMSA-implementation/Fault-reporting-in-PL1-modes?lang=en#CBHHADIB

The Instruction Fault Address Register IFAR is 0x0107A9D4  which doesn't make sense at all to me. It doesn't look like a valid address in the MAIN domain and we don't use RAT (Region Address Translation) on this core. The TRM has nothing mapped on this address :

Are my assumptions correct so far?

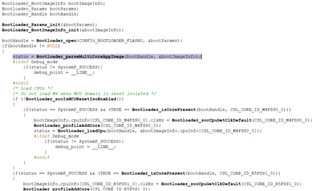
Going back to Core register R13 (Stack Pointer); here I see the value 0x70114D78. Comparing against my symbol table for this core :

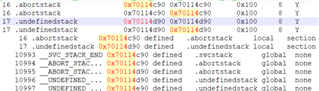
is it possible that I'm running out of stack space? We have already tried increasing the Stack Size earlier, but maybe we didn't try hard enough...

I would appreciate your feedback on this debug session. Please let me know if you need more info; but I cannot always reproduce the issue at hand.

kind regards,

Marc

  • Hello Marc, 

    Thank you for the query and detailed inputs.

    Let me review the inputs and comeback.

    Regards,

    Sreenivasa

  • Thank you Sreenivasa,

    By now I also witnessed a Data abort on the same core

    The Link register R14 again makes no sense : 0x00000001

    the DFSR status register is 0x808, but I don't know how to interprete this.

    the DFAR address register points to 0x0000E952 which to my knowledge is not used in the code (according to the MAP file) :

    There is no RAT (Region Address Translation) setup in the system.

    Any help appreciated!

    kind regards,

    Marc Schouteeten

  • Greetings Marc,

    Let's look at the Prefetch abort first:

    IFSR: 0x0000000D

    - SD =0, S = 0, Status = 0b1101

    - Encoded value = SD, S, Status = 0b001101 = Permission 

    IFAR: 0x0107A9D4

    Use this to decode the registers (this is the R5 TRM): https://developer.arm.com/documentation/ddi0460/d/System-Control/Register-descriptions/Fault-Status-and-Address-Registers 

    It looks like it's a MPU permissions issue is what's causing it to abort first. You are correct though, the address maps to no memory endpoint (unless there was a RAT involved), so the prefetch abort is likely a symptom of something else. Link register does look suspect, but I don't think that register is valid during a prefetch abort so hard to say. The stack pointer is pointing to the allocated stack space during an abort mode, so that seems okay.

    Looking at the data abort:

    DFSR: 0x808

    - SD =0, an AXI Decode Error, I think this is usually caused by an access to an invalid address. (Bit is only valid for external aborts)

    - RW = 1, this means a write caused the abort

    - S = 0, Status = 0b1000

    - Encoded Value: 0b001000 = Synchronous External Abort-

    DFAR: 0x0000E952

    This looks like an abort caused by writing to 0xE952. Link register looks suspect again.

    What can we gather from this?

    I can't quite gather anything definitive from this. A stack overflow could potentially cause issues like this or weirder, you could have another core monitor the other's stack space or dump the stack space of the core after it has aborted. If you initialize the stack to some non-zero known value, then you may be able to clearly see if the CPU has written over the allocated space for it (example if you write 0x13371337 to the entire stack, anything but that will show where the CPU has loaded data).

    These types of problems (seemingly random errors that happen differently and inconsistently) can be very tricky to diagnose. You haven't described your S/W or your usecase, but I imagine it's not a trivial setup. While you can try the suggestion above, with these problems it helps to take a step back and examine a couple of things:

    1) Did these problems occur recently or have they been ever-present? 

    2) Has the S/W changed recently? Is there version control to determine when it changed and what changed? If you revert back, does the problem still occur?

    3) Have the inputs to the S/W (can be H/W interfaces/code or user input) changed recently?

    4) Can you reproduce this error? If not, can you peel back layers of this software to reproduce this problem?

    It may be able to help if you can lightly describe your S/W or what's it's doing. The first thing could be to try the stack experiment mentioned above, but ultimately you need to consistently replicate one of these things occurring or narrow down when it occurs (which depending on S/W complexity can be non-trivial).

    Sincerely,

    Lucas

  • Thank you Lucas for going through the debug session and explaining.

    0/ stack : we already suspected this as a potential cause and increased both heap and stack but this didn't solve the issue. However I still want to try your suggestion of filling the complete stack space in order to be able to detect any overflow. It was on my bucket list..

    1/ error started occurring around the time we started using the external DDR4 memory and the LwIP stack. Due to the stack and imported code and data requirement we needed more (DDR) memory. At first nearly everything was located in DDR but with the aborts appearing we became more cautious and moved system memory parts back to the MSRAM (while the bulk of code and data remains on DDR). I still wonder if all DMA data regions need to be in MSRAM or if it is also allowed in DDR? We however tried to move all DMA regions for ENET to the MSRAM, but the code is quite bulky and not all is clear.

    It's hard to just revert to an earlier version because the extra functionality coming with ENET is just to entangled with the rest.

    2/ we have version control, but again; it's not easy to revert to earlier version without losing most of the functionality. We also switched from 1st to 2nd prototype around the time of occurring aborts; but I could confirm that with later FW the abort also happens on first hardware. We also inspected HW with xray and power rails with a good oscilloscope and that seems to be OK; so I'm starting to suspect HW less and less.

    3/ there were no major changes in HW. The abort happens usually around init of the Ethernet PHYs and ENET startup; or when starting a TFTP or such. The ethernet interfaces are identical to what's used in SK-AM64 hardware and no changes were made there across prototype versions 1 and 2.

    4/ the error occurs quite often but not systematically. We see differences between different boards; but then again it depends on Murphy. At Showtime it usually fails and aborts... Disabling the ENET init and loop seems to deliver a stable system, but stripped of a lot of important functionality.

    I'm a bit concerned about the fact that we get both Instruction and Data aborts. But in a complex system a lot can go wrong.

    kind regards,

    Marc

  • Greetings Marc,

    Please let me know how the stack experiment turns out, though with these kinds of issues this may be a symptom of something incorrect happening in S/W (like a function allocating a large array on the stack and not statically or a pointer overflow).

    I'm not greatly suspecting H/W at the moment either, the nature of the aborts have all been to undefined addresses and if there was a DDR issue you'd likely see massive failures. You can run a memtester (like https://pyropus.ca./software/memtester/) or something packaged in an O/S if we suspect it later, but for now S/W is more likely cause. One thing to examine could be board failure rate (if they fail differently and if they all fail)

    I have never used ENET (are Murphy and Showtime codenames or features in ENET?) and I'm not familiar with anything about it, but it sounds like you have an area of code that it roughly happens in. Peeling back the init and/or startup portions of the code may not be trivial, but perhaps adding additonal debugging statements to narrow down where the aborts occur and adding things like local variables can be handy. If for example there is some logic based of information in packets, perhaps there are strange packets or the information in them is not being interpreted correctly leading to variables having incorrect values. One idea could be if there any important allocated variables (like in a defined linker region and not on the stack in a function) like a temporary location for a packet, you can have your abort handler dump it and examine it.

    I would start with portioning out the steps at a conceptual level what the init and startup code are doing (I'm not sure if the ENET code was developed by you or ported from another project). Then you can add debug statements to either track the position of the code or dump variables periodically. 

    Sincerely,

    Lucas

  • Hi Lucas,

    my collegue Gergely will follow up on the stack experiment and will also continue this thread in the coming week; since I'll be out of office.

    We ran DDR memory tests over night without seeing issues there. I didn't do a real board failure rate check but tested the prototype batch of 10 (9 working) boards one by one and I did have the feeling that some boards were more prone to crash than others. Then again this could have been coincidence.

    ENET is the ethernet support inside TI MCU+ SDK and in my feeling this was the area of code where most often things go wrong. During Showtime (when giving a demo to management) and depending on Murphy (always on the wrong moment)...

    in the meanwhile I have another occurrence of crash (Undefined) which I will detail in subsequent post...

    kind regards,
    Marc

  • I now also witnessed an Undefined exception.

    Contrary to most crashes which happen most often while starting up the ENET (TI MCU+ SDK library supporting Ethernet), this crash happens at the very startup of the R5 core, apperently during I2C opening called from TI board and driver setup :

    CPSR register M[4..0] is 11011 meaning currently in Undefined mode.

    The Link register R14 again makes no sense : 0x00000001.

    From appnote sprad28 :

    Unfortunately, I don't know how to interprete R14 since it's at value 0x1.

    From the call stack which is displayed in the Debug window - if this is correct - then the core was somewhere executing I2C_open() which is located in DDR (0x9000B0B4).

    The DDR itself is first initialized in the SBL NULL bootloader and then again setup in the SysConfig of the project itself.

    kind regards,
    Marc Schouteeten

  • I have another occurance of Undefined abort; in another location.

    The reason I'm posting it; is because the call stack shows a strange address : an offset of 0x7d0b470 to a memory area which is big data buffer (not instruction).

    The crash again happens at the very startup of the core. Nothing has been printed yet on the console terminal.

    R14 is again 0x1; while ARM mode in CPSR is 11011 (undefined).

    kind regards,
    Marc

  • Hi Lucas,

    I did the stack fill and chesk, but I do not see anything out of the ordinary, the stack has plenty of space, and I only detected values changing on normal usage. I did not see backwart overflow, but I want to check that as well.

    Best regards,

    Gergely

  • Greetings Gergely, Marc,

    All of these differing types of failures are extremely strange. I think we need to try and create a consistent and repeatable fail situation, and I think these aborts around the initialization are a good candidate area. Marc mentioned that this is a multicore S/W application, things to think about would be:

    1) Are all of these cores starting up at the same time? Is there randomness in their order of execution or dependency on each other? Can we create some artificial ordering

    2) How can we start to strip back this overall application for debug? Is it possible to let one core run in a loop to see if the failure occurs, then gradually add other cores back in?

    Let me know your thoughts on how feasible these sound, if we can get to a repeated and consistent failure I think it would help a lot.

    Sincerely,

    Lucas

  • Hi Lucas,

    I'm not entirely sure it is related, but now I have a crash on the first 2 cores almoast all the time they start up. (R5FSS0_0 and R5FSS0_1) This time the 0th core is running ethercat slave under FreeRTOS and it runs to prvTaskExitError(), the 1st core crashes before the main function and will stay ainMpuP_enable(), because `type = CacheP_getEnabled();` will return 3 witch is not equals to CacheP_TYPE_ALL.

    Answer to question 1)

    We start all the cores at boot, but the boot order is:

    1. Load        CSL_CORE_ID_M4FSS0_0  // Safety core
    2. Load        CSL_CORE_ID_A53SS0_0   // Unused
    3. Load        CSL_CORE_ID_A53SS0_1   // Unused
    4. Load        CSL_CORE_ID_R5FSS1_0   // Motor task (No issue)
    5. Load        CSL_CORE_ID_R5FSS1_1   // Other task (No issue)
    6. LoadSelf  CSL_CORE_ID_R5FSS0_0   // EtherCAT task
    7. LoadSelf  CSL_CORE_ID_R5FSS0_1   // Terminal and Ethernet task

    1. Run          CSL_CORE_ID_M4FSS0_0  
    2. Run          CSL_CORE_ID_A53SS0_0   
    3. Run          CSL_CORE_ID_A53SS0_1   
    4. Run          CSL_CORE_ID_R5FSS1_0   
    5. Run          CSL_CORE_ID_R5FSS1_1   
    6. RunSelf    handle CSL_CORE_ID_R5FSS0_0 and CSL_CORE_ID_R5FSS0_1

    In the bootloader I noticed that it returns from the following line, and sometimed printed the following debug log:

    if(status == SystemP_SUCCESS)
    {
        status = Bootloader_runSelfCpu(bootHandle, &bootImageInfo);
    }
    
    /* it should not return here, if it does, then there was some error */
    DebugP_log("All CPU-s initialized.");
    
    Bootloader_close(bootHandle);
    

    After boot we synchronize the cores after initialization, to make sure every shared buffer is properly initialized before use.

    The first abort is happens before that in the I2C_open() function as seen above.

    Answer to question 2)

    I will further try with ordering the core startups, but the issue is also present when I start only the problematic core from debugger.

    Best Regards,

    Gergely

  • Hi Lucas,

    Earlier on the exceptions always occurred on the core R5_0_1 which was running a console, tcp/ip stack, emmc, filesystem, etc... This core also uses the DDR quite a lot.

    Now we have a case where the multicore OSPI SBL is failing. We are using a customized version of OSPI SBL which uses our OSPI flash and also DDR. The SBL is derived from the example bootloader provided by TI and is running on core R5_0_0. We see that the crash occurs while parsing the multi core image which was earlier flashed to OSPI flash.

    I cannot see the content of the registers, since here we test using a flashed image. (thus we use the OSPI flash bootloader).

    I am sure that the image itself was flashed correctly; because we first upload the OSPI SBL, app image and app xip image via TFTP PUT to the DDR, then it is saved from DDR to eMMC. After this we again do a TFTP GET where the image is read from eMMC to DDR, then sent via TFTP to the host PC. After comparing the PUT image to the GET image; everything is identical. This is actually a proof of the tcp/ip comm, the ddr and the emmc.

    Still we get this OSPI SBL parsing error at startup.

    We had the issue on 2 hardware boards.

    Another board does not have the issue; but there I see the crashes mentioned above (instruction and data errors).

    kind regards,
    Marc

  • Hey Marc,

    I think we can focus to the OSPI SBL failures since it's more targeted than your full application. You made references to eMMC but typically OSPI flash is NOR or NAND flash that has a SPI protocol, not sure where eMMC fits into that. I know we ruled H/W as low risk, but can you answer the following questions:

    1. Can you provide more details on the DDR memory tests you ran overnight? Was it the memtester I linked or some other custom testing?

    2. What is your DDR transfer rate (1600MT/s?) and OSPI operating mode (166MHz SDR)? 

    3. If you try lowering your DDR frequency or OSPI frequency, do you still see any of the failing cases above or with reduced sensitivity?

    If changing DDR or OSPI affects the failure rate, we can dive in further to things specific to the IP. The next level after that would be looking at board specific simulations and timing analysis done, but I think we can start with just the experiment listed in 3 and go from there.

    Sincerely,

    Lucas