This thread has been locked.

If you have a related question, please click the "Ask a related question" button in the top right corner. The newly created question will be automatically linked to this question.

TDA4VM: TDA4VM occasional video stuck issue

Part Number: TDA4VM

hi,ti team,

On the TDA4VM T5 machine, there was an occasional video stuck issue.

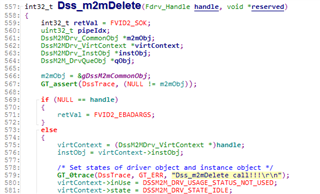
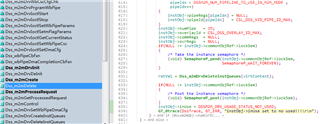
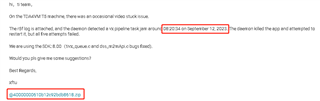
The r5f log is attached, and the daemon detected a vx pipeline task jam around 08:20:34 on September 12, 2023. The daemon killed the app and attempted to restart it, but all five attempts failed.

We are using the SDK: 8.00(tivx_queue.c and dss_m2mApi.c bugs fixed).

Would you pls give me some suggestions? 

Best Regards,

xftu

@40000000610b12c92bdb8618.zip

  • Hi,

    your one of the issue is due to below error. How many instances of DSS M2M driver are you using ? It seems that it has run out of all the instances? 

    How are you killing the application? 

    2023-09-12_08:20:46.94165 [MCU2_0] 351.177253 s: src/drv/m2m/dss_m2mApi.c @ Line 388:
    2023-09-12_08:20:46.94166 [MCU2_0] 351.177301 s: No more instances to allocate...
    2023-09-12_08:20:46.94166 [MCU2_0] 351.177333 s: src/fvid2_drvMgr.c @ Line 759:
    2023-09-12_08:20:46.94166 [MCU2_0] 351.177355 s: Driver create failed!!
    2023-09-12_08:20:46.94166 [MCU2_0] 351.177389 s: VX_ZONE_ERROR:[tivxDisplayM2MDrvCfg:907] : Display M2M Create Failed!!!
    2023-09-12_08:20:46.94166 [MCU2_0] 351.177433 s: VX_ZONE_ERROR:[tivxDisplayM2MCreate:380] Unable to allocate local memory

    Regards,

    Brijesh

  • hi Brijesh,

    The answers to the questions is as follows,
    How many instances of DSS M2M driver are you using ? It seems that it has run out of all the instances?
    ----Two instances is used(TIVX_TARGET_DISPLAY_M2M1 and TIVX_TARGET_DISPLAY_M2M2);
    How are you killing the application?
    ----Send TIVX_ CMD_ NODE_ The DELETE command releases resources for the corresponding node.

    Additionally, the video was already stuck before killing the application.

    Best Regards,

    xftu

  • Hi, eftu,

    TIVX_TARGET_DISPLAY_M2M1 and TIVX_TARGET_DISPLAY_M2M2 are not the instances of this node. They are essentially different targets. How many nodes are you creating for these targets? Are these nodes replicated? If they are, how many are they replicated?

    Can you please print some messages in the DSS M2M delete API and see if it is getting called, when killing the application? 

    Regards,

    Brijesh

  • hi Brijesh,

    Four nodes are creating for target TIVX_TARGET_DISPLAY_M2M1 and three of of them are replicated. One node is creating for target TIVX_TARGET_DISPLAY_M2M2.

     print "Dss_m2mDelete call!!!" messages in the DSS M2M delete API,  it is getting called, when killing the application.

    [220101-00:00:48.515] [MCU2_0] 50.846467 s: ==========================================================
    [220101-00:00:48.515] [MCU2_0] 50.846554 s: Capture Status: Instance|1
    [220101-00:00:48.515] [MCU2_0] 50.846595 s: ==========================================================
    [220101-00:00:48.515] [MCU2_0] 50.846631 s: overflowCount: 0
    [220101-00:00:48.515] [MCU2_0] 50.846655 s: spuriousUdmaIntrCount: 0
    [220101-00:00:48.515] [MCU2_0] 50.846681 s: frontFIFOOvflCount: 0
    [220101-00:00:48.515] [MCU2_0] 50.846703 s: crcCount: 0
    [220101-00:00:48.515] [MCU2_0] 50.846722 s: eccCount: 0
    [220101-00:00:48.515] [MCU2_0] 50.846744 s: correctedEccCount: 0
    [220101-00:00:48.515] [MCU2_0] 50.846768 s: dataIdErrorCount: 0
    [220101-00:00:48.515] [MCU2_0] 50.846790 s: invalidAccessCount: 0
    [220101-00:00:48.515] [MCU2_0] 50.846813 s: invalidSpCount: 0
    [220101-00:00:48.515] [MCU2_0] 50.846838 s: strmFIFOOvflCount[0]: 0
    [220101-00:00:48.515] [MCU2_0] 50.846864 s: strmFIFOOvflCount[1]: 1
    [220101-00:00:48.515] [MCU2_0] 50.846889 s: strmFIFOOvflCount[2]: 83
    [220101-00:00:48.515] [MCU2_0] 50.846913 s: strmFIFOOvflCount[3]: 14
    [220101-00:00:48.515] [MCU2_0] 50.846953 s: Channel Num | Frame Queue Count | Frame De-queue Count | Frame Drop Count | Error Frame Count |
    [220101-00:00:48.515] [MCU2_0] 50.847005 s: 0 | 996 | 996 | 5 | 0 |
    [220101-00:00:48.515] [MCU2_0] 50.847056 s: 1 | 996 | 996 | 5 | 0 |
    [220101-00:00:48.515] [MCU2_0] 50.847107 s: 2 | 996 | 996 | 5 | 1 |
    [220101-00:00:48.516] [MCU2_0] 50.847158 s: 3 | 996 | 996 | 5 | 1 |
    [220101-00:00:48.526] [MCU2_0] 50.849517 s: ==========================================================
    [220101-00:00:48.526] [MCU2_0] 50.849599 s: Display M2M Status: Instance|0
    [220101-00:00:48.526] [MCU2_0] 50.849640 s: ==========================================================
    [220101-00:00:48.526] [MCU2_0] 50.849679 s: Queue Count: 994
    [220101-00:00:48.526] [MCU2_0] 50.849704 s: De-queue Count: 994
    [220101-00:00:48.526] [MCU2_0] 50.849730 s: Write-back Frames Count: 994
    [220101-00:00:48.526] [MCU2_0] 50.849756 s: Underflow Count: 0
    [220101-00:00:48.526] [MCU2_0] 50.849789 s: src/drv/m2m/dss_m2mApi.c @ Line 579:
    [220101-00:00:48.526] [MCU2_0] 50.849816 s: Dss_m2mDelete call!!!
    [220101-00:00:48.526] [MCU2_0] 50.849917 s: ==========================================================
    [220101-00:00:48.526] [MCU2_0] 50.849971 s: Display M2M Status: Instance|0
    [220101-00:00:48.526] [MCU2_0] 50.850007 s: ==========================================================
    [220101-00:00:48.526] [MCU2_0] 50.850042 s: Queue Count: 994
    [220101-00:00:48.526] [MCU2_0] 50.850064 s: De-queue Count: 994
    [220101-00:00:48.526] [MCU2_0] 50.850088 s: Write-back Frames Count: 994
    [220101-00:00:48.526] [MCU2_0] 50.850113 s: Underflow Count: 0
    [220101-00:00:48.526] [MCU2_0] 50.850137 s: src/drv/m2m/dss_m2mApi.c @ Line 579:
    [220101-00:00:48.526] [MCU2_0] 50.850162 s: Dss_m2mDelete call!!!
    [220101-00:00:48.526] [MCU2_0] 50.850249 s: ==========================================================
    [220101-00:00:48.526] [MCU2_0] 50.850301 s: Display M2M Status: Instance|0
    [220101-00:00:48.526] [MCU2_0] 50.850456 s: ==========================================================
    [220101-00:00:48.526] [MCU2_0] 50.850500 s: Queue Count: 994
    [220101-00:00:48.526] [MCU2_0] 50.850526 s: De-queue Count: 994
    [220101-00:00:48.526] [MCU2_0] 50.850552 s: Write-back Frames Count: 994
    [220101-00:00:48.526] [MCU2_0] 50.850579 s: Underflow Count: 0
    [220101-00:00:48.526] [MCU2_0] 50.850608 s: src/drv/m2m/dss_m2mApi.c @ Line 579:
    [220101-00:00:48.526] [MCU2_0] 50.850634 s: Dss_m2mDelete call!!!
    [220101-00:00:48.526] [MCU2_0] 50.850728 s: ==========================================================
    [220101-00:00:48.526] [MCU2_0] 50.850782 s: Display M2M Status: Instance|0
    [220101-00:00:48.526] [MCU2_0] 50.850819 s: ==========================================================
    [220101-00:00:48.526] [MCU2_0] 50.850856 s: Queue Count: 994
    [220101-00:00:48.526] [MCU2_0] 50.850879 s: De-queue Count: 994
    [220101-00:00:48.527] [MCU2_0] 50.850903 s: Write-back Frames Count: 994
    [220101-00:00:48.527] [MCU2_0] 50.850928 s: Underflow Count: 0
    [220101-00:00:48.527] [MCU2_0] 50.850953 s: src/drv/m2m/dss_m2mApi.c @ Line 579:
    [220101-00:00:48.527] [MCU2_0] 50.850979 s: Dss_m2mDelete call!!!
    [220101-00:00:48.527] [MCU2_0] 50.851613 s: ==========================================================
    [220101-00:00:48.527] [MCU2_0] 50.851693 s: Display M2M Status: Instance|0
    [220101-00:00:48.527] [MCU2_0] 50.851735 s: ==========================================================
    [220101-00:00:48.527] [MCU2_0] 50.851774 s: Queue Count: 991
    [220101-00:00:48.527] [MCU2_0] 50.851799 s: De-queue Count: 991
    [220101-00:00:48.527] [MCU2_0] 50.851825 s: Write-back Frames Count: 991
    [220101-00:00:48.527] [MCU2_0] 50.851850 s: Underflow Count: 0
    [220101-00:00:48.527] [MCU2_0] 50.851880 s: src/drv/m2m/dss_m2mApi.c @ Line 579:
    [220101-00:00:48.527] [MCU2_0] 50.851906 s: Dss_m2mDelete call!!!
    [220101-00:00:48.527] [MCU2_0] 50.852467 s: ==========================================================
    [220101-00:00:48.527] [MCU2_0] 50.852542 s: Csitx Status: Instance|0
    [220101-00:00:48.527] [MCU2_0] 50.852582 s: ==========================================================
    [220101-00:00:48.527] [MCU2_0] 50.852623 s: FIFO Overflow Count: 0
    [220101-00:00:48.527] [MCU2_0] 50.852660 s: Channel Num | Frame Queue Count | Frame De-queue Count | Frame Repeat Count |
    [220101-00:00:48.527] [MCU2_0] 50.852703 s: 0| 991| 991| 0|

    Best Regards,

    xftu

  • Hi xftu,

    But this is getting called only 5 times But looks like you are creating many instances of this nodes, 3 replicated n-times + 1 + 1. It should be called for even every replicated node. If this delete is not called for every opened node, the next time, it can potentially run out of handles. Please make sure to close all open handles. 

    Regards,

    Brijesh

  • hi Brijesh,

    I didn't express myself clearly.

    The content that I mentioned 

    “Four nodes are creating for target TIVX_TARGET_DISPLAY_M2M1 and three of of them are replicated. One node is creating for target TIVX_TARGET_DISPLAY_M2M2.

    needs to be corrected to

    “One node is creating for target TIVX_TARGET_DISPLAY_M2M1 and it is replicated three times. One node is creating for target TIVX_TARGET_DISPLAY_M2M2.”

    I think this means that a total of five instances of DSS m2m were used.

    Best Regards,

    xftu

  • Hi xftu,

    Can you also check if tivxDispM2mFreeObject API is getting called in tiovx\kernels_j7\hwa\display_m2m\vx_display_m2m_target.c file? This is also important, as it frees up the TIOVX objects.

    Regards,

    Brijesh

  • Hi Brijesh,

    tivxDispM2mFreeObject API is getting called too.

    [220101-00:50:53.087] [MCU2_0] 515.325690 s: ==========================================================
    [220101-00:50:53.087] [MCU2_0] 515.325777 s: Capture Status: Instance|1
    [220101-00:50:53.087] [MCU2_0] 515.325819 s: ==========================================================
    [220101-00:50:53.087] [MCU2_0] 515.325860 s: overflowCount: 0
    [220101-00:50:53.087] [MCU2_0] 515.325885 s: spuriousUdmaIntrCount: 0
    [220101-00:50:53.087] [MCU2_0] 515.325911 s: frontFIFOOvflCount: 0
    [220101-00:50:53.087] [MCU2_0] 515.325934 s: crcCount: 0
    [220101-00:50:53.087] [MCU2_0] 515.325953 s: eccCount: 0
    [220101-00:50:53.087] [MCU2_0] 515.325974 s: correctedEccCount: 0
    [220101-00:50:53.088] [MCU2_0] 515.325997 s: dataIdErrorCount: 0
    [220101-00:50:53.088] [MCU2_0] 515.326021 s: invalidAccessCount: 0
    [220101-00:50:53.088] [MCU2_0] 515.326044 s: invalidSpCount: 0
    [220101-00:50:53.088] [MCU2_0] 515.326068 s: strmFIFOOvflCount[0]: 0
    [220101-00:50:53.088] [MCU2_0] 515.326093 s: strmFIFOOvflCount[1]: 1
    [220101-00:50:53.088] [MCU2_0] 515.326118 s: strmFIFOOvflCount[2]: 83
    [220101-00:50:53.088] [MCU2_0] 515.326144 s: strmFIFOOvflCount[3]: 14
    [220101-00:50:53.088] [MCU2_0] 515.326184 s: Channel Num | Frame Queue Count | Frame De-queue Count | Frame Drop Count | Error Frame Count |
    [220101-00:50:53.088] [MCU2_0] 515.326238 s: 0 | 471 | 471 | 8 | 0 |
    [220101-00:50:53.088] [MCU2_0] 515.326290 s: 1 | 471 | 471 | 8 | 0 |
    [220101-00:50:53.088] [MCU2_0] 515.326342 s: 2 | 471 | 471 | 8 | 1 |
    [220101-00:50:53.088] [MCU2_0] 515.326393 s: 3 | 471 | 471 | 8 | 1 |
    [220101-00:50:53.088] [MCU2_0] 515.328792 s: ==========================================================
    [220101-00:50:53.088] [MCU2_0] 515.328876 s: Display M2M Status: Instance|0
    [220101-00:50:53.088] [MCU2_0] 515.328918 s: ==========================================================
    [220101-00:50:53.088] [MCU2_0] 515.328958 s: Queue Count: 469
    [220101-00:50:53.088] [MCU2_0] 515.328983 s: De-queue Count: 469
    [220101-00:50:53.088] [MCU2_0] 515.329008 s: Write-back Frames Count: 469
    [220101-00:50:53.088] [MCU2_0] 515.329034 s: Underflow Count: 0
    [220101-00:50:53.088] [MCU2_0] 515.329065 s: src/drv/m2m/dss_m2mApi.c @ Line 579:
    [220101-00:50:53.088] [MCU2_0] 515.329092 s: Dss_m2mDelete call!!!
    [220101-00:50:53.088] [MCU2_0] 515.329142 s: VX_ZONE_ERROR:[tivxDispM2mFreeObject:1117] tivxDispM2mFreeObject call!!!
    [220101-00:50:53.088] [MCU2_0] 515.329245 s: ==========================================================
    [220101-00:50:53.088] [MCU2_0] 515.329295 s: Display M2M Status: Instance|0
    [220101-00:50:53.088] [MCU2_0] 515.329333 s: ==========================================================
    [220101-00:50:53.088] [MCU2_0] 515.329368 s: Queue Count: 469
    [220101-00:50:53.088] [MCU2_0] 515.329393 s: De-queue Count: 469
    [220101-00:50:53.088] [MCU2_0] 515.329419 s: Write-back Frames Count: 469
    [220101-00:50:53.088] [MCU2_0] 515.329444 s: Underflow Count: 0
    [220101-00:50:53.088] [MCU2_0] 515.329470 s: src/drv/m2m/dss_m2mApi.c @ Line 579:
    [220101-00:50:53.088] [MCU2_0] 515.329496 s: Dss_m2mDelete call!!!
    [220101-00:50:53.088] [MCU2_0] 515.329533 s: VX_ZONE_ERROR:[tivxDispM2mFreeObject:1117] tivxDispM2mFreeObject call!!!
    [220101-00:50:53.088] [MCU2_0] 515.329736 s: ==========================================================
    [220101-00:50:53.088] [MCU2_0] 515.329797 s: Display M2M Status: Instance|0
    [220101-00:50:53.089] [MCU2_0] 515.329837 s: ==========================================================
    [220101-00:50:53.089] [MCU2_0] 515.329878 s: Queue Count: 469
    [220101-00:50:53.089] [MCU2_0] 515.329902 s: De-queue Count: 469
    [220101-00:50:53.089] [MCU2_0] 515.329927 s: Write-back Frames Count: 469
    [220101-00:50:53.089] [MCU2_0] 515.329953 s: Underflow Count: 0
    [220101-00:50:53.089] [MCU2_0] 515.329980 s: src/drv/m2m/dss_m2mApi.c @ Line 579:
    [220101-00:50:53.089] [MCU2_0] 515.330006 s: Dss_m2mDelete call!!!
    [220101-00:50:53.089] [MCU2_0] 515.330044 s: VX_ZONE_ERROR:[tivxDispM2mFreeObject:1117] tivxDispM2mFreeObject call!!!
    [220101-00:50:53.089] [MCU2_0] 515.330132 s: ==========================================================
    [220101-00:50:53.089] [MCU2_0] 515.330185 s: Display M2M Status: Instance|0
    [220101-00:50:53.089] [MCU2_0] 515.330224 s: ==========================================================
    [220101-00:50:53.089] [MCU2_0] 515.330260 s: Queue Count: 469
    [220101-00:50:53.089] [MCU2_0] 515.330284 s: De-queue Count: 469
    [220101-00:50:53.089] [MCU2_0] 515.330309 s: Write-back Frames Count: 469
    [220101-00:50:53.089] [MCU2_0] 515.330334 s: Underflow Count: 0
    [220101-00:50:53.089] [MCU2_0] 515.330359 s: src/drv/m2m/dss_m2mApi.c @ Line 579:
    [220101-00:50:53.089] [MCU2_0] 515.330385 s: Dss_m2mDelete call!!!
    [220101-00:50:53.089] [MCU2_0] 515.330421 s: VX_ZONE_ERROR:[tivxDispM2mFreeObject:1117] tivxDispM2mFreeObject call!!!
    [220101-00:50:53.089] [MCU2_0] 515.331042 s: ==========================================================
    [220101-00:50:53.089] [MCU2_0] 515.331121 s: Display M2M Status: Instance|0
    [220101-00:50:53.089] [MCU2_0] 515.331164 s: ==========================================================
    [220101-00:50:53.089] [MCU2_0] 515.331206 s: Queue Count: 466
    [220101-00:50:53.089] [MCU2_0] 515.331230 s: De-queue Count: 466
    [220101-00:50:53.089] [MCU2_0] 515.331256 s: Write-back Frames Count: 466
    [220101-00:50:53.089] [MCU2_0] 515.331281 s: Underflow Count: 0
    [220101-00:50:53.089] [MCU2_0] 515.331310 s: src/drv/m2m/dss_m2mApi.c @ Line 579:
    [220101-00:50:53.089] [MCU2_0] 515.331336 s: Dss_m2mDelete call!!!
    [220101-00:50:53.089] [MCU2_0] 515.331399 s: VX_ZONE_ERROR:[tivxDispM2mFreeObject:1117] tivxDispM2mFreeObject call!!!
    [220101-00:50:53.089] [MCU2_0] 515.331900 s: ==========================================================
    [220101-00:50:53.089] [MCU2_0] 515.331977 s: Csitx Status: Instance|0
    [220101-00:50:53.089] [MCU2_0] 515.332017 s: ==========================================================
    [220101-00:50:53.089] [MCU2_0] 515.332055 s: FIFO Overflow Count: 0
    [220101-00:50:53.089] [MCU2_0] 515.332092 s: Channel Num | Frame Queue Count | Frame De-queue Count | Frame Repeat Count |
    [220101-00:50:53.089] [MCU2_0] 515.332134 s: 0| 466| 466| 0|

    Best Regards,

    xftu

  • Hi xftu,

    But as per below error, it seems it is running out of the instances. This means the instance is not getting freed somehow in the previous run. 

    2023-09-12_08:20:46.94165 [MCU2_0] 351.177253 s: src/drv/m2m/dss_m2mApi.c @ Line 388:
    2023-09-12_08:20:46.94166 [MCU2_0] 351.177301 s: No more instances to allocate...

    Can you please add some print in Dss_m2mDelete API in the DSS driver and see if below statement is executed when you are calling delete? 

    instObj->inUse = DSSM2M_DRV_USAGE_STATUS_NOT_USED;

    Regards,

    Brijesh

  • Hi Brijesh,

    Below statement is executed.

    instObj->inUse = DSSM2M_DRV_USAGE_STATUS_NOT_USED;

    [220101-01:02:16.251] [MCU2_0] 3738.361796 s: ==========================================================
    [220101-01:02:16.251] [MCU2_0] 3738.361885 s: Capture Status: Instance|1
    [220101-01:02:16.252] [MCU2_0] 3738.361929 s: ==========================================================
    [220101-01:02:16.252] [MCU2_0] 3738.361972 s: overflowCount: 0
    [220101-01:02:16.252] [MCU2_0] 3738.361999 s: spuriousUdmaIntrCount: 0
    [220101-01:02:16.252] [MCU2_0] 3738.362027 s: frontFIFOOvflCount: 0
    [220101-01:02:16.252] [MCU2_0] 3738.362049 s: crcCount: 0
    [220101-01:02:16.252] [MCU2_0] 3738.362070 s: eccCount: 0
    [220101-01:02:16.252] [MCU2_0] 3738.362093 s: correctedEccCount: 0
    [220101-01:02:16.252] [MCU2_0] 3738.362118 s: dataIdErrorCount: 0
    [220101-01:02:16.252] [MCU2_0] 3738.362144 s: invalidAccessCount: 0
    [220101-01:02:16.252] [MCU2_0] 3738.362168 s: invalidSpCount: 0
    [220101-01:02:16.252] [MCU2_0] 3738.362193 s: strmFIFOOvflCount[0]: 0
    [220101-01:02:16.252] [MCU2_0] 3738.362221 s: strmFIFOOvflCount[1]: 1
    [220101-01:02:16.252] [MCU2_0] 3738.362250 s: strmFIFOOvflCount[2]: 83
    [220101-01:02:16.252] [MCU2_0] 3738.362277 s: strmFIFOOvflCount[3]: 14
    [220101-01:02:16.252] [MCU2_0] 3738.362317 s: Channel Num | Frame Queue Count | Frame De-queue Count | Frame Drop Count | Error Frame Count |
    [220101-01:02:16.252] [MCU2_0] 3738.362371 s: 0 | 522 | 522 | 2 | 0 |
    [220101-01:02:16.252] [MCU2_0] 3738.362425 s: 1 | 522 | 522 | 2 | 0 |
    [220101-01:02:16.252] [MCU2_0] 3738.362478 s: 2 | 522 | 522 | 2 | 1 |
    [220101-01:02:16.252] [MCU2_0] 3738.362532 s: 3 | 522 | 522 | 2 | 1 |
    [220101-01:02:16.252] [MCU2_0] 3738.364890 s: ==========================================================
    [220101-01:02:16.252] [MCU2_0] 3738.364974 s: Display M2M Status: Instance|0
    [220101-01:02:16.252] [MCU2_0] 3738.365019 s: ==========================================================
    [220101-01:02:16.252] [MCU2_0] 3738.365061 s: Queue Count: 520
    [220101-01:02:16.252] [MCU2_0] 3738.365089 s: De-queue Count: 520
    [220101-01:02:16.252] [MCU2_0] 3738.365119 s: Write-back Frames Count: 520
    [220101-01:02:16.252] [MCU2_0] 3738.365149 s: Underflow Count: 0
    [220101-01:02:16.252] [MCU2_0] 3738.365181 s: src/drv/m2m/dss_m2mApi.c @ Line 579:
    [220101-01:02:16.252] [MCU2_0] 3738.365208 s: Dss_m2mDelete call!!!
    [220101-01:02:16.252] [MCU2_0] 3738.365257 s: VX_ZONE_ERROR:[tivxDispM2mFreeObject:1117] tivxDispM2mFreeObject call!!!
    [220101-01:02:16.252] [MCU2_0] 3738.365354 s: ==========================================================
    [220101-01:02:16.252] [MCU2_0] 3738.365402 s: Display M2M Status: Instance|0
    [220101-01:02:16.252] [MCU2_0] 3738.365439 s: ==========================================================
    [220101-01:02:16.252] [MCU2_0] 3738.365477 s: Queue Count: 520
    [220101-01:02:16.252] [MCU2_0] 3738.365501 s: De-queue Count: 520
    [220101-01:02:16.252] [MCU2_0] 3738.365529 s: Write-back Frames Count: 520
    [220101-01:02:16.252] [MCU2_0] 3738.365557 s: Underflow Count: 0
    [220101-01:02:16.253] [MCU2_0] 3738.365585 s: src/drv/m2m/dss_m2mApi.c @ Line 579:
    [220101-01:02:16.253] [MCU2_0] 3738.365611 s: Dss_m2mDelete call!!!
    [220101-01:02:16.253] [MCU2_0] 3738.365650 s: VX_ZONE_ERROR:[tivxDispM2mFreeObject:1117] tivxDispM2mFreeObject call!!!
    [220101-01:02:16.253] [MCU2_0] 3738.366805 s: ==========================================================
    [220101-01:02:16.253] [MCU2_0] 3738.366870 s: Display M2M Status: Instance|0
    [220101-01:02:16.253] [MCU2_0] 3738.366908 s: ==========================================================
    [220101-01:02:16.253] [MCU2_0] 3738.366950 s: Queue Count: 520
    [220101-01:02:16.253] [MCU2_0] 3738.366975 s: De-queue Count: 520
    [220101-01:02:16.253] [MCU2_0] 3738.367003 s: Write-back Frames Count: 520
    [220101-01:02:16.253] [MCU2_0] 3738.367033 s: Underflow Count: 0
    [220101-01:02:16.253] [MCU2_0] 3738.367063 s: src/drv/m2m/dss_m2mApi.c @ Line 579:
    [220101-01:02:16.253] [MCU2_0] 3738.367089 s: Dss_m2mDelete call!!!
    [220101-01:02:16.253] [MCU2_0] 3738.367127 s: VX_ZONE_ERROR:[tivxDispM2mFreeObject:1117] tivxDispM2mFreeObject call!!!
    [220101-01:02:16.253] [MCU2_0] 3738.367215 s: ==========================================================
    [220101-01:02:16.253] [MCU2_0] 3738.367267 s: Display M2M Status: Instance|0
    [220101-01:02:16.253] [MCU2_0] 3738.367305 s: ==========================================================
    [220101-01:02:16.253] [MCU2_0] 3738.367345 s: Queue Count: 520
    [220101-01:02:16.253] [MCU2_0] 3738.367370 s: De-queue Count: 520
    [220101-01:02:16.253] [MCU2_0] 3738.367397 s: Write-back Frames Count: 520
    [220101-01:02:16.253] [MCU2_0] 3738.367425 s: Underflow Count: 0
    [220101-01:02:16.253] [MCU2_0] 3738.367451 s: src/drv/m2m/dss_m2mApi.c @ Line 579:
    [220101-01:02:16.253] [MCU2_0] 3738.367477 s: Dss_m2mDelete call!!!
    [220101-01:02:16.253] [MCU2_0] 3738.367514 s: VX_ZONE_ERROR:[tivxDispM2mFreeObject:1117] tivxDispM2mFreeObject call!!!
    [220101-01:02:16.253] [MCU2_0] 3738.368110 s: ==========================================================
    [220101-01:02:16.253] [MCU2_0] 3738.368189 s: Display M2M Status: Instance|0
    [220101-01:02:16.253] [MCU2_0] 3738.368229 s: ==========================================================
    [220101-01:02:16.253] [MCU2_0] 3738.368270 s: Queue Count: 517
    [220101-01:02:16.253] [MCU2_0] 3738.368297 s: De-queue Count: 517
    [220101-01:02:16.253] [MCU2_0] 3738.368326 s: Write-back Frames Count: 517
    [220101-01:02:16.253] [MCU2_0] 3738.368354 s: Underflow Count: 0
    [220101-01:02:16.253] [MCU2_0] 3738.368386 s: src/drv/m2m/dss_m2mApi.c @ Line 579:
    [220101-01:02:16.253] [MCU2_0] 3738.368412 s: Dss_m2mDelete call!!!
    [220101-01:02:16.253] [MCU2_0] 3738.368457 s: src/drv/m2m/dss_m2mApi.c @ Line 638:
    [220101-01:02:16.253] [MCU2_0] 3738.368487 s: instObj->inUse set to no used!!!
    [220101-01:02:16.253] [MCU2_0] 3738.368533 s: VX_ZONE_ERROR:[tivxDispM2mFreeObject:1117] tivxDispM2mFreeObject call!!!
    [220101-01:02:16.253] [MCU2_0] 3738.368920 s: ==========================================================
    [220101-01:02:16.253] [MCU2_0] 3738.368997 s: Csitx Status: Instance|0
    [220101-01:02:16.253] [MCU2_0] 3738.369032 s: ==========================================================
    [220101-01:02:16.253] [MCU2_0] 3738.369070 s: FIFO Overflow Count: 0
    [220101-01:02:16.254] [MCU2_0] 3738.369108 s: Channel Num | Frame Queue Count | Frame De-queue Count | Frame Repeat Count |
    [220101-01:02:16.254] [MCU2_0] 3738.369152 s: 0| 517| 517| 0|

    In addition, I have verified that the application was killed using the kill command on the command line during normal operation, and the daemon can restart the application normally.

    The situation we found that the application cannot be restarted by the daemon normally was after the video got stuck, so video getting stuck is a more serious problem that we urgently need to solve.

    Best Regards,

    xftu

  • Hi xftu,

    ok then, why is video getting stuck? do you have log on when it is getting stuck? Is R5F still running in this case? 

    Regards,

    Brijesh

  • Hi Brijesh,

    The logs I have collected have been provided as follows. 

    I think R5F is still running, because I saw that even after the video got stuck, the logs were still being recorded.  Do you agree with this viewpoint?

    Best Regards,

    xftu

  • Hi xftu,

    But then is A72 application running fine? Is it getting stuck? Do you have some graph parameters on A72? Because in this case, if A72 stops working or application on A72 stops, then also, video will get stuck. or any other node running on any other core is stopped working?

    Regards,

    Brijesh 

  • Hi Brijesh,

    The answers to the questions you raised are as follows.

    But then is A72 application running fine? Is it getting stuck?

    ----When the video gets stuck, the A72 application still has log output, so the application runs fine.

    Do you have some graph parameters on A72?

    ----Yes, there are three graph parameters on A72.

    or any other node running on any other core is stopped working?

    ----I'm not sure about this. Is there any log that can help answer this question?

    Best Regards,

    xftu

  • Hi xftu,

    Can you press 'p' on the console and get the performance stats? That can help to know if any of the core is hang/stuck.

    Regards,

    Brijesh

  • Hi Brijesh,

    The A72 terminal runs our application, and pressing the p button will not cause any special actions.

    Best Regards,

    xftu

  • Hi xftu,.

    We need to get the performance status to know which cores are running or getting stuck. or if there is any other way in your application to know the status of the other cores, it would be useful.

    Regards,

    Brijesh

  • Hi Brijesh,

    At present, there is no way for application to obtain the status of other cores. I will add ways to obtain it. However, the occurrence of problems is probabilistic, so after adding the function of obtaining other core states, it is necessary to wait until the problem occurs before there are new logs.

    Are there any other clues that can be investigated in the current state?

    Best Regards,

    xftu

  • Hi xftu,

    Unfortunately, unless we know the status of the cores, participating in the usecase, i can't say why the application is stuck. The A72 and main domain R5F, from where most of the HW accelerators are running, seem to be running fine, this means either capture stopped working or some other core that you are using in your application has stopped working. 

    Can you please check if your capture is still working?

    Regards,

    Brijesh

  • Hi Brijesh,

    From the existing logs, it is not possible to determine whether the capture is working properly. 

    in addition,I am reviewing the application code and conduct stress testing. If you have any suggestions for checking the code or how to conduct testing that can help solve this problem, please let me know.

    Best Regards,

    xftu

  • Hi dftu,

    If you can connect CCS to mcu2_0, put a breakpoint on capture completion callback, then we can say it is working fine..  or if you can add some instrumentation code to confirm working of capture, it would be useful.

    Regards,

    Brijesh