Because of the holidays, TI E2E™ design support forum responses will be delayed from Dec. 25 through Jan. 2. Thank you for your patience.

This thread has been locked.

If you have a related question, please click the "Ask a related question" button in the top right corner. The newly created question will be automatically linked to this question.

TDA4VM: FreeRTOS Awarness using T32-Lauterbach

Part Number: TDA4VM
Other Parts Discussed in Thread: DRA829

Hello TI,

I am experimenting with FreeRTOS awarness in T32 and I notice that any "Display of kernel resources" for FreeRTOS (task list, semaphores, timers, etc) are not updated on the fly, but only after stopping CPU execution.

For that use case I configure DAP and remap TCM just using script provided to configure properly ("dra829_tda4_runtime_memory_access", by )

In order to not have issues with SMP restriction,

I assign just one core to slave instance:
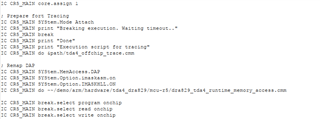
Could it be any problem with addresses of remapped in script? Could you point to documentation to understand better allocation of TCMA/B, the remapped areas and other stuff to be clever in the understanding?

In other hand, and to complement info, I would like use PERF task in trace method, but it is not working, receiving errors of "virtual memory content, not valid at address unknown" that I suspect is for same issue, variables of current task are not accesible in runtime.

It would be great to see FreeRTOS resources at runtime

BR

  • Hello Pablo,

    -0-

    The dapremap gives a useable path to the TCM memories over the system bus.  This will make things like "Var.view %E %SpotLight <var expression>" work at run time if they are resident in the TCM.   Usually there are update issues for accesses in DDR if the R5's MPU marks a region as cached.  Making things as write-through can be a work around.  The awareness will have a few levels of indirection and the 0xAxxxxxxx addresses likely are all cached in the captured pictures.

    -1-

    For PERF, if the task.config(magic) area is marked as write-through as an MPU region the existing script can be used.

    To keep cache fully enabled and to just get task info, using the later stage etm logic (instead of a cpu level watchpoint) can work (with a recent build) for example:

        Break.Set task.config(magic) /Write /TraceEnable
        PERF.Mode TASK
        PERF.Method Trace
        PERF.ListTASK
        PERF.Arm

    I did see the above work as long as tasks are getting scheduled.  If the scheduling stops then the live update stops as the magic never changes.

    -2-

    For profiling on the r5, you can use ETM native reports, snooper reports, or perf reports.  Each gives some different angles.  In each one some thought has to be given to what is being viewed and if copy-back caching can mess things up.   If you only watched TCM (or non-cached things) there is no issue.  For selective watches, using the ETM logic can work for a run time view, where a AXI-AP (DAP) view from the debugger can't due to coherency (if copy-back cache is on).

    -3-

    In the end Lauterbach needs to advise about what builds work for run time viewing of some of these features.  I think the -1- method worked at 02/2023 but was broke briefly in an interm build, but it works today again in a mostly 09/2023 build.  

    Regards,
    Richard W.
  • Hello, Richard

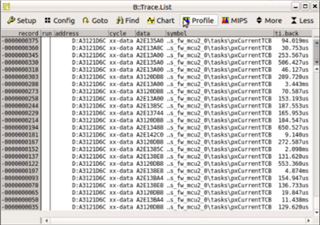
    Finally, I have been able to get PERF task data preparing script with your commands. However I have detected that Trace list is not available even I disable PERF and configurein  in different method than "trace".

    I have prepared one video where you can see scripts content that I am using and the behavior obeserved in T·" (notice that TASK performance is not updated till I run an Linux app that interacts with core R5F, as you warned in "If the scheduling stops then the live update stops as the magic never changes.")

    PERF_traces.zip

    (The file is password protected)

    How can we swap to both anaylsis in run time or, at least, after STOP and GO? (I mean, having the chance to see task performance and analysis of trace list for funcion execution path)

    Many thanks

  • Hello Pablo,

    The command I gave is a way to get task statistics and likely won't give detailed functional level reports. 

    PERF and Snooper are sample based engines.  You can sample a PC, to get functional reports.   The use of 'trace' in sample based methods just inspects 'bursts' of trace and it looks for key markers.  When you tell it to trace on task.config(magic) it happens to sample a trace bust which contains task switches.

    If you use the ETM engine and the offchip trace reports you can get 'full coverage' and you don't have to endure sample based constraints.  You are limited by your off-chip buffer receiver size.  For task based states you can add some filters to get a long time. Most "full (not sample)" ETM results require a stop (or trace.off at least) to view their results.  However... if you have a USB3 connection, you maybe able to use "stream" mode which uses the trace receiver as a FIFO to your harddrive.  This allows for huge captures and it has some 'spy mode' reports which are run time (not needing a stop).    If you research and ask questions around those hints you probably can find some very good development boosts.   I am not a FreeRTOS expert and most of whatever I've enabled matches with what I've used (and found useful) for other HLOS or RTOS in the past, as such some of what I am relaying may need some refinement for you to practically use in that environment.

    For each report type (full or sample based) for processor profiling (trace.ETM, PERF, Snooper) I have seen reports working. The main catch has been considering how to factor in cache coherency issues vs. the underlying mechanism.  Additionally, I do use CPTracer2 probes and 'sometimes' STM to provide other views.  Using CIProbe also is useful using symbolic triggers. 

    Regards,
    Richard W.
  • Hello Pablo,

    I made a short video to show what a working scenario is for perf.method.trace with per.listtask. 

    When profiling, at a high level, I first run a snooper with pc sample in parallel with etm.  This gives a long run sample based picture with a high detail last few moments picture.  From there I might run perf views (task and function) then do deeper inspections with etm.

    Regards,
    Richard W.
  • Hi 

    Pablo and I are looking at your comments and we have some further questions:

    1. We understand that different approaches give us different views of the problem, but would it be possible to have a working configuration with TRACE.Method CAnalyzer and PERF.Method Trace (sampling at task.config(magic)). By this, I mean, if we disable PERF, is it possible to see then TRACE working without seeing only the changes of task.config(magic) [We understand this is happening because of the Break.Set task.config(magic) /Write /TraceEnable statement]? Is there a way to say that this Break.Set task.config(magic) /Write /TraceEnable statement only applies to PERF?

    2. We don't manage to get PERF using TRACE.Method Onchip at all (we only get results for Offchip). Is there any further change that you have made in order to make this work?

    Many thanks in advance,

    Mònica

  • Hello Mònica,

    On 1) if  you delete the aforementioned breakpoint the trace should work fine when PERF is disabled.  Through scripts (cmm or python) you could create flows which create setups for different usage scenarios.

    On 2) I didn't really do anything special to get on chip working.  I did not have my canalyzer hooked up when trying, perhaps there was some transition issue when switching methods.  Sometimes a 'traceconnect' is needed when switching sources, sometimes I need this with systemtrace tracers (STM and others) but not usually the trace ones.   If you concurrently collect processor and system trace usually you have both trace and systemtrace top level windows open.

    Questions about which are tool centric (as opposed to TI-SOC centric) typically are better handled by Lauterbach engineers.  I can pass on a recommendation or something which I find works for me, but I can't well map back issues to your specific tool versions.  For the tests I did here I used Software Version: N.2023.10.000163576.

    Regards,
    Richard W.
  • Thanks for support.

    Just deleting/disabling the breakpoint is enough to recover Trace decoding. We did.

    We will also investigate why on-chip is not working properly in our setup (we will also contact with LB).

    About your commet

     Usually there are update issues for accesses in DDR if the R5's MPU marks a region as cached.  Making things as write-through can be a work around.  The awareness will have a few levels of indirection and the 0xAxxxxxxx addresses likely are all cached in the captured pictures.

    How can we confirm the memoiy areas  are cached and how go ahead in write-through workaround?

    We ask you some aspects of more T32-Lauterbach related instead of LB support becasue, honestly, your support is being more faster (and detailed) than we are having with the local provider. 

    Many thanks 

  • Hello Pablo,

    The fast way to check the cache settings for an R5 is to use the percortexr5.per file.  At run time it will fully decode the R5 MPU regions.  Many RTOS will use a static mapping here so sampling once at run time is enough to know.  Some RTOS will dynamically change mappings so extra care would be needed.  The MPU mapping scheme is detailed in the ARM TRM.  The summary is you can enable segments exactly as you use them, or you can map 'overlapping' regions knowing that higher number MPU regions will have priority over lower numbered ones.  Often a specific mapping is in a high number and a catch all is in lower mappings.   For a hack you can change these on the fly in the debugger and see obvious differences in performance in code.  One last note is TCM addresses resolve before the MPU so they will never be cached even if the range is set as such in the MPU. 

    Regards,
    Richard W.