This thread has been locked.

If you have a related question, please click the "Ask a related question" button in the top right corner. The newly created question will be automatically linked to this question.

TDA4VE-Q1: GPU 3D model rendering

Part Number: TDA4VE-Q1

Hi,

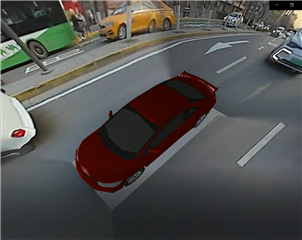
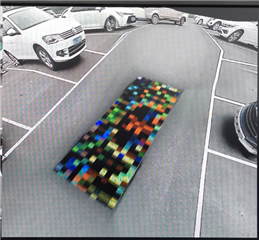
When I use GPU to render 3D car model, there will be an error, I hope to get your help, the effect is as shown in the following picture, log.txt is the log saved at runtime.

sdk used:

ti-processor-sdk-linux-adas-j721s2-evm-09_00_00_08

ti-processor-sdk-rtos-j721s2-evm-09_00_00_02

[ 2596.888313] PVR_K:  220: ------------[ PVR DBG: START (High) ]------------
[ 2596.899561] PVR_K:  220: OS kernel info: Linux 6.1.33-g8f7f371be2 #1 SMP PREEMPT Fri Jul 14 00:39:55 UTC 2023 aarch64
[ 2596.915567] PVR_K:  220: DDK info: Rogue_DDK_Linux_WS rogueddk 23.1@6404501 (release) j721s2_linux
[ 2596.925625] PVR_K:  220: Time now: 2596925615us
[ 2596.935550] PVR_K:  220: Services State: OK
[ 2596.943554] PVR_K:  220: Server Errors: 0
[ 2596.947930] PVR_K:  220: Connections Device ID:0(128) P1282-V1282-T1292-vx_app_adc_perc
[ 2596.959607] PVR_K:  220: ------[ Driver Info ]------
[ 2596.966872] PVR_K:  220: Comparison of UM/KM components: MATCHING
[ 2596.973503] PVR_K:  220: KM Arch: 64 Bit
[ 2596.978261] PVR_K:  220: UM Connected Clients: 64 Bit
[ 2596.983796] PVR_K:  220: UM info: 23.1 @  6404501 (release) build options: 0x80000810
[ 2596.992138] PVR_K:  220: KM info: 23.1 @  6404501 (release) build options: 0x00000810
[ 2597.000318] PVR_K:  220: Window system: lws-generic
[ 2597.005694] PVR_K:  220: ------[ Server Thread Summary ]------
[ 2597.011898] PVR_K:  220:   pvr_defer_free : Running
[ 2597.017176] PVR_K:  220:     Number of deferred cleanup items: QUEUED: 00000  CONNECTION : 00000 MMU : 00000 OSMEM : 00000 PMR : 00000
[ 2597.029764] PVR_K:  220:     Number of deferred cleanup items dropped after retry limit reached : 0
[ 2597.039335] PVR_K:  220:   pvr_device_wdg : Running
[ 2597.044559] PVR_K:  220: ------[ RGX Device ID:0 Start ]------
[ 2597.050797] PVR_K:  220: ------[ RGX Info ]------
[ 2597.055981] PVR_K:  220: Device Node (Info): 000000008e670aea (000000006814b9b3)
[ 2597.063921] PVR_K:  220:     DevmemHistoryRecordStats - None
[ 2597.070054] PVR_K:  220: RGX BVNC: 36.53.104.796 (rogue)
[ 2597.083580] PVR_K:  220: RGX Device State: Active
[ 2597.088572] PVR_K:  220: RGX Power State: ON
[ 2597.093015] PVR_K:  220: FW info: 23.1 @  6404501 (release) build options: 0x80000810
[ 2597.100949] PVR_K:  220: TRP: HW support - Yes; SW disabled
[ 2597.106616] PVR_K:  220: WGP: HW support - Yes; SW disabled
[ 2597.112262] PVR_K:  220: BIF0 - OK
[ 2597.115724] PVR_K:  220: BIF1 - OK
[ 2597.119114] PVR_K:  220: FWCORE - OK
[ 2597.122807] PVR_K:  220: RGX FW State: OK (HWRState 0x00000001: HWR OK;)
[ 2597.129598] PVR_K:  220: RGX FW Power State: RGXFWIF_POW_IDLE (APM enabled: 1 ok, 0 denied, 0 non-idle, 18856 retry, 0 other, 18857 total. Latency: 100 ms)
[ 2597.143594] PVR_K:  220: RGX DVFS: 0 frequency changes. Current frequency: 799.974 MHz (sampled at 2596830242408 ns). FW frequency: 800.000 MHz.
[ 2597.156644] PVR_K:  220: RGX FW OS 0 - State: active; Freelists: Ok; Priority: 0; Isolation group: 0; MTS on;
[ 2597.166628] PVR_K:  220: Number of HWR: GP(0/0+0), 2D(0/0+0), TA(2/2+0), 3D(0/0+0), CDM(0/0+0), RAY(0/0+0), TA2(0/0+0), FALSE(0,0,0,0,0,0,0)
[ 2597.179472] PVR_K:  220: DM 0 (GP)
[ 2597.182951] PVR_K:  220: DM 1 (HWRflags 0x00000000: working;)
[ 2597.188760] PVR_K:  220: DM 2 (HWRflags 0x00000000: working;)
[ 2597.194571] PVR_K:  220:   Recovery 1: Core = 0, PID = 1282 / vx_app_adc_perc, frame = 0, HWRTData = 0x60032900, EventStatus = 0x00000000, Guilty Lockup
[ 2597.208273] PVR_K:  220:               CRTimer = 0x00000000E2CC, OSTimer = 2596.848685887, CyclesElapsed = 36864
[ 2597.218534] PVR_K:  220:               PreResetTimeInCycles = 32256, HWResetTimeInCycles = 32768, FreelistReconTimeInCycles = 6149888, TotalRecoveryTimeInCycles = 6214912
[ 2597.233795] PVR_K:  220:     BIF0 - FAULT:
[ 2597.237945] PVR_K:  220:       * MMU status (0x0000000000002001): PC = 2, Page Size = 0 (Page Table).
[ 2597.247219] PVR_K:  220:       * Request (0x00101480000a3870): MCU PDS USCA (-), Reading from 0x80000A3870.
[ 2597.257325] PVR_K:  220:     PCE for index 512 = 0x08bf5e91 and is valid
[ 2597.264177] PVR_K:  220:     PDE for index 0 = 0x00000008bf5e8001 and is valid
[ 2597.271491] PVR_K:  220:     PT index (163) out of bounds (0)
[ 2597.277313] PVR_K:  220:   Recovery 2: Core = 0, PID = 1282 / vx_app_adc_perc, frame = 0, HWRTData = 0x60032800, EventStatus = 0x00000000, Guilty Lockup
[ 2597.291032] PVR_K:  220:               CRTimer = 0x00000004F747, OSTimer = 2596.934252508, CyclesElapsed = 35840
[ 2597.301280] PVR_K:  220:               PreResetTimeInCycles = 30720, HWResetTimeInCycles = 33024, FreelistReconTimeInCycles = 3233024, TotalRecoveryTimeInCycles = 3296768
[ 2597.316562] PVR_K:  220:     BIF0 - FAULT:
[ 2597.320709] PVR_K:  220:       * MMU status (0x0000000000002001): PC = 2, Page Size = 0 (Page Table).
[ 2597.330003] PVR_K:  220:       * Request (0x00101480000a3870): MCU PDS USCA (-), Reading from 0x80000A3870.
[ 2597.339807] PVR_K:  220:     PCE for index 512 = 0x08bf5e91 and is valid
[ 2597.346565] PVR_K:  220:     PDE for index 0 = 0x00000008bf5e8001 and is valid
[ 2597.353832] PVR_K:  220:     PT index (163) out of bounds (0)
[ 2597.359744] PVR_K:  220: DM 3 (HWRflags 0x00000000: working;)
[ 2597.365543] PVR_K:  220: DM 4 (HWRflags 0x00000000: working;)
[ 2597.371349] PVR_K:  220: DM 5 (HWRflags 0x00000000: working;)
[ 2597.377155] PVR_K:  220: DM 6 (HWRflags 0x00000000: working;)
[ 2597.382959] PVR_K:  220: RGX Kernel CCB WO:0x17 RO:0x17
[ 2597.388244] PVR_K:  220: RGX Firmware CCB WO:0x7 RO:0x7
[ 2597.393525] PVR_K:  220: RGX Kernel CCB commands executed = 23
[ 2597.399404] PVR_K:  220: RGX SLR: Forced UFO updates requested = 0
[ 2597.405640] PVR_K:  220: RGX Errors: WGP:0, TRP:0
[ 2597.410392] PVR_K:  220: Thread0: FW IRQ count = 31
[ 2597.415315] PVR_K:  220: Last sampled IRQ count in LISR = 31
[ 2597.421060] PVR_K:  220: FW System config flags = 0x00020000 (Ctx switch options: Medium CSW profile;)
[ 2597.430427] PVR_K:  220: FW OS config flags = 0x0000000F (Ctx switch: TDM; GEOM; 3D; CDM;)
[ 2597.439152] PVR_K:  220: ------[ RGX registers ]------
[ 2597.444395] PVR_K:  220: RGX Register Base Address (Linear):   0x0000000080a6548d
[ 2597.452003] PVR_K:  220: RGX Register Base Address (Physical): 0x4E20000000
[ 2597.460091] PVR_K:  220: CORE_ID__PBVNC                : 0x002400350068031C
[ 2597.468402] PVR_K:  220: DESIGNER_REV_FIELD1           : 0x00000000
[ 2597.474994] PVR_K:  220: DESIGNER_REV_FIELD2           : 0x00000000
[ 2597.481360] PVR_K:  220: CHANGESET_NUMBER              : 0x0000000000000000
[ 2597.488373] PVR_K:  220: MULTICORE_SYSTEM              : 0x00000001
[ 2597.494730] PVR_K:  220: MULTICORE_GPU                 : 0x00000078
[ 2597.501056] PVR_K:  220: CLK_CTRL                      : 0x002AAA002A22AAAA
[ 2597.508075] PVR_K:  220: CLK_STATUS                    : 0x0000000000600000
[ 2597.515091] PVR_K:  220: CLK_CTRL2                     : 0x0000000000000000
[ 2597.522111] PVR_K:  220: CLK_STATUS2                   : 0x0000000000000000
[ 2597.529123] PVR_K:  220: EVENT_STATUS                  : 0x00000000
[ 2597.535443] PVR_K:  220: TIMER                         : 0x00000000001FC009
[ 2597.542450] PVR_K:  220: BIF_FAULT_BANK0_MMU_STATUS    : 0x00000000
[ 2597.548941] PVR_K:  220: BIF_FAULT_BANK0_REQ_STATUS    : 0x0000000000000000
[ 2597.555971] PVR_K:  220: BIF_FAULT_BANK1_MMU_STATUS    : 0x00000000
[ 2597.562291] PVR_K:  220: BIF_FAULT_BANK1_REQ_STATUS    : 0x0000000000000000
[ 2597.569301] PVR_K:  220: BIF_MMU_STATUS                : 0x00000000
[ 2597.575631] PVR_K:  220: BIF_MMU_ENTRY                 : 0x00000000
[ 2597.581941] PVR_K:  220: BIF_MMU_ENTRY_STATUS          : 0x0000000000000000
[ 2597.588956] PVR_K:  220: BIF_STATUS_MMU                : 0x00000000
[ 2597.595267] PVR_K:  220: BIF_READS_EXT_STATUS          : 0x00000000
[ 2597.601586] PVR_K:  220: BIF_READS_INT_STATUS          : 0x00000000
[ 2597.607900] PVR_K:  220: BIFPM_STATUS_MMU              : 0x00000000
[ 2597.614220] PVR_K:  220: BIFPM_READS_EXT_STATUS        : 0x00000000
[ 2597.620540] PVR_K:  220: BIFPM_READS_INT_STATUS        : 0x00000000
[ 2597.626861] PVR_K:  220: BIF_CAT_BASE_INDEX            : 0x0000000000000202
[ 2597.633870] PVR_K:  220: BIF_CAT_BASE0                 : 0x00000008CA053000
[ 2597.640905] PVR_K:  220: BIF_CAT_BASE1                 : 0x0000000000000000
[ 2597.647920] PVR_K:  220: BIF_CAT_BASE2                 : 0x00000008BF5F4000
[ 2597.654932] PVR_K:  220: BIF_CAT_BASE3                 : 0x0000000000000000
[ 2597.661938] PVR_K:  220: BIF_CAT_BASE4                 : 0x0000000000000000
[ 2597.668953] PVR_K:  220: BIF_CAT_BASE5                 : 0x0000000000000000
[ 2597.676166] PVR_K:  220: BIF_CAT_BASE6                 : 0x0000000000000000
[ 2597.683330] PVR_K:  220: BIF_CAT_BASE7                 : 0x0000000000000000
[ 2597.690358] PVR_K:  220: BIF_CTRL_INVAL                : 0x00000000
[ 2597.696689] PVR_K:  220: BIF_CTRL                      : 0x00000000
[ 2597.703032] PVR_K:  220: BIF_PM_CAT_BASE_VCE0          : 0x0000000000000000
[ 2597.710049] PVR_K:  220: BIF_PM_CAT_BASE_TE0           : 0x0000000000000000
[ 2597.717059] PVR_K:  220: BIF_PM_CAT_BASE_ALIST0        : 0x0000000000000000
[ 2597.724077] PVR_K:  220: BIF_PM_CAT_BASE_VCE1          : 0x0000000000000000
[ 2597.731077] PVR_K:  220: BIF_PM_CAT_BASE_TE1           : 0x0000000000000000
[ 2597.738195] PVR_K:  220: BIF_PM_CAT_BASE_ALIST1        : 0x0000000000000000
[ 2597.745221] PVR_K:  220: MULTICORE_GEOMETRY_CTRL_COMMON: 0x00000000
[ 2597.751550] PVR_K:  220: MULTICORE_FRAGMENT_CTRL_COMMON: 0x00000001
[ 2597.757863] PVR_K:  220: MULTICORE_COMPUTE_CTRL_COMMON : 0x00000101
[ 2597.764226] PVR_K:  220: PERF_TA_PHASE                 : 0x00000000
[ 2597.770539] PVR_K:  220: PERF_TA_CYCLE                 : 0x00000000
[ 2597.776862] PVR_K:  220: PERF_3D_PHASE                 : 0x00000000
[ 2597.783171] PVR_K:  220: PERF_3D_CYCLE                 : 0x00000000
[ 2597.789492] PVR_K:  220: PERF_TA_OR_3D_CYCLE           : 0x00000000
[ 2597.795807] PVR_K:  220: PERF_TA_AND_3D_CYCLE          : 0x00000000
[ 2597.802132] PVR_K:  220: PERF_COMPUTE_PHASE            : 0x00000000
[ 2597.808447] PVR_K:  220: PERF_COMPUTE_CYCLE            : 0x00000000
[ 2597.814764] PVR_K:  220: PM_PARTIAL_RENDER_ENABLE      : 0x00000000
[ 2597.821078] PVR_K:  220: ISP_RENDER                    : 0x00000000
[ 2597.827399] PVR_K:  220: TLA_STATUS                    : 0x0000000000000000
[ 2597.834412] PVR_K:  220: MCU_FENCE                     : 0x0000000000000000
[ 2597.841434] PVR_K:  220: VDM_CONTEXT_STORE_STATUS      : 0x00000001
[ 2597.847748] PVR_K:  220: VDM_CONTEXT_STORE_TASK0       : 0x0000000000000000
[ 2597.854758] PVR_K:  220: VDM_CONTEXT_STORE_TASK1       : 0x0000000000000000
[ 2597.861765] PVR_K:  220: VDM_CONTEXT_STORE_TASK2       : 0x0000000000000000
[ 2597.868802] PVR_K:  220: VDM_CONTEXT_RESUME_TASK0      : 0x0000000000000000
[ 2597.875814] PVR_K:  220: VDM_CONTEXT_RESUME_TASK1      : 0x0000000000000000
[ 2597.882827] PVR_K:  220: VDM_CONTEXT_RESUME_TASK2      : 0x0000000000000000
[ 2597.889837] PVR_K:  220: ISP_CTL                       : 0x00000000
[ 2597.896159] PVR_K:  220: ISP_STATUS                    : 0x00000000
[ 2597.902467] PVR_K:  220: MTS_INTCTX                    : 0x00000000
[ 2597.908787] PVR_K:  220: MTS_BGCTX                     : 0x00000000
[ 2597.915096] PVR_K:  220: MTS_BGCTX_COUNTED_SCHEDULE    : 0x00000000
[ 2597.921414] PVR_K:  220: MTS_SCHEDULE                  : 0x00000000
[ 2597.927734] PVR_K:  220: MTS_GPU_INT_STATUS            : 0x00004110
[ 2597.934052] PVR_K:  220: CDM_CONTEXT_STORE_STATUS      : 0x00000000
[ 2597.940723] PVR_K:  220: CDM_CONTEXT_PDS0              : 0x0000000000000000
[ 2597.947882] PVR_K:  220: CDM_CONTEXT_PDS1              : 0x0000000000000000
[ 2597.954948] PVR_K:  220: CDM_TERMINATE_PDS             : 0x0000000000000000
[ 2597.963074] PVR_K:  220: CDM_TERMINATE_PDS1            : 0x0000000000000000
[ 2597.971532] PVR_K:  220: CDM_CONTEXT_LOAD_PDS0         : 0x0000000000000000
[ 2597.978609] PVR_K:  220: CDM_CONTEXT_LOAD_PDS1         : 0x0000000000000000
[ 2597.985631] PVR_K:  220: SIDEKICK_IDLE                 : 0x0000007F
[ 2597.991989] PVR_K:  220: SLC_IDLE                      : 0x000000FF
[ 2597.998310] PVR_K:  220: SLC_STATUS0                   : 0x00000000
[ 2598.004634] PVR_K:  220: SLC_STATUS1                   : 0x0000000000000000
[ 2598.011650] PVR_K:  220: SLC_STATUS2                   : 0x0000000000000000
[ 2598.018663] PVR_K:  220: SLC_CTRL_BYPASS               : 0x00001D1F00000000
[ 2598.025671] PVR_K:  220: SLC_CTRL_MISC                 : 0x0000000000200003
[ 2598.032684] PVR_K:  220: SAFETY_EVENT_STATUS__ROGUEXE  : 0x00000000
[ 2598.038992] PVR_K:  220: MTS_SAFETY_EVENT_ENABLE__ROGUEXE: 0x000000FF
[ 2598.045485] PVR_K:  220: FWCORE_WDT_CTRL               : 0x00001F01
[ 2598.051809] PVR_K:  220: SCRATCH0                      : 0x00000000
[ 2598.058126] PVR_K:  220: SCRATCH1                      : 0x00000000
[ 2598.064439] PVR_K:  220: SCRATCH2                      : 0x00000000
[ 2598.070756] PVR_K:  220: SCRATCH3                      : 0x00000000
[ 2598.077071] PVR_K:  220: SCRATCH4                      : 0x00000000
[ 2598.083386] PVR_K:  220: SCRATCH5                      : 0x00000000
[ 2598.089696] PVR_K:  220: SCRATCH6                      : 0x00000000
[ 2598.096068] PVR_K:  220: SCRATCH7                      : 0x00000000
[ 2598.102391] PVR_K:  220: SCRATCH8                      : 0x00000000
[ 2598.108717] PVR_K:  220: SCRATCH9                      : 0x00000000
[ 2598.115028] PVR_K:  220: SCRATCH10                     : 0x00000000
[ 2598.121350] PVR_K:  220: SCRATCH11                     : 0x00000000
[ 2598.127664] PVR_K:  220: SCRATCH12                     : 0x00000000
[ 2598.133981] PVR_K:  220: SCRATCH13                     : 0x00000000
[ 2598.140302] PVR_K:  220: SCRATCH14                     : 0x00000000
[ 2598.146618] PVR_K:  220: SCRATCH15                     : 0x00000000
[ 2598.152945] PVR_K:  220: FWCORE_MEM_CAT_BASE0          : 0x00000008CA053000
[ 2598.159970] PVR_K:  220: FWCORE_MEM_CAT_BASE1          : 0x0000000000000000
[ 2598.166973] PVR_K:  220: FWCORE_MEM_CAT_BASE2          : 0x00000008BF5F4000
[ 2598.174128] PVR_K:  220: FWCORE_MEM_CAT_BASE3          : 0x0000000000000000
[ 2598.181222] PVR_K:  220: FWCORE_MEM_CAT_BASE4          : 0x0000000000000000
[ 2598.188245] PVR_K:  220: FWCORE_MEM_CAT_BASE5          : 0x0000000000000000
[ 2598.195265] PVR_K:  220: FWCORE_MEM_CAT_BASE6          : 0x0000000000000000
[ 2598.202318] PVR_K:  220: FWCORE_MEM_CAT_BASE7          : 0x0000000000000000
[ 2598.209349] PVR_K:  220: FWCORE_ADDR_REMAP_CONFIG4     : 0x120000E1C0002000
[ 2598.216372] PVR_K:  220: FWCORE_ADDR_REMAP_CONFIG5     : 0x220000E1C001E000
[ 2598.223377] PVR_K:  220: FWCORE_ADDR_REMAP_CONFIG6     : 0x220000E1C0000000
[ 2598.230391] PVR_K:  220: FWCORE_ADDR_REMAP_CONFIG12    : 0x120000E1C0000000
[ 2598.237398] PVR_K:  220: FWCORE_ADDR_REMAP_CONFIG13    : 0x220000E1C0000000
[ 2598.244412] PVR_K:  220: FWCORE_ADDR_REMAP_CONFIG14    : 0x0000000000000000
[ 2598.251410] PVR_K:  220: FWCORE_MEM_FAULT_MMU_STATUS   : 0x00000000
[ 2598.258070] PVR_K:  220: FWCORE_MEM_FAULT_REQ_STATUS   : 0x0000000000000000
[ 2598.265111] PVR_K:  220: FWCORE_MEM_MMU_STATUS         : 0x00000000
[ 2598.271460] PVR_K:  220: FWCORE_MEM_READS_EXT_STATUS   : 0x00000000
[ 2598.277776] PVR_K:  220: FWCORE_MEM_READS_INT_STATUS   : 0x00000000
[ 2598.284097] PVR_K:  220: ---- [ RISC-V internal state ] ----
[ 2598.289805] PVR_K:  220: pc                            : 0x40004004
[ 2598.296129] PVR_K:  220: ra                            : 0x4001B28A
[ 2598.302440] PVR_K:  220: sp                            : 0x50001010
[ 2598.308759] PVR_K:  220: mepc                          : 0x40004004
[ 2598.315070] PVR_K:  220: mcause                        : 0x8000000B
[ 2598.321389] PVR_K:  220: mdseac                        : 0x00000000
[ 2598.327715] PVR_K:  220: mstatus                       : 0x00001888
[ 2598.334035] PVR_K:  220: mie                           : 0x40000888
[ 2598.340346] PVR_K:  220: mip                           : 0x00000000
[ 2598.346663] PVR_K:  220: mscratch                      : 0x00000000
[ 2598.352974] PVR_K:  220: mbvnc0                        : 0x00010001
[ 2598.359390] PVR_K:  220: mbvnc1                        : 0x0032000B
[ 2598.365709] PVR_K:  220: micect                        : 0x10000000
[ 2598.372037] PVR_K:  220: mdcect                        : 0x10000000
[ 2598.378354] PVR_K:  220: mdcrfct                       : 0x10000000
[ 2598.384683] PVR_K:  220: ------[ RGX FW Trace Info ]------
[ 2598.390221] PVR_K:  220: Debug log type: none
[ 2598.394784] PVR_K:  220: RGX FW thread 0: Trace buffer not yet allocated
[ 2598.411501] PVR_K:  220: ------[ Full CCB Status ]------
[ 2598.419511] PVR_K:  220: FWCtx 0x60032400 (TQ_3D-P1282-T1292-vx_app_adc_)
[ 2598.428152] PVR_K:  220:   `--<Empty>
[ 2598.432145] PVR_K:  220: FWCtx 0x60032040 (TA-P1282-T1292-vx_app_adc_per)
[ 2598.439054] PVR_K:  220:   `--<Empty>
[ 2598.443131] PVR_K:  220: FWCtx 0x600320F0 (3D-P1282-T1292-vx_app_adc_per)
[ 2598.450308] PVR_K:  220:   `--<Empty>
[ 2598.454179] PVR_K:  220: ------[ RGX Device ID:0 End ]------
[ 2598.461106] PVR_K:  220: ------[ Device ID: 128 - Phys Heaps ]------
[ 2598.467732] PVR_K:  220: 0x0000000066546cd7 -> PdMs: SYSMEM, Type: UMA, Usage Flags: 0x00000004 (, GPU_LOCAL), Refs: 11, Free Size: 14349422592B, Total Size: 14997512192B
[ 2598.483291] PVR_K:  220: ------[ System Summary Device ID:0 ]------
[ 2598.489920] PVR_K:  220: Device System Power State: ON
[ 2598.495361] PVR_K:  220: MaxHWTOut: 500000us, WtTryCt: 10000, WDGTOut(on,off): (10000ms,3600000ms)
[ 2598.504688] PVR_K:  220: ------[ AppHint Settings ]------
[ 2598.510731] PVR_K:  220:   Build Vars
[ 2598.515344] PVR_K:  220:     EnableTrustedDeviceAceConfig: N
[ 2598.521345] PVR_K:  220:     CleanupThreadPriority: 0x00000005
[ 2598.527664] PVR_K:  220:     WatchdogThreadPriority: 0x00000000
[ 2598.533858] PVR_K:  220:     HWPerfClientBufferSize: 0x000c0000
[ 2598.540075] PVR_K:  220:     DevmemHistoryBufSizeLog2: 0x0000000b
[ 2598.546606] PVR_K:  220:     DevmemHistoryMaxEntries: 0x00002710
[ 2598.552938] PVR_K:  220:   Module Params
[ 2598.557298] PVR_K:  220:     none
[ 2598.560939] PVR_K:  220:   Debug Info Params
[ 2598.565652] PVR_K:  220:     none
[ 2598.569521] PVR_K:  220:   Debug Info Params Device ID: 0
[ 2598.575568] PVR_K:  220:     none
[ 2598.578908] PVR_K:  220: ------[ HTB Log state: Off ]------
[ 2598.585023] PVR_K:  220: ------[ Active Sync Checkpoints ]------
[ 2598.591398] PVR_K:  220: (SyncCP Counts: InUse:2 Max:8)
[ 2598.596993] sw: RM_SWTimeline-vx_app_adc_percep @0 cur=0
[ 2598.602613] ------[ Native Fence Sync: timelines ]------
[ 2598.608025] foreign_sync: @0 ctx=1 refs=1
[ 2598.612409] rogue-ta3d: @0 ctx=3 refs=1
[ 2598.616544] rogue-tq3d: @0 ctx=4 refs=1
[ 2598.620914] QE-ion.out-vx_app_adc_perc-1282: @2 ctx=5 refs=1
[ 2598.627014] V3-ion.out-vx_app_adc_perc-1282: @25 ctx=6 refs=2
[ 2598.632764]  @24: (++) refs=0 fwaddr=0xd0030191 enqueue=1 status=Signalled 24-es3_DoKickTA_26
[ 2598.641809] P3-ion.out-vx_app_adc_perc-1282: @25 ctx=7 refs=1
[ 2598.647906] PVR_K:  220: ------------[ PVR DBG: END ]------------
[ 2598.654279] ------------[ cut here ]------------
[ 2598.658888] WARNING: CPU: 1 PID: 220 at home/edgeaiuser/workspace/edgeai-cicd/workspace/arago-tmp-default-glibc/work/j721s2_evm-oe-linux/ti-img-rogue-driver/23.1.6404501-r0b/git/binary_j721s2_linux_lws-generic_release/target_aarch64/kbuild/services/server/common/pvr_notifier.c:635 PVRSRVDebugRequest+0x574/0x6a0 [pvrsrvkm]
[ 2598.687420] Modules linked in: rpmsg_ctrl rpmsg_char cdns3 ti_am335x_adc omap_rng kfifo_buf cdns_usb_common overlay crct10dif_ce cfg80211 display_connector phy_can_transceiver bluetooth ecdh_generic ecc rfkill cdns_mhdp8546 ti_k3_r5_remoteproc drm_display_helper wave5 drm_kms_helper cfbfillrect videobuf2_dma_contig syscopyarea pvrsrvkm(O) cfbimgblt videobuf2_memops ti_k3_dsp_remoteproc sysfillrect virtio_rpmsg_bus v4l2_mem2mem sysimgblt ti_am335x_tscadc fb_sys_fops cfbcopyarea rpmsg_ns ti_k3_common videobuf2_v4l2 cdns_dphy sa2ul cdns_dphy_rx videobuf2_common m_can_platform m_can videodev pci_j721e_host pci_j721e can_dev pcie_cadence_host mc pcie_cadence cdns3_ti optee_rng pwm_tiehrpwm rng_core cryptodev(O) fuse drm drm_panel_orientation_quirks ipv6
[ 2598.753674] CPU: 1 PID: 220 Comm: pvr_device_wdg Tainted: G           O       6.1.33-g8f7f371be2 #1
[ 2598.762713] Hardware name: Texas Instruments J721S2 EVM (DT)
[ 2598.768361] pstate: 60000005 (nZCv daif -PAN -UAO -TCO -DIT -SSBS BTYPE=--)
[ 2598.775309] pc : PVRSRVDebugRequest+0x574/0x6a0 [pvrsrvkm]
[ 2598.780864] lr : PVRSRVDebugRequest+0x574/0x6a0 [pvrsrvkm]
[ 2598.786416] sp : ffff80000a14bca0
[ 2598.789721] x29: ffff80000a14bca0 x28: 0000000000000000 x27: ffff0008334eab20
[ 2598.796844] x26: ffff0008304df408 x25: ffff0008304dd208 x24: ffff0008304dd320
[ 2598.803969] x23: ffff0008304df520 x22: ffff0008304dd320 x21: 0000000000000002
[ 2598.811097] x20: 0000000000000000 x19: 0000000000000000 x18: 0000000000000000
[ 2598.818223] x17: 0000000000000000 x16: 0000000000000000 x15: 0000ffff9a54e790
[ 2598.825348] x14: 00000000000000e4 x13: 0000000000000001 x12: 0000000000000000
[ 2598.832470] x11: 0000000000000000 x10: 00000000000009b0 x9 : ffff80000a14bb30
[ 2598.839592] x8 : ffff0008318b1850 x7 : ffff000b7e1ae340 x6 : 0000000000000000
[ 2598.846712] x5 : 00000000410fd080 x4 : 0000000000c0000e x3 : 0000000000100000
[ 2598.853836] x2 : 0000000000000000 x1 : 0000000000000000 x0 : ffff0008318b0e40
[ 2598.860962] Call trace:
[ 2598.863406]  PVRSRVDebugRequest+0x574/0x6a0 [pvrsrvkm]
[ 2598.868655]  DevicesWatchdogThread_ForEachVaCb+0x120/0x170 [pvrsrvkm]
[ 2598.875172]  List_PVRSRV_DEVICE_NODE_ForEach_va+0x70/0xac [pvrsrvkm]
[ 2598.881598]  DevicesWatchdogThread+0x9c/0x204 [pvrsrvkm]
[ 2598.886979]  OSThreadRun+0x24/0x60 [pvrsrvkm]
[ 2598.891404]  kthread+0x10c/0x110
[ 2598.894635]  ret_from_fork+0x10/0x20
[ 2598.898207] ---[ end trace 0000000000000000 ]---

  • Hello,

    Thank you for sharing, this looks like a GPU Hardware recovery. Can you please provide the following output after this error happens:

    Run the command 'pvrlogdump' and provide the output of this.

    Here's an FAQ on the GPU related issues: https://e2e.ti.com/support/processors-group/processors/f/processors-forum/1218307/faq-how-can-i-analyze-a-gpu-graphics-process-unit-driver-or-hardware-issue

    Thanks,

    Erick

  • Hello,

    Thank you for your reply. The contents of the 'pvrlogdump_log.txt' file are the output of executing 'pvrlogdump'.

    root@j721s2-evm:/opt/vision_apps/app_adc_perception# pvrlogdump
    Checking driver state ............... initialised
    Checking for debugfs ................ found
    Checking for lockdep ................ not found
    Checking for ftrace ................. not found
    Checking for firmware log groups .... not found
        There are no AppHints enabled in /etc/powervr.ini or in debugfs
        for any of the firmware log groups. Unless 'pvrdebug' tool
        was used for that purpose there will be no information in
        firmware log.
        Please consider enabling some of the firmware log groups
        before the problem occurs.
    
    Dumping data ........................ [   58.646884] PVR_K:  1159: User requested PVR debug info
    [   58.652153] PVR_K:  1159: ------------[ PVR DBG: START (High) ]------------
    [   58.659172] PVR_K:  1159: OS kernel info: Linux 6.1.33-g8f7f371be2 #1 SMP PREEMPT Fri Jul 14 00:39:55 UTC 2023 aarch64
    [   58.669854] PVR_K:  1159: DDK info: Rogue_DDK_Linux_WS rogueddk 23.1@6404501 (release) j721s2_linux
    [   58.679029] PVR_K:  1159: Time now: 58679026us
    [   58.683472] PVR_K:  1159: Services State: OK
    [   58.687733] PVR_K:  1159: Server Errors: 0
    [   58.691823] PVR_K:  1159: Connections Device ID:0(128) P1159-V1159-T1159-pvrdebug
    [   58.699424] PVR_K:  1159: ------[ Driver Info ]------
    [   58.704571] PVR_K:  1159: Comparison of UM/KM components: MATCHING
    [   58.710745] PVR_K:  1159: KM Arch: 64 Bit
    [   58.714745] PVR_K:  1159: UM Connected Clients: 64 Bit
    [   58.719873] PVR_K:  1159: UM info: 23.1 @  6404501 (release) build options: 0x80000810
    [   58.727777] PVR_K:  1159: KM info: 23.1 @  6404501 (release) build options: 0x00000810
    [   58.735676] PVR_K:  1159: Window system: lws-generic
    [   58.740631] PVR_K:  1159: ------[ Server Thread Summary ]------
    [   58.746537] PVR_K:  1159:   pvr_defer_free : Running
    [   58.751494] PVR_K:  1159:     Number of deferred cleanup items: QUEUED: 00000  CONNECTION : 00000 MMU : 00000 OSMEM : 00000 PMR : 00000
    [   58.763652] PVR_K:  1159:     Number of deferred cleanup items dropped after retry limit reached : 0
    [   58.772768] PVR_K:  1159:   pvr_device_wdg : Running
    [   58.777727] PVR_K:  1159: ------[ RGX Device ID:0 Start ]------
    [   58.783634] PVR_K:  1159: ------[ RGX Info ]------
    [   58.788414] PVR_K:  1159: Device Node (Info): 00000000c4f3f783 (00000000700d769c)
    [   58.795881] PVR_K:  1159:     DevmemHistoryRecordStats - None
    [   58.801614] PVR_K:  1159: RGX BVNC: 36.53.104.796 (rogue)
    [   58.807000] PVR_K:  1159: RGX Device State: Active
    [   58.811779] PVR_K:  1159: RGX Power State: OFF
    [   58.816213] PVR_K:  1159: FW info: 23.1 @  6404501 (release) build options: 0x80000810
    [   58.824116] PVR_K:  1159: TRP: HW support - Yes; SW disabled
    [   58.829776] PVR_K:  1159: WGP: HW support - Yes; SW disabled
    [   58.835427] PVR_K:  1159: RGX FW State: OK (HWRState 0x00000001: HWR OK;)
    [   58.842202] PVR_K:  1159: RGX FW Power State: RGXFWIF_POW_OFF (APM enabled: 4 ok, 0 denied, 0 non-idle, 662699 retry, 0 other, 662703 total. Latency: 100 ms)
    [   58.856258] PVR_K:  1159: RGX DVFS: 0 frequency changes. Current frequency: 799.999 MHz (sampled at 55383300430 ns). FW frequency: 800.000 MHz.
    [   58.869098] PVR_K:  1159: RGX FW OS 0 - State: active; Freelists: Ok; Priority: 0; Isolation group: 0; MTS off;
    [   58.879174] PVR_K:  1159: Number of HWR: GP(0/0+0), 2D(0/0+0), TA(53/53+0), 3D(0/0+0), CDM(0/0+0), RAY(0/0+0), TA2(0/0+0), FALSE(0,0,0,0,0,0,0)
    [   58.892040] PVR_K:  1159: DM 0 (GP)
    [   58.895516] PVR_K:  1159: DM 1 (HWRflags 0x00000000: working;)
    [   58.901341] PVR_K:  1159: DM 2 (HWRflags 0x00000000: working;)
    [   58.907165] PVR_K:  1159:   Recovery 1: Core = 0, PID = 1103 / vx_app_adc_perc, frame = 0, HWRTData = 0x60032900, EventStatus = 0x00000000, Guilty Lockup
    [   58.920872] PVR_K:  1159:               CRTimer = 0x000000019115, OSTimer = 50.092036590, CyclesElapsed = 36352
    [   58.930938] PVR_K:  1159:               PreResetTimeInCycles = 32000, HWResetTimeInCycles = 33536, FreelistReconTimeInCycles = 246528, TotalRecoveryTimeInCycles = 312064
    [   58.946076] PVR_K:  1159:     BIF0 - FAULT:
    [   58.950304] PVR_K:  1159:       * MMU status (0x0000000000002001): PC = 2, Page Size = 0 (Page Table).
    [   58.959621] PVR_K:  1159:       * Request (0x00101480000a3870): MCU PDS USCA (-), Reading from 0x80000A3870.
    [   58.969439] PVR_K:  1159:     PCE for index 512 = 0x08b3d9a1 and is valid
    [   58.976217] PVR_K:  1159:     PDE for index 0 = 0x00000008b4f13001 and is valid
    [   58.984892] PVR_K:  1159:     PT index (163) out of bounds (0)
    [   58.990806] PVR_K:  1159:   Recovery 2: Core = 0, PID = 1103 / vx_app_adc_perc, frame = 0, HWRTData = 0x60032800, EventStatus = 0x00000000, Guilty Lockup
    [   59.004777] PVR_K:  1159:               CRTimer = 0x000000068F10, OSTimer = 50.196728357, CyclesElapsed = 37632
    [   59.014862] PVR_K:  1159:               PreResetTimeInCycles = 32768, HWResetTimeInCycles = 33536, FreelistReconTimeInCycles = 6250752, TotalRecoveryTimeInCycles = 6317056
    [   59.030136] PVR_K:  1159:     BIF0 - FAULT:
    [   59.034311] PVR_K:  1159:       * MMU status (0x0000000000002001): PC = 2, Page Size = 0 (Page Table).
    [   59.043601] PVR_K:  1159:       * Request (0x00101480000a3870): MCU PDS USCA (-), Reading from 0x80000A3870.
    [   59.053411] PVR_K:  1159:     PCE for index 512 = 0x08b3d9a1 and is valid
    [   59.060185] PVR_K:  1159:     PDE for index 0 = 0x00000008b4f13001 and is valid
    [   59.067487] PVR_K:  1159:     PT index (163) out of bounds (0)
    [   59.073313] PVR_K:  1159:   Recovery 3: Core = 0, PID = 1103 / vx_app_adc_perc, frame = 0, HWRTData = 0x60032700, EventStatus = 0x00000000, Guilty Lockup
    [   59.087020] PVR_K:  1159:               CRTimer = 0x00000000998A, OSTimer = 51.652920810, CyclesElapsed = 33024
    [   59.097087] PVR_K:  1159:               PreResetTimeInCycles = 31488, HWResetTimeInCycles = 32000, FreelistReconTimeInCycles = 223488, TotalRecoveryTimeInCycles = 286976
    [   59.112180] PVR_K:  1159:     BIF0 - FAULT:
    [   59.116353] PVR_K:  1159:       * MMU status (0x0000000000001001): PC = 1, Page Size = 0 (Page Table).
    [   59.125644] PVR_K:  1159:       * Request (0x00101480000a3870): MCU PDS USCA (-), Reading from 0x80000A3870.
    [   59.135452] PVR_K:  1159:     No live host MMU data available
    [   59.141191] PVR_K:  1159:   Recovery 4: Core = 0, PID = 1103 / vx_app_adc_perc, frame = 0, HWRTData = 0x60032A00, EventStatus = 0x00000000, Guilty Lockup
    [   59.154906] PVR_K:  1159:               CRTimer = 0x00000004AD50, OSTimer = 51.738426730, CyclesElapsed = 36352
    [   59.164973] PVR_K:  1159:               PreResetTimeInCycles = 32000, HWResetTimeInCycles = 32512, FreelistReconTimeInCycles = 229120, TotalRecoveryTimeInCycles = 293632
    [   59.180067] PVR_K:  1159:     BIF0 - FAULT:
    [   59.184243] PVR_K:  1159:       * MMU status (0x0000000000001001): PC = 1, Page Size = 0 (Page Table).
    [   59.193530] PVR_K:  1159:       * Request (0x00101480000a3870): MCU PDS USCA (-), Reading from 0x80000A3870.
    [   59.203340] PVR_K:  1159:     No live host MMU data available
    [   59.209078] PVR_K:  1159:   Recovery 5: Core = 0, PID = 1103 / vx_app_adc_perc, frame = 0, HWRTData = 0x60032900, EventStatus = 0x00000000, Guilty Lockup
    [   59.222785] PVR_K:  1159:               CRTimer = 0x00000008494C, OSTimer = 51.814119530, CyclesElapsed = 36608
    [   59.232853] PVR_K:  1159:               PreResetTimeInCycles = 33280, HWResetTimeInCycles = 32512, FreelistReconTimeInCycles = 4423936, TotalRecoveryTimeInCycles = 4489728
    [   59.248123] PVR_K:  1159:     BIF0 - FAULT:
    [   59.252298] PVR_K:  1159:       * MMU status (0x0000000000001001): PC = 1, Page Size = 0 (Page Table).
    [   59.261590] PVR_K:  1159:       * Request (0x00101480000a3870): MCU PDS USCA (-), Reading from 0x80000A3870.
    [   59.271409] PVR_K:  1159:     No live host MMU data available
    [   59.277146] PVR_K:  1159:   Recovery 6: Core = 0, PID = 1103 / vx_app_adc_perc, frame = 0, HWRTData = 0x60032800, EventStatus = 0x00000000, Guilty Lockup
    [   59.290859] PVR_K:  1159:               CRTimer = 0x0000000C408D, OSTimer = 51.897289130, CyclesElapsed = 34304
    [   59.300927] PVR_K:  1159:               PreResetTimeInCycles = 30976, HWResetTimeInCycles = 32512, FreelistReconTimeInCycles = 233984, TotalRecoveryTimeInCycles = 297472
    [   59.316023] PVR_K:  1159:     BIF0 - FAULT:
    [   59.320195] PVR_K:  1159:       * MMU status (0x0000000000001001): PC = 1, Page Size = 0 (Page Table).
    [   59.329482] PVR_K:  1159:       * Request (0x00101480000a3870): MCU PDS USCA (-), Reading from 0x80000A3870.
    [   59.339291] PVR_K:  1159:     No live host MMU data available
    [   59.345027] PVR_K:  1159:   Recovery 7: Core = 0, PID = 1103 / vx_app_adc_perc, frame = 0, HWRTData = 0x60032700, EventStatus = 0x00000000, Guilty Lockup
    [   59.358734] PVR_K:  1159:               CRTimer = 0x0000000F5918, OSTimer = 51.962214250, CyclesElapsed = 37376
    [   59.368799] PVR_K:  1159:               PreResetTimeInCycles = 34304, HWResetTimeInCycles = 33024, FreelistReconTimeInCycles = 243456, TotalRecoveryTimeInCycles = 310784
    [   59.383895] PVR_K:  1159:     BIF0 - FAULT:
    [   59.388068] PVR_K:  1159:       * MMU status (0x0000000000001001): PC = 1, Page Size = 0 (Page Table).
    [   59.397356] PVR_K:  1159:       * Request (0x00101480000a3870): MCU PDS USCA (-), Reading from 0x80000A3870.
    [   59.407163] PVR_K:  1159:     No live host MMU data available
    [   59.412902] PVR_K:  1159:   Recovery 8: Core = 0, PID = 1103 / vx_app_adc_perc, frame = 0, HWRTData = 0x60032A00, EventStatus = 0x00000000, Guilty Lockup
    [   59.426610] PVR_K:  1159:               CRTimer = 0x00000012EF45, OSTimer = 52.037431210, CyclesElapsed = 36352
    [   59.436677] PVR_K:  1159:               PreResetTimeInCycles = 30208, HWResetTimeInCycles = 32768, FreelistReconTimeInCycles = 225792, TotalRecoveryTimeInCycles = 288768
    [   59.451771] PVR_K:  1159:     BIF0 - FAULT:
    [   59.455944] PVR_K:  1159:       * MMU status (0x0000000000001001): PC = 1, Page Size = 0 (Page Table).
    [   59.465230] PVR_K:  1159:       * Request (0x00101480000a3870): MCU PDS USCA (-), Reading from 0x80000A3870.
    [   59.475036] PVR_K:  1159:     No live host MMU data available
    [   59.480769] PVR_K:  1159:   Recovery 46: Core = 0, PID = 1103 / vx_app_adc_perc, frame = 0, HWRTData = 0x60032800, EventStatus = 0x00000000, Guilty Lockup
    [   59.494570] PVR_K:  1159:                CRTimer = 0x00000092B302, OSTimer = 54.716849130, CyclesElapsed = 70400
    [   59.504725] PVR_K:  1159:                PreResetTimeInCycles = 38656, HWResetTimeInCycles = 32768, FreelistReconTimeInCycles = 324608, TotalRecoveryTimeInCycles = 396032
    [   59.519908] PVR_K:  1159:     BIF0 - FAULT:
    [   59.524082] PVR_K:  1159:       * MMU status (0x0000000000001001): PC = 1, Page Size = 0 (Page Table).
    [   59.533373] PVR_K:  1159:       * Request (0x00101480000a3870): MCU PDS USCA (-), Reading from 0x80000A3870.
    [   59.543181] PVR_K:  1159:     No live host MMU data available
    [   59.548915] PVR_K:  1159:   Recovery 47: Core = 0, PID = 1103 / vx_app_adc_perc, frame = 0, HWRTData = 0x60032700, EventStatus = 0x00000000, Guilty Lockup
    [   59.562708] PVR_K:  1159:                CRTimer = 0x000000961653, OSTimer = 54.787899690, CyclesElapsed = 36864
    [   59.572860] PVR_K:  1159:                PreResetTimeInCycles = 33792, HWResetTimeInCycles = 34048, FreelistReconTimeInCycles = 309504, TotalRecoveryTimeInCycles = 377344
    [   59.588041] PVR_K:  1159:     BIF0 - FAULT:
    [   59.592213] PVR_K:  1159:       * MMU status (0x0000000000001001): PC = 1, Page Size = 0 (Page Table).
    [   59.601547] PVR_K:  1159:       * Request (0x00101480000a3870): MCU PDS USCA (-), Reading from 0x80000A3870.
    [   59.611364] PVR_K:  1159:     No live host MMU data available
    [   59.617118] PVR_K:  1159:   Recovery 48: Core = 0, PID = 1103 / vx_app_adc_perc, frame = 0, HWRTData = 0x60032A00, EventStatus = 0x00000000, Guilty Lockup
    [   59.630918] PVR_K:  1159:                CRTimer = 0x000000997161, OSTimer = 54.858273450, CyclesElapsed = 69888
    [   59.641072] PVR_K:  1159:                PreResetTimeInCycles = 43776, HWResetTimeInCycles = 34560, FreelistReconTimeInCycles = 240640, TotalRecoveryTimeInCycles = 318976
    [   59.656254] PVR_K:  1159:     BIF0 - FAULT:
    [   59.660427] PVR_K:  1159:       * MMU status (0x0000000000001001): PC = 1, Page Size = 0 (Page Table).
    [   59.669714] PVR_K:  1159:       * Request (0x00101480000a3870): MCU PDS USCA (-), Reading from 0x80000A3870.
    [   59.679538] PVR_K:  1159:     No live host MMU data available
    [   59.685274] PVR_K:  1159:   Recovery 49: Core = 0, PID = 1103 / vx_app_adc_perc, frame = 0, HWRTData = 0x60032900, EventStatus = 0x00000000, Guilty Lockup
    [   59.699069] PVR_K:  1159:                CRTimer = 0x0000009CCEC5, OSTimer = 54.928838570, CyclesElapsed = 48128
    [   59.709223] PVR_K:  1159:                PreResetTimeInCycles = 60928, HWResetTimeInCycles = 40192, FreelistReconTimeInCycles = 273152, TotalRecoveryTimeInCycles = 374272
    [   59.724408] PVR_K:  1159:     BIF0 - FAULT:
    [   59.728581] PVR_K:  1159:       * MMU status (0x0000000000001001): PC = 1, Page Size = 0 (Page Table).
    [   59.737869] PVR_K:  1159:       * Request (0x00101480000a3870): MCU PDS USCA (-), Reading from 0x80000A3870.
    [   59.747674] PVR_K:  1159:     No live host MMU data available
    [   59.753411] PVR_K:  1159:   Recovery 50: Core = 0, PID = 1103 / vx_app_adc_perc, frame = 0, HWRTData = 0x60032800, EventStatus = 0x00000000, Guilty Lockup
    [   59.767206] PVR_K:  1159:                CRTimer = 0x000000A02DEC, OSTimer = 54.999548010, CyclesElapsed = 56576
    [   59.777359] PVR_K:  1159:                PreResetTimeInCycles = 67328, HWResetTimeInCycles = 48384, FreelistReconTimeInCycles = 246272, TotalRecoveryTimeInCycles = 361984
    [   59.792541] PVR_K:  1159:     BIF0 - FAULT:
    [   59.796716] PVR_K:  1159:       * MMU status (0x0000000000001001): PC = 1, Page Size = 0 (Page Table).
    [   59.806006] PVR_K:  1159:       * Request (0x00101480000a3870): MCU PDS USCA (-), Reading from 0x80000A3870.
    [   59.815814] PVR_K:  1159:     No live host MMU data available
    [   59.821548] PVR_K:  1159:   Recovery 51: Core = 0, PID = 1103 / vx_app_adc_perc, frame = 0, HWRTData = 0x60032700, EventStatus = 0x00000000, Guilty Lockup
    [   59.835359] PVR_K:  1159:                CRTimer = 0x000000A39225, OSTimer = 55.070672810, CyclesElapsed = 38656
    [   59.845529] PVR_K:  1159:                PreResetTimeInCycles = 35072, HWResetTimeInCycles = 33536, FreelistReconTimeInCycles = 331776, TotalRecoveryTimeInCycles = 400384
    [   59.860714] PVR_K:  1159:     BIF0 - FAULT:
    [   59.864890] PVR_K:  1159:       * MMU status (0x0000000000001001): PC = 1, Page Size = 0 (Page Table).
    [   59.874176] PVR_K:  1159:       * Request (0x00101480000a3870): MCU PDS USCA (-), Reading from 0x80000A3870.
    [   59.883982] PVR_K:  1159:     No live host MMU data available
    [   59.889715] PVR_K:  1159:   Recovery 52: Core = 0, PID = 1103 / vx_app_adc_perc, frame = 0, HWRTData = 0x60032A00, EventStatus = 0x00000000, Guilty Lockup
    [   59.903507] PVR_K:  1159:                CRTimer = 0x000000A6D03D, OSTimer = 55.138674090, CyclesElapsed = 34048
    [   59.913661] PVR_K:  1159:                PreResetTimeInCycles = 35840, HWResetTimeInCycles = 38656, FreelistReconTimeInCycles = 238848, TotalRecoveryTimeInCycles = 313344
    [   59.928843] PVR_K:  1159:     BIF0 - FAULT:
    [   59.933016] PVR_K:  1159:       * MMU status (0x0000000000001001): PC = 1, Page Size = 0 (Page Table).
    [   59.942320] PVR_K:  1159:       * Request (0x00101480000a3870): MCU PDS USCA (-), Reading from 0x80000A3870.
    [   59.952131] PVR_K:  1159:     No live host MMU data available
    [   59.957867] PVR_K:  1159:   Recovery 53: Core = 0, PID = 1103 / vx_app_adc_perc, frame = 0, HWRTData = 0x60032900, EventStatus = 0x00000000, Guilty Lockup
    [   59.971662] PVR_K:  1159:                CRTimer = 0x000000AA14F2, OSTimer = 55.207217130, CyclesElapsed = 41216
    [   59.981815] PVR_K:  1159:                PreResetTimeInCycles = 38912, HWResetTimeInCycles = 33280, FreelistReconTimeInCycles = 246528, TotalRecoveryTimeInCycles = 318720
    [   59.996997] PVR_K:  1159:     BIF0 - FAULT:
    [   60.001170] PVR_K:  1159:       * MMU status (0x0000000000001001): PC = 1, Page Size = 0 (Page Table).
    [   60.010457] PVR_K:  1159:       * Request (0x00101480000a3870): MCU PDS USCA (-), Reading from 0x80000A3870.
    [   60.020263] PVR_K:  1159:     No live host MMU data available
    [   60.025997] PVR_K:  1159: DM 3 (HWRflags 0x00000000: working;)
    [   60.031818] PVR_K:  1159: DM 4 (HWRflags 0x00000000: working;)
    [   60.037636] PVR_K:  1159: DM 5 (HWRflags 0x00000000: working;)
    [   60.043454] PVR_K:  1159: DM 6 (HWRflags 0x00000000: working;)
    [   60.049279] PVR_K:  1159: RGX Kernel CCB WO:0x1D RO:0x1D
    [   60.054579] PVR_K:  1159: RGX Firmware CCB WO:0x11 RO:0x11
    [   60.060054] PVR_K:  1159: RGX Kernel CCB commands executed = 413
    [   60.066048] PVR_K:  1159: RGX SLR: Forced UFO updates requested = 0
    [   60.072304] PVR_K:  1159: RGX Errors: WGP:0, TRP:0
    [   60.077085] PVR_K:  1159: Thread0: FW IRQ count = 720
    [   60.082125] PVR_K:  1159: Last sampled IRQ count in LISR = 720
    [   60.087947] PVR_K:  1159: FW System config flags = 0x00020000 (Ctx switch options: Medium CSW profile;)
    [   60.097321] PVR_K:  1159: FW OS config flags = 0x0000000F (Ctx switch: TDM; GEOM; 3D; CDM;)
    [   60.105654] PVR_K:  1159:  (!) RGX power is down. No registers dumped
    [   60.112080] PVR_K:  1159: ------[ RGX FW Trace Info ]------
    [   60.117858] PVR_K:  1159: Debug log type: none
    [   60.122319] PVR_K:  1159: RGX FW thread 0: Trace buffer not yet allocated
    [   60.129098] PVR_K:  1159: ------[ Full CCB Status ]------
    [   60.134489] PVR_K:  1159: ------[ RGX Device ID:0 End ]------
    [   60.140226] PVR_K:  1159: ------[ Device ID: 128 - Phys Heaps ]------
    [   60.146667] PVR_K:  1159: 0x0000000023397a50 -> PdMs: SYSMEM, Type: UMA, Usage Flags: 0x00000004 (, GPU_LOCAL), Refs: 11, Free Size: 14555090944B, Total Size: 14997512192B
    [   60.161938] PVR_K:  1159: ------[ System Summary Device ID:0 ]------
    [   60.168277] PVR_K:  1159: Device System Power State: ON
    [   60.173489] PVR_K:  1159: MaxHWTOut: 500000us, WtTryCt: 10000, WDGTOut(on,off): (10000ms,3600000ms)
    [   60.182520] PVR_K:  1159: ------[ AppHint Settings ]------
    [   60.187994] PVR_K:  1159:   Build Vars
    [   60.191734] PVR_K:  1159:     EnableTrustedDeviceAceConfig: N
    [   60.197467] PVR_K:  1159:     CleanupThreadPriority: 0x00000005
    [   60.203372] PVR_K:  1159:     WatchdogThreadPriority: 0x00000000
    [   60.209366] PVR_K:  1159:     HWPerfClientBufferSize: 0x000c0000
    [   60.215358] PVR_K:  1159:     DevmemHistoryBufSizeLog2: 0x0000000b
    [   60.221524] PVR_K:  1159:     DevmemHistoryMaxEntries: 0x00002710
    [   60.227602] PVR_K:  1159:   Module Params
    [   60.231610] PVR_K:  1159:     none
    [   60.234997] PVR_K:  1159:   Debug Info Params
    [   60.239347] PVR_K:  1159:     none
    [   60.242746] PVR_K:  1159:   Debug Info Params Device ID: 0
    [   60.248226] PVR_K:  1159:     none
    [   60.251619] PVR_K:  1159: ------[ HTB Log state: Off ]------
    [   60.257266] PVR_K:  1159: ------[ Active Sync Checkpoints ]------
    [   60.263346] PVR_K:  1159: (SyncCP Counts: InUse:0 Max:10)
    [   60.268733] ------[ Native Fence Sync: timelines ]------
    [   60.274032] foreign_sync: @0 ctx=1 refs=1
    [   60.278031] PVR_K:  1159: ------------[ PVR DBG: END ]------------
    [   60.284251] ------------[ cut here ]------------
    [   60.288851] WARNING: CPU: 1 PID: 1159 at home/edgeaiuser/workspace/edgeai-cicd/workspace/arago-tmp-default-glibc/work/j721s2_evm-oe-linux/ti-img-rogue-driver/23.1.6404501-r0b/git/binary_j721s2_linux_lws-generic_release/target_aarch64/kbuild/services/server/common/pvr_notifier.c:635 PVRSRVDebugRequest+0x574/0x6a0 [pvrsrvkm]
    [   60.317466] Modules linked in: rpmsg_ctrl rpmsg_char ti_am335x_adc kfifo_buf omap_rng cdns3 cdns_usb_common overlay crct10dif_ce display_connector phy_can_transceiver cfg80211 bluetooth ecdh_generic ecc rfkill wave5 cdns_mhdp8546 drm_display_helper videobuf2_dma_contig videobuf2_memops v4l2_mem2mem drm_kms_helper ti_k3_r5_remoteproc videobuf2_v4l2 cfbfillrect videobuf2_common syscopyarea cfbimgblt sysfillrect sysimgblt fb_sys_fops ti_k3_dsp_remoteproc pvrsrvkm(O) ti_am335x_tscadc sa2ul cfbcopyarea virtio_rpmsg_bus videodev rpmsg_ns ti_k3_common mc pci_j721e_host m_can_platform m_can cdns_dphy_rx pci_j721e optee_rng pcie_cadence_host can_dev cdns_dphy pcie_cadence cdns3_ti pwm_tiehrpwm rng_core cryptodev(O) fuse drm drm_panel_orientation_quirks ipv6
    [   60.383694] CPU: 1 PID: 1159 Comm: pvrdebug Tainted: G        W  O       6.1.33-g8f7f371be2 #1
    [   60.392285] Hardware name: Texas Instruments J721S2 EVM (DT)
    [   60.397925] pstate: 60000005 (nZCv daif -PAN -UAO -TCO -DIT -SSBS BTYPE=--)
    [   60.404867] pc : PVRSRVDebugRequest+0x574/0x6a0 [pvrsrvkm]
    [   60.410406] lr : PVRSRVDebugRequest+0x574/0x6a0 [pvrsrvkm]
    [   60.415932] sp : ffff80000c33bab0
    [   60.419232] x29: ffff80000c33bab0 x28: ffff000835a3e008 x27: ffff000832052a20
    [   60.426350] x26: ffff00082e4e5408 x25: ffff0008300df808 x24: ffff0008300df920
    [   60.433468] x23: ffff00082e4e5520 x22: ffff0008300df920 x21: 0000000000000002
    [   60.440587] x20: 0000000000000000 x19: 0000000000000000 x18: ffffffffffffffff
    [   60.447704] x17: 666f2c6e6f287475 x16: 4f54474457202c30 x15: ffff80008c33b6e7
    [   60.454822] x14: 0000000000000000 x13: ffff800009281550 x12: 0000000000000c7b
    [   60.461938] x11: 0000000000000429 x10: ffff8000092d9550 x9 : ffff800009281550
    [   60.469054] x8 : 00000000ffffefff x7 : ffff8000092d9550 x6 : 0000000000000000
    [   60.476171] x5 : ffff000b7e1a7b60 x4 : ffff000b7e1a7b60 x3 : 0000000000000000
    [   60.483287] x2 : 0000000000000000 x1 : 0000000000000000 x0 : ffff0008337dd580
    [   60.490406] Call trace:
    [   60.492840]  PVRSRVDebugRequest+0x574/0x6a0 [pvrsrvkm]
    [   60.498026]  PVRSRVDumpDebugInfoKM+0x40/0x60 [pvrsrvkm]
    [   60.503294]  PVRSRVBridgeDumpDebugInfo+0x38/0x60 [pvrsrvkm]
    [   60.508910]  BridgedDispatchKM+0x148/0x560 [pvrsrvkm]
    [   60.514003]  PVRSRV_BridgeDispatchKM+0xb0/0x164 [pvrsrvkm]
    [   60.519530]  drm_ioctl_kernel+0xc4/0x170 [drm]
    [   60.524031]  drm_ioctl+0x200/0x440 [drm]
    [   60.527997]  __arm64_sys_ioctl+0xa8/0xf0
    [   60.531912]  invoke_syscall+0x48/0x114
    [   60.535650]  el0_svc_common.constprop.0+0xd4/0xfc
    [   60.540340]  do_el0_svc+0x30/0xd0
    [   60.543642]  el0_svc+0x2c/0x84
    [   60.546687]  el0t_64_sync_handler+0xbc/0x140
    [   60.550941]  el0t_64_sync+0x18c/0x190
    [   60.554592] ---[ end trace 0000000000000000 ]---
    done
    Archiving data ...................... done
    
    File /tmp/pvrlogdump_2310230155.txt.gz was created.
    root@j721s2-evm:/opt/vision_apps/app_adc_perception# 

  • Thank you, I've forwarded these logs for analysis, I'll come back when we have some suggestions or results.

    Thanks,

    Erick

  • Hello,

    We wanted to understand if this issue was replicated before on a previous SDK release? Or have you only started on SDK 9.0?

    Also, how quickly is this reproduced? Is it reproduced with every run? If not, what is the time until this happens?

    I've requested the results from our team, still waiting to hear back from the logs you have provided.

    Regards,

    Erick

  • Hello,

    This issue only occurs on sdk9.0 and occurs when rendering in 3D, not 2D.  The same algorithm does not have this issue on sdk8.6.

  • Hello,

    Thanks for the information, there are many changes between the two SDKs. Most notably the GPU driver updated from 1.15 to 23.1 and the Linux Kernel updated from 5.10 to 6.1.

    There were also many changes in the OpenVX/Vision Apps framework. The data coming into the GPU needs to be checked. Do you use one of the applications from the Vision Apps Demos? Or is this your custom demo? We currently don't have support to extract the GPU API calls using PVRCarbon, so we'll need to use alternate methods to check the data input/output of the node.

    Firstly, what are the inputs to your car model rendering? Is the demo something you can share?

    - If the inputs are textures, how are you reading them into OpenGL? Using the Vision apps framework or your own code?

    Regards,

    Erick

  • Hello,

    This is our custom demo using the Vision apps framework, Reading textures into OpenGL using the load_texture_from_raw_file function, this function is in the ti-processor-sdk-rtos-j721s2-evm-09_00_00_02\vision_apps\kernels\srv\gpu\3dsrv\textures.cpp file.

    Does this demo need source code or an executable? Source code cannot be shared, executable programs can be shared.

    Regards,

    Wen bo

  • Wen bo,

    If you can share an executable, that would be great. We can take a look more closely at the application behavior.

    Regards,

    Erick

  • Hi,

    The executable and parameter files I emailed to Almonte Daviel, who will forward them to you.

    This compressed package is the required image data and needs to be placed under the “app_avm\input\image\" path.

    DataDev01_CheryE05_SRV190_20231011_074339_150.rar

  • Hello,

    I've received both your attachment here and the app_avm.rar from our FAE. I will try launching the program to see if we see the same issue. I assume it's the vision apps setup from SDK 9.0, let me know otherwise if it is a different setup.

    Regards,

    Erick

  • Hi,

    Can you run this demo? Is there any recurrence problem?

  • Hello,

    I have not had a chance to run the demo, there has been delay due to US holidays. Please let me give this a try and I'll get back to you next week.

    Regards,

    Erick

  • Hi Erick,

          What is the progress of this issue? 

  • Waley,

    Apologies, I'm still working on catching up from the break. Please give me some time to replicate.

    I don't immediately suspect the GPU driver because it is working fine in SDK 8.6. There were changes in OpenVX in SDK 9.0, can you please review them to make sure your application still runs as intended:

    software-dl.ti.com/.../developer_notes_migration_guide.html

    Regards,

    Erick

  • Hi Erick,

    What is the difference of OPEN GLES between SDK8.6 and SDK9.0?  In our algorithm, we called OpenGL API directly, so it should not be caused by OpenVX. 

  • OpenGLES versions supported are the same. The driver is different, but the APIs that are accepted are the same.

    Let me try to run your example today to observe the behavior and use it to replicate gather more data about the error.

    Thanks,

    Erick

  • Waley,

    Coming back to this ticket as it got locked. Have you seen any difference in the behavior? Wondering if in the meantime you have moved to the latest SDK available?

    Please let me know if this is still an issue, we have some updates to the GPU driver that might help.

    Thanks,

    Erick

  • Hi Erick,

    We tried the SDK9.0 and SDK9.1, the GPU issue is still happened.

    Can you reproduce this issue on your side when running our app?

    The updates of GPU driver you said is already include in SDK9.1? or will release in new SDK version?

    Waley.Xing

  • Waley,

    The updates of GPU driver you said is already include in SDK9.1? or will release in new SDK version?

    Yes, these SDKs should contain most of the fixes required. I'll double check your app on my end. Is it the same setup instructions you provided above?

    Regards,

    Erick

  • Hi Erick,

    Yes, please follow the instructions we provided before, to reproduce the problem. If you have any problem to reproduce please tell us.

    At the same time, rollback to SDK8.6 for current development, but sometimes the GPU will stuck when running this application.

    We checked the relevant issue on FAQ, and tried it, but the stuck issue still happens. Do you have any other solution to fix or improve the stuck issue?

    https://e2e.ti.com/support/processors-group/processors/f/processors-forum/1316731/faq-tda4vl-q1-what-are-the-gpu-driver-bug-fixes-for-sdk-8-6-or-earlier

    Best regards,

    Waley

  • Waley,

    If you are still failing in SDK 9.1, then there is something more fundamentally going wrong than the GPU driver. We'll need to check what that is.

    The FAQ you linked is the latest one for SDK 8.6 GPU driver bugs.

    Regards,

    Erick

  • Hi Erick,

    Can you reproduce the rendering issue?

    By the way, regarding to GPU stuck issue, it can't be reproduced on SDK9.1, maybe new GPU driver improved it.

    Best Regards,

    Waley

  • Waley,

    By the way, regarding to GPU stuck issue, it can't be reproduced on SDK9.1, maybe new GPU driver improved it.

    Let me understand and summarize what we currently see:

    1) On SDK 8.6, there is an issue where the application gets stuck

    2) On SDK 9.0, there is an issue where the application renders badly, like the picture above, and also the stuck issue

    3) On SDK 9.1, there is an issue where the applicataion renders badly, but does not get stuck

    Is this correct?

    I've not reproduced the issue yet, I'll be giving it a try today.

    Thanks,

    Erick

  • Hello,

    I've tried running the application, but I see the following error. Am I missing some steps?

    root@j721s2-evm:/opt/vision_apps/app_avm# cat run_app_avm.sh 
    ./vx_app_avm.out --cfg app_avm.cfg
    root@j721s2-evm:/opt/vision_apps/app_avm# chmod +x vx_app_avm.out 
    root@j721s2-evm:/opt/vision_apps/app_avm# ./run_app_avm.sh 
    APP: Init ... !!!
    MEM: Init ... !!!
    MEM: Initialized DMA HEAP (fd=5) !!!
    MEM: Init ... Done !!!
    IPC: Init ... !!!
    _rpmsg_char_find_ctrldev: could not find the matching rpmsg_ctrl device for virtio2.rpmsg_chrdev.-1.13
    IPC: ERROR: Unable to create TX channels for CPU [mcu1_0] !!!
    IPC: Init ... Done !!!
    APP: ERROR: IPC init failed !!!
    REMOTE_SERVICE: Init ... !!!
    _rpmsg_char_find_ctrldev: could not find the matching rpmsg_ctrl device for virtio2.rpmsg_chrdev.-1.21
    REMOTE_SERVICE: Init ... Done !!!
        86.478390 s: GTC Frequency = 200 MHz
    APP: Init ... Done !!!
        86.483389 s:  VX_ZONE_INIT:Enabled
        86.483428 s:  VX_ZONE_ERROR:Enabled
        86.483435 s:  VX_ZONE_WARNING:Enabled
        86.484460 s:  VX_ZONE_INIT:[tivxInitLocal:130] Initialization Done !!!
        86.484949 s:  VX_ZONE_INIT:[tivxHostInitLocal:96] Initialization Done for HOST !!!
    [MCU2_0]     86.489933 s:  VX_ZONE_ERROR:[ownTargetCmdDescHandler:1115] object descriptor type is invalid

    Regards,

    Erick

  • FYI, I'm running on SDK 9.1.

    Regards,

    Erick

  • Hi Erick,

    We made and compiled this demo app based on SDK9.0.1 at that time. But the problem is still occurred on SDK9.1. So, we will check and rebuild it on SDK9.1.

    Best Regards,

    Waley 

  • Hi Erick,

    We had rebuild the AVM application based on SDK9.1, and send to your FAE to forward to you. Please try to run the new one. 

    Please tell us if you have any problem. Thank you very much!

    Best Regards,

    Waley

  • Waley,

    Thank you, I'll check with him for the files. I'll be back in office next week to test.

    Thanks,

    Erick

  • Hi Erick,

    How about this issue? Can you reproduce it?

    Best Regards,

    Waley

  • Waley,

    I have not received the files from the FAE, can you please check if they were able to forward them to me? Or should I just test on SDK 9.0?

    Regards,

    Erick

  • Hi Erick,

    We had sent the files to Daviel again by mail. Please use it to test on SDK9.1. Thanks!

    Best Regards,

    Waley

  • Waley,

    Thanks! I'll check with him again.

    Regards,

    Erick

  • Waley,

    I tried running on SDK 9.0 as well with the files I have and it still does not run:

    root@j721s2-evm:/opt/vision_apps/app_avm# ./run_app_avm.sh 
    APP: Init ... !!!
    MEM: Init ... !!!
    MEM: Initialized DMA HEAP (fd=5) !!!
    MEM: Init ... Done !!!
    IPC: Init ... !!!
    _rpmsg_char_find_ctrldev: could not find the matching rpmsg_ctrl device for virtio2.rpmsg_chrdev.-1.13
    IPC: ERROR: Unable to create TX channels for CPU [mcu1_0] !!!
    IPC: Init ... Done !!!
    APP: ERROR: IPC init failed !!!
    REMOTE_SERVICE: Init ... !!!
    _rpmsg_char_find_ctrldev: could not find the matching rpmsg_ctrl device for virtio2.rpmsg_chrdev.-1.21
    REMOTE_SERVICE: Init ... Done !!!
       149.054199 s: GTC Frequency = 200 MHz
    APP: Init ... Done !!!
       149.054356 s:  VX_ZONE_INIT:Enabled
       149.054367 s:  VX_ZONE_ERROR:Enabled
       149.054373 s:  VX_ZONE_WARNING:Enabled
       149.055344 s:  VX_ZONE_INIT:[tivxInitLocal:130] Initialization Done !!!
       149.055794 s:  VX_ZONE_INIT:[tivxHostInitLocal:96] Initialization Done for HOST !!!

    Any idea why this is not running?

    Regards,

    Erick

  • Hi Eric,

    The new application is built based on SDK9.1, please run it on SDK9.1.  Thanks!

    Waley

  • app_avm.rarPlease try attached file.

  • Waley,

    Thanks, I am able to run with this.

    Are you still seeing the original failure? Or are you seeing something else? Currently I see only black, and not these colors as you are showing. Are you seeing GPU logs? I see one hardware recovery when I run your application.

    Thanks,

    Erick

  • Hi Erick,

    The problem is the 3D car model can't show out. The black zone is below the 3D car model. 

    Best Regards

    Waley

  • The problem is that the 3D car model can't be shown out as below. 

  • Waley,

    I see two viewports. The one on the left-hand side and the one on the right hand side.

    The one on the left shows a car model, but the one on the right does not. Is the car model on the left-hand side the expected car model? And it is just not showing in the viewport on the right?

    Regards,

    Erick

  • Hi Erick,

    The car model on left side is only a 2D picture overlay, it is no problem. 

    The car model on right side is real 3D model, it is the problem point.

    Waley

  • Waley,

    Thank you for clarifying that. Let me take a look at the APIs that are being called. I suspect not a driver issue but a rendering issue in the OpenGL calls.

    How are you rendering the car model? What model format are you using?

    The problem is that the 3D car model can't be shown out as below. 

    You seem to have rendered it before, what is different from this example and the one you are currently running?

    Regards,

    Erick

  • Hi Erick,

    The 3D car model file you can find in the folder of app package as below.

    "app_avm\avm_alg_data\model\GX16car_3ds.3DS"

    And it can be rendered on SDK8.6, but failed on SDK9.0 and SDK9.1. The code is same.

    Best Regards,

    Waley

  • Waley,

    If your code was working in SDK 8.6, but now not rendering in SDK 9.0 and SDK 9.1, then there must be some difference in the rendering of the model. I'll see if we have a tool that could compare the OpenGL APIs you are calling to see if there is any difference. Meanwhile, can you check if you can render anything, not just your car model?

    Regards,

    Erick

  • Hi Erick,

    1. The API we used for 3D car model is same as the background picture, and it is ok.

    The API as below.

    glDrawElements(GL_TRIANGLES, model3D.m_myMeshes[nd->mMeshes[n]].numFaces*3, GL_UNSIGNED_SHORT, 0);

     2. As you said, you find a GPU recovery during running the app. Maybe it is a cue to help you find the root cause.

    "I see one hardware recovery when I run your application"

    Best Regards,

    Waley

  • Waley,

    We will start the investigation of the HWR to ensure that is not the reason for the issue. First step is to migrate the latest GPU driver and test, I'll do that and give you an update.

    Regards,

    Erick

  • Waley,

    I've gone through and updated my GPU driver on SDK 9.1 to the SDK 9.2 GPU version (23.3).

    I've seen you car model render correctly now. You have two options:

    1) Upgrade to SDK 9.2, it has the newest GPU driver

    2) Upgrade the GPU driver in SDK 9.1 to the 23.3 driver.

    If you upgrade to SDK 9.2, this would be simpler since you don't need to do any custom upgrade to the GPU driver, but if this is a lot of work I can explain how to update the GPU driver on SDK 9.1. Let me know which you prefer.

    Thanks,

    Erick

  • Hi Erick,

    Thank  you very much! We will try it on SDK9.2.

    Best Regards,

    Waley