This thread has been locked.

If you have a related question, please click the "Ask a related question" button in the top right corner. The newly created question will be automatically linked to this question.

TDA4VM: Mosaic Output Issue

Part Number: TDA4VM

Dear Sir,

With reference to the thread.

The Application pipeline is as follows:

[vx_image buffer[4] -> vx_object Array myarr ]  - > Scalar Node -> Pre-processing Node -> TIDL Node -> Post-Processing(Seg) Node -> Mosaic Node

No sensor and Capture node is present, we are getting output vx_image Buffer[4] from other applications.

This is the pipeline snippet 

static vx_status app_run_graph_for_one_frame_pipeline_cam_buffer(AppObj *obj, vx_uint32* frame_id, vx_uint32 frame_last)
{
	//printf("inside pipeline cam_buffer:%d\n",*frame_id);
	vx_status status = VX_SUCCESS;
	vx_status stat = VX_SUCCESS;
	static char camera_frame_name[128];
	int enqueueCount = 0;
	
#ifndef SINGLE_CAM
	vx_int32 obj_array_idx = -1;
#endif

#if OUT
	ImgMosaicObj *imgMosaicObj = &obj->imgMosaicObj;
	vx_image mosaic_output_image;
	uint32_t num_refs;
#endif
	appPerfPointBegin(&obj->total_perf);

	if (obj->pipeline <= 0)
	{
		// make name
		makeCaptureFilename(camera_frame_name, 128, *frame_id);
        	vx_char output_file_name[500];
        	fill_ObjectArray(obj->cdc.last_images[0],obj->input.myarr[0]); //vx_image to vx_object_array
        	fill_ObjectArray(obj->cdc.last_images[1],obj->input.myarr[1]);
        	fill_ObjectArray(obj->cdc.last_images[2],obj->input.myarr[2]);
		fill_ObjectArray(obj->cdc.last_images[2],obj->input.myarr[3]);
    		/* Enqueue inputs during pipeup dont execute */
    		status = vxGraphParameterEnqueueReadyRef(obj->graph, obj->scalerObj.graph_parameter_index, (vx_reference*)&obj->myinput_images[obj->enqueueCnt], 1);


#if OUT
		{
			status = vxGraphParameterEnqueueReadyRef(obj->graph, imgMosaicObj->graph_parameter_index, (vx_reference*)&imgMosaicObj->output_image[obj->enqueueCnt], 1);
		}
#endif
		obj->enqueueCnt++;
		obj->enqueueCnt   = (obj->enqueueCnt  >= APP_BUFFER_Q_DEPTH)? 0 : obj->enqueueCnt;
		obj->pipeline++;
		enqueueCount++;

		
	}


	if (obj->pipeline > 0)
	{
		
			vx_image capture_input_image;
			uint32_t num_refs;
			vx_bool enqueueNext = vx_true_e;

		
			/* Dequeue input */
			status = vxGraphParameterDequeueDoneRef(obj->graph, obj->scalerObj.graph_parameter_index, (vx_reference*)&capture_input_image, 1, &num_refs);


#if OUT
		
			vx_char output_file_name[APP_MAX_FILE_PATH];

			// Dequeue output /
			if (status == VX_SUCCESS)
			{
				status = vxGraphParameterDequeueDoneRef(obj->graph, imgMosaicObj->graph_parameter_index,
						(vx_reference*)&mosaic_output_image, 1, &num_refs);
			}
			APP_PRINTF("Mosaic App Writing Outputs Start...\n");
			snprintf(output_file_name, APP_MAX_FILE_PATH, "mosaic_output_%010d_%dx%d.yuv", *frame_id,MOSAIC_DISPLAY_WIDTH,MOSAIC_DISPLAY_HEIGHT);
			printf("Output file name:%s\n",output_file_name);
			status = writeMosaicOutput(output_file_name, mosaic_output_image);
			APP_PRINTF("Mosaic App Writing Outputs Done!\n");

			// Enqueue output /
			if(status == VX_SUCCESS)
			{
				status = vxGraphParameterEnqueueReadyRef(obj->graph, imgMosaicObj->graph_parameter_index,
						(vx_reference*)&mosaic_output_image, 1);
			}
	
#endif

			// enqueue next frame
			if (enqueueNext == vx_true_e) {
			// make name
			makeCaptureFilename(camera_frame_name, 128, *frame_id);


			app_find_object_array_indexes(obj->input.myarr, (vx_reference)capture_input_image, 4, &obj_array_idx);
			//printf("obj_array_idx = %d\n",obj_array_idx);
	        	fill_ObjectArray(obj->cdc.last_images[0],obj->input.myarr[0]);
	       	 	fill_ObjectArray(obj->cdc.last_images[1],obj->input.myarr[1]);
	        	fill_ObjectArray(obj->cdc.last_images[2],obj->input.myarr[2]);
	        	fill_ObjectArray(obj->cdc.last_images[3],obj->input.myarr[3]);

			/* Enqueue input - start execution */
			status = vxGraphParameterEnqueueReadyRef(obj->graph, obj->scalerObj.graph_parameter_index, (vx_reference*)&capture_input_image, 1);

			obj->enqueueCnt++;
			obj->dequeueCnt++;

			obj->enqueueCnt = (obj->enqueueCnt >= APP_BUFFER_Q_DEPTH)? 0 : obj->enqueueCnt;
			obj->dequeueCnt = (obj->dequeueCnt >= APP_BUFFER_Q_DEPTH)? 0 : obj->dequeueCnt;

		}
	}


	appPerfPointEnd(&obj->total_perf);

	return status;
}

I have tested that object array obj->input.myarr has all four channel outputs.

I am getting mosaic dumps 

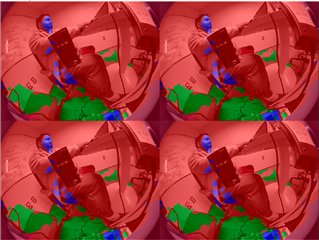
this is the first dump which has camera 0 output in all four images, the next dump has camera 1, and so on.

We are filling the post-proc output in the same way it is filled in other applications for multiple channel

vx_int32 idx = 0;
	obj->imgMosaicObj.input_arr[idx++] = obj->segpostProcObj.output_image_arr;
	obj->imgMosaicObj.num_inputs = idx;

	status = app_create_graph_img_mosaic(obj->graph, &obj->imgMosaicObj);

Please let me know your opinion on the pipeline snippet, possible reasons and guidance for debugging the same.

Thanks and Regards,

Vyom Mishra

  • Hi Vyom,

    This part is not correct

    if (obj->pipeline <= 0)
    {
    // make name
    makeCaptureFilename(camera_frame_name, 128, *frame_id);
    vx_char output_file_name[500];
    fill_ObjectArray(obj->cdc.last_images[0],obj->input.myarr[0]); //vx_image to vx_object_array
    fill_ObjectArray(obj->cdc.last_images[1],obj->input.myarr[1]);
    fill_ObjectArray(obj->cdc.last_images[2],obj->input.myarr[2]);
    fill_ObjectArray(obj->cdc.last_images[2],obj->input.myarr[3]);
    /* Enqueue inputs during pipeup dont execute */
    status = vxGraphParameterEnqueueReadyRef(obj->graph, obj->scalerObj.graph_parameter_index, (vx_reference*)&obj->myinput_images[obj->enqueueCnt], 1);

    Here you are filling 4 buffers at a time and obj->pipeline would be incremented only once. This is not how pipe up should be done.

    I think you are confused between multi-channel and buffer depth.

    The one you are doing now is filling all 4 buffers of all 4 channels.

    Could you please refer the implementation of readScalerInput() in the avp3 demo.

    Regards,

    Nikhil

  • Dear Sir,

    Thanks for the explanation and suggestions.

    I made the mistake and got confused.

    I am getting the correct output now.

    Before closing this thread,

    I would like to know the possible reason for the 4-cam application getting hung after running for 900 frames.

    I have taken care of freeing/releasing the buffers.

    As per your suggestions, for the graph-based application what could be the reason for the application hang and how we can diagnose this issue ASAP?

    Your response will be helpful. 


    Thanks and Regards,

    Vyom Mishra

  • Hi,

    I would like to know the possible reason for the 4-cam application getting hung after running for 900 frames.

    It could be anything, one thing I'm suspecting is lack of buffers. But again, there could be a wide variety of reasons why it gets stuck at 900 frames based on the application itself.

    Regards,

    Nikhil

  • Dear Sir,

    Thanks for the reply!

    Regarding the lack of buffer issue, I have already kept 

    APP_BUFFER_Q_DEPTH  as "4" which is 2 in AVP3  for pipeline.
    I thought maybe increased APP_BUFFER_Q_DEPTH may be an issue.
    As per your suggestion, what should be the optimal APP_BUFFER_Q_DEPTH for four camera applications?
    One piece of information, I want to add for the below pipeline
    Camera Data as buffer vx_image buffer[4] > Scalar Node > Pre-processing Node > TIDL Node > Post-processing Node > Mosaic > Dumps(raw)
     
    The above application reference is from AVP3, apart from segmentation post-processing changes no other changes were made.
    Can you also, please let me know how to enable/dump the memory usage in the application while it is running?
     
    Thanks and Regards,
    Vyom Mishra
  • Hi Vyom

    As per your suggestion, what should be the optimal APP_BUFFER_Q_DEPTH for four camera applications?

    Yes, 4 should be sufficient.

    Can you also, please let me know how to enable/dump the memory usage in the application while it is running?

    you should integrate perf_stats in the application for this.

    You could refer the avp3 demo (app_run_graph_interative() API) where perf stats will be under case "p". Please integrate the same at your end too.

    Regards,

    Nikhil

  • Dear Sir,

    Thanks for the response!

    I found that the TIDL Node utilization is 98% and the FPS of the application is 10.

    The input model resolution is 1024x768.

    So, I assume the application hang issue after some time is due to the TIDL Node excess memory resolution.

    I will reduce the resolution of the DL model, can you please let me know if there could be other reasons for the huge memory utilization?

    Also, Please suggest to me the ways to improve the FPS in the 4-camera application.

    Thanks and Regards,

    Vyom Mishra

  • Hi Vyom,

    Do you see any other node with high processing time? Since this is not a camera based application, are you feeding the frames to the first node at 30FPS?

    Regards,

    Nikhil

  • Dear Sir,

    I am feeding the scalar node the camera input at 30FPS.

    No other node has a huge utilization as TIDL Node.

    Thanks and Regards,

    Vyom Mishra

  • Hi,

    I am feeding the scalar node the camera input at 30FPS.

    Could you share the node execution time for each nodes from the perf stats log?

    Regards,

    Nikhil

  • Dear Sir,

    Please find the perf stats logs.

    <4_cam>

    Summary of CPU load,
     ====================
    
     CPU: mpu1_0: TOTAL LOAD =   0. 0 % ( HWI =   0. 0 %, SWI =   0. 0 % )
     CPU: mcu2_0: TOTAL LOAD =  81.44 % ( HWI =   4.36 %, SWI =   1.21 % )
     CPU: mcu2_1: TOTAL LOAD =   0. 9 % ( HWI =   0. 6 %, SWI =   0. 2 % )
     CPU: mcu3_0: TOTAL LOAD =   0. 9 % ( HWI =   0. 6 %, SWI =   0. 1 % )
     CPU: mcu3_1: TOTAL LOAD =   0. 9 % ( HWI =   0. 6 %, SWI =   0. 1 % )
     CPU: C66X_1: TOTAL LOAD =   4.27 % ( HWI =   0. 5 %, SWI =   0. 3 % )
     CPU: C66X_2: TOTAL LOAD =  25.86 % ( HWI =   0.19 %, SWI =   0.11 % )
     CPU:  C7X_1: TOTAL LOAD =  59.29 % ( HWI =   0. 6 %, SWI =   0. 3 % )
    
    
     HWA performance statistics,
     ===========================
    
     HWA: CE_VISS: LOAD =  39.83 % ( 364 MP/s )
     HWA:   MSC0: LOAD =  42.95 % ( 162 MP/s )
    
    
     DDR performance statistics,
     ===========================
    
     DDR: READ  BW: AVG =   2312 MB/s, PEAK =   2541 MB/s
     DDR: WRITE BW: AVG =   2045 MB/s, PEAK =   2188 MB/s
     DDR: TOTAL BW: AVG =   4357 MB/s, PEAK =   4729 MB/s
    
    
     Detailed CPU performance/memory statistics,
     ===========================================
    
     PERF STATS: ERROR: Invalid command (cmd = 00000003, prm_size = 260 B
     CPU: mcu2_0: TASK:           IPC_RX:   0.12 %
     CPU: mcu2_0: TASK:       REMOTE_SRV:   0. 0 %
     CPU: mcu2_0: TASK:         TIVX_CPU:   0. 0 %
     CPU: mcu2_0: TASK:          TIVX_NF:   0. 0 %
     CPU: mcu2_0: TASK:        TIVX_LDC1:   0. 0 %
     CPU: mcu2_0: TASK:        TIVX_MSC1:   1.21 %
     CPU: mcu2_0: TASK:        TIVX_MSC2:   0. 0 %
     CPU: mcu2_0: TASK:       TIVX_VISS1:   0. 0 %
     CPU: mcu2_0: TASK:       TIVX_CAPT1:   0.94 %
     CPU: mcu2_0: TASK:       TIVX_CAPT2:   0. 0 %
     CPU: mcu2_0: TASK:       TIVX_DISP1:   0. 0 %
     CPU: mcu2_0: TASK:       TIVX_DISP2:   0. 0 %
     CPU: mcu2_0: TASK:       TIVX_CSITX:   0. 0 %
     CPU: mcu2_0: TASK:       TIVX_CAPT3:   0. 0 %
     CPU: mcu2_0: TASK:       TIVX_CAPT4:   0. 0 %
     CPU: mcu2_0: TASK:       TIVX_CAPT5:   0. 0 %
    
     CPU: mcu2_0: HEAP:   DDR_SHARED_MEM: size =    8388608 B, free =    8331520 B ( 99 % unused)
     CPU: mcu2_0: HEAP:           L3_MEM: size =     131072 B, free =     131072 B (100 % unused)
     CPU: mcu2_0: HEAP:  DDR_NON_CACHE_M: size =      65536 B, free =      65536 B (100 % unused)
    
     CPU: mcu2_1: TASK:           IPC_RX:   0. 0 %
     CPU: mcu2_1: TASK:       REMOTE_SRV:   0. 0 %
     CPU: mcu2_1: TASK:         TIVX_SDE:   0. 0 %
     CPU: mcu2_1: TASK:         TIVX_DOF:   0. 0 %
     ### APP_DEBUG: Frame:63
     ****************
     CPU: mcu2_1: TASK:       TIVX_VDEC1:   0. 0 %
     Frame num:63
     CPU: mcu2_1: TASK:       TIVX_VDEC2:   0. 0 %
     CPU: mcu2_1: TASK:       TIVX_VENC1:   0. 0 %
     CPU: mcu2_1: TASK:       TIVX_VENC2:   0. 0 %
     CPU: mcu2_1: TASK:      IPC_TEST_RX:   0. 0 %
     CPU: mcu2_1: TASK:      IPC_TEST_TX:   0. 0 %
     CPU: mcu2_1: TASK:      IPC_TEST_TX:   0. 0 %
     CPU: mcu2_1: TASK:      IPC_TEST_TX:   0. 0 %
     CPU: mcu2_1: TASK:      IPC_TEST_TX:   0. 0 %
     CPU: mcu2_1: TASK:      IPC_TEST_TX:   0. 0 %
     CPU: mcu2_1: TASK:      IPC_TEST_TX:   0. 0 %
     CPU: mcu2_1: TASK:      IPC_TEST_TX:   0. 0 %
    
     CPU: mcu2_1: HEAP:   DDR_SHARED_MEM: size =   16777216 B, free =   16774912 B ( 99 % unused)
     CPU: mcu2_1: HEAP:           L3_MEM: size =     131072 B, free =     131072 B (100 % unused)
     CPU: mcu2_1: HEAP:  DDR_NON_CACHE_M: size =   67043328 B, free =   47144960 B (  6 % unused)
    
     CPU: mcu3_0: TASK:           IPC_RX:   0. 0 %
     CPU: mcu3_0: TASK:       REMOTE_SRV:   0. 0 %
     CPU: mcu3_0: TASK:      IPC_TEST_RX:   0. 0 %
     CPU: mcu3_0: TASK:      IPC_TEST_TX:   0. 0 %
     CPU: mcu3_0: TASK:      IPC_TEST_TX:   0. 0 %
     CPU: mcu3_0: TASK:      IPC_TEST_TX:   0. 0 %
     CPU: mcu3_0: TASK:      IPC_TEST_TX:   0. 0 %
     CPU: mcu3_0: TASK:      IPC_TEST_TX:   0. 0 %
     CPU: mcu3_0: TASK:      IPC_TEST_TX:   0. 0 %
     CPU: mcu3_0: TASK:      IPC_TEST_TX:   0. 0 %
    
     CPU: mcu3_0: HEAP:   DDR_SHARED_MEM: size =    2097152 B, free =    2097152 B (100 % unused)
    
     CPU: mcu3_1: TASK:           IPC_RX:   0. 0 %
     CPU: mcu3_1: TASK:       REMOTE_SRV:   0. 0 %
     ### APP_DEBUG: Frame:64
     ****************
     CPU: mcu3_1: TASK:      IPC_TEST_RX:   0. 0 %
     Frame num:64
     CPU: mcu3_1: TASK:      IPC_TEST_TX:   0. 0 %
     CPU: mcu3_1: TASK:      IPC_TEST_TX:   0. 0 %
     CPU: mcu3_1: TASK:      IPC_TEST_TX:   0. 0 %
     CPU: mcu3_1: TASK:      IPC_TEST_TX:   0. 0 %
     CPU: mcu3_1: TASK:      IPC_TEST_TX:   0. 0 %
     CPU: mcu3_1: TASK:      IPC_TEST_TX:   0. 0 %
     CPU: mcu3_1: TASK:      IPC_TEST_TX:   0. 0 %
    
     CPU: mcu3_1: HEAP:   DDR_SHARED_MEM: size =    2097152 B, free =    2097152 B (100 % unused)
    
     CPU: C66X_1: TASK:           IPC_RX:   0. 0 %
     CPU: C66X_1: TASK:       REMOTE_SRV:   0. 0 %
     CPU: C66X_1: TASK:         TIVX_CPU:   4.18 %
     CPU: C66X_1: TASK:      IPC_TEST_RX:   0. 0 %
     CPU: C66X_1: TASK:      IPC_TEST_TX:   0. 0 %
     CPU: C66X_1: TASK:      IPC_TEST_TX:   0. 0 %
     CPU: C66X_1: TASK:      IPC_TEST_TX:   0. 0 %
     CPU: C66X_1: TASK:      IPC_TEST_TX:   0. 0 %
     CPU: C66X_1: TASK:      IPC_TEST_TX:   0. 0 %
     CPU: C66X_1: TASK:      IPC_TEST_TX:   0. 0 %
     CPU: C66X_1: TASK:      IPC_TEST_TX:   0. 0 %
    
     CPU: C66X_1: HEAP:   DDR_SHARED_MEM: size =   16777216 B, free =   16760320 B ( 99 % unused)
     CPU: C66X_1: HEAP:           L2_MEM: size =     229376 B, free =          0 B (  0 % unused)
     CPU: C66X_1: HEAP:  DDR_SCRATCH_MEM: size =   50331648 B, free =   50331648 B ( 14 % unused)
    
     CPU: C66X_2: TASK:           IPC_RX:   0. 0 %
     CPU: C66X_2: TASK:       REMOTE_SRV:   0. 0 %
     CPU: C66X_2: TASK:         TIVX_CPU:  26. 6 %
     CPU: C66X_2: TASK:      IPC_TEST_RX:   0. 0 %
     CPU: C66X_2: TASK:      IPC_TEST_TX:   0. 0 %
     ### APP_DEBUG: Frame:65
     ****************
     CPU: C66X_2: TASK:      IPC_TEST_TX:   0. 0 %
     Frame num:65
     CPU: C66X_2: TASK:      IPC_TEST_TX:   0. 0 %
     CPU: C66X_2: TASK:      IPC_TEST_TX:   0. 0 %
     CPU: C66X_2: TASK:      IPC_TEST_TX:   0. 0 %
     CPU: C66X_2: TASK:      IPC_TEST_TX:   0. 0 %
     CPU: C66X_2: TASK:      IPC_TEST_TX:   0. 0 %
    
     CPU: C66X_2: HEAP:   DDR_SHARED_MEM: size =   16777216 B, free =   16774912 B ( 99 % unused)
     CPU: C66X_2: HEAP:           L2_MEM: size =     229376 B, free =     229376 B (100 % unused)
     CPU: C66X_2: HEAP:  DDR_SCRATCH_MEM: size =   50331648 B, free =   50331648 B ( 14 % unused)
    
     CPU:  C7X_1: TASK:           IPC_RX:   0. 1 %
     CPU:  C7X_1: TASK:       REMOTE_SRV:   0. 0 %
     CPU:  C7X_1: TASK:         TIVX_CPU:  58.38 %
     CPU:  C7X_1: TASK:      IPC_TEST_RX:   0. 0 %
     CPU:  C7X_1: TASK:      IPC_TEST_TX:   0. 0 %
     CPU:  C7X_1: TASK:      IPC_TEST_TX:   0. 0 %
     CPU:  C7X_1: TASK:      IPC_TEST_TX:   0. 0 %
     CPU:  C7X_1: TASK:      IPC_TEST_TX:   0. 0 %
     CPU:  C7X_1: TASK:      IPC_TEST_TX:   0. 0 %
     CPU:  C7X_1: TASK:      IPC_TEST_TX:   0. 0 %
     CPU:  C7X_1: TASK:      IPC_TEST_TX:   0. 0 %
    
     CPU:  C7X_1: HEAP:   DDR_SHARED_MEM: size =  251658240 B, free =  178533376 B (  2 % unused)
     CPU:  C7X_1: HEAP:           L3_MEM: size =    8159232 B, free =          0 B (  0 % unused)
     CPU:  C7X_1: HEAP:           L2_MEM: size =     491520 B, free =     491520 B (100 % unused)
     CPU:  C7X_1: HEAP:           L1_MEM: size =      16384 B, free =          0 B (  0 % unused)
     CPU:  C7X_1: HEAP:  DDR_SCRATCH_MEM: size =  234881024 B, free =  210324850 B ( 16 % unused)
    
    
     GRAPH: mando_tidl_od_app_graph (#nodes =   4, #executions =     64)
     NODE:  VPAC_MSC1:               ScalerNode: avg =  44256 usecs, min/max =  13193 / 132306 usecs, #executions =         64
     NODE:      DSP-1:              PreProcNode: avg =   4342 usecs, min/max =   4246 /   4431 usecs, #executions =         64
     ### APP_DEBUG: Frame:66
     ****************
     NODE:   DSP_C7-1:                 TIDLNode: avg =  62298 usecs, min/max =  55614 /  63802 usecs, #executions =         65
     Frame num:66
     NODE:      DSP-2:          SegPostProcNode: avg =  27568 usecs, min/max =  22814 /  30764 usecs, #executions =         65
    
     PERF:                 : avg =      0 usecs, min/max =      0 /      0 usecs, #executions =          0
     PERF:                 : avg = 104456 usecs, min/max =      0 / 225679 usecs, #executions =         65
    
     PERF:                 :    9.57 FPS

    fps : 9.57 FPS

    unused DDR : 2 %

    Thanks and Regards,

    Vyom Mishra

  • Hi Vyom,

    2% was a bug which is fixed in the latest releases. It is a calculation mistake.. but you still have 178MB free.

    Here I see ScalarNode, PreProc, TIDL and PostProc. Here TIDL time is 60+ msec, which would automatically result in graph to run at 15 fps.. It should be at 33.33 msec for 30 fps.

    I am feeding the scalar node the camera input at 30FPS.

    Apart from this you had mentioned the above. I do not see a node for that. Could you tell if this is file read and then input to Scalar node? If yes, then there would be file read latency as well which would affect the FPS.

    Regards,

    Nikhil

  • Dear Sir,

    Thanks for the quick response!

    This is tested with real-time 30fps.

    Here I see ScalarNode, PreProc, TIDL and PostProc. Here TIDL time is 60+ msec, which would automatically result in the graph running at 15 fps.. It should be at 33.33 msec for 30 fps.

    For this, we will reduce the input resolution of the DL Model

    Anything else could be done to reduce this time?

    Thanks and Regards,

    Vyom Mishra

  • Hi,

    For this, we will reduce the input resolution of the DL Model

    Yes, this would help. Let us try with this.

    The camera Application is running parallel and we are accessing the data through the server-client model

    May I know how you are feeding this to MSC node exactly?

    Regards,

    Nikhil

  • Dear Sir,

    I have copied vx_image buffer[4] to vx_object_array.

    if(status == VX_SUCCESS)
    	{
    		status = app_create_graph_scaler(obj->context, obj->graph, &obj->scalerObj,  obj->input.myarr[0]);
    		APP_PRINTF("Scaler graph done!\n");
    		printf("[SCALER-MODULE-CREATE] Exit! \n");
    	}

    obj->input.myarr[q]     = vxCreateObjectArray(obj->context, (vx_reference)input, 4);
    where q is Q Depth
    Thanks and Regards,
    Vyom Mishra

  • Yes, this is understood, but how are you getting the vx_image filled with capture data? 

    Usually an OpenVX node is used to fill the vx_image or it would be imported from another application and then data would be filled. May I know what is your approach?

    Regards,

    Nikhil

  • Dear Sir,

    but how are you getting the vx_image filled with capture data?

    It is a separate application which uses a capture node to get the data from the sensor and just uses indexing it referenced from the object array to vx_image type.

    Thanks and Regards,

    Vyom Mishra


  • Ok,

    Coukd you do one more experiment?

    The scalar node perf shows around 44ms... for 30 fps it should have been less than 33ms...

    Could remove the other part of the graph and just receive frames from camera to scalar node and check of you are getting 30fps from scalar node output?

    Regards,

    Nikhil