


Hi there,
I used Am62A to import and infer the Mediapipe face landmarks model. There is no problem of the import and inference on PC, and the accuracy of our model was also really good when I set tensor_bits to 32 and 16. Then I copied the artifact folder and model to EVM and did the inference. However, we encountered some errors and warnings:
 ****** tidlDelegate::Invoke ******
*******   In TIDL_subgraphRtInvoke  ********
MEM: ERROR: Alloc failed with status = 12 !!!
 33484.014255 s:  VX_ZONE_ERROR:[tivxMemBufferAlloc:87] Shared mem ptr allocation failed
 33484.014286 s:  VX_ZONE_ERROR:[ownAllocTensorBuffer:85] Could not allocate tensor memory
 33484.014304 s:  VX_ZONE_ERROR:[tivxUnmapTensorPatch:820] map address is null
 33484.014315 s:  VX_ZONE_ERROR:[tivxUnmapTensorPatch:824] map size is equal to 0
MEM: ERROR: Alloc failed with status = 12 !!!
 33484.014349 s:  VX_ZONE_ERROR:[tivxMemBufferAlloc:87] Shared mem ptr allocation failed
 33484.014362 s:  VX_ZONE_ERROR:[ownAllocTensorBuffer:85] Could not allocate tensor memory
 33484.014377 s:  VX_ZONE_ERROR:[tivxUnmapTensorPatch:820] map address is null
 33484.014390 s:  VX_ZONE_ERROR:[tivxUnmapTensorPatch:824] map size is equal to 0
MEM: ERROR: Alloc failed with status = 12 !!!
 33484.014416 s:  VX_ZONE_ERROR:[tivxMemBufferAlloc:87] Shared mem ptr allocation failed
 33484.014429 s:  VX_ZONE_ERROR:[ownAllocTensorBuffer:85] Could not allocate tensor memory
 33484.014442 s:  VX_ZONE_ERROR:[tivxUnmapTensorPatch:820] map address is null
 33484.014455 s:  VX_ZONE_ERROR:[tivxUnmapTensorPatch:824] map size is equal to 0
ERROR: Running TIDL graph ... Failed !!!
Sub Graph Stats 7366.000000 18301523863390768.000000 11140674680522872.000000
*******  TIDL_subgraphRtInvoke done  ********


************ in ~tidlDelegate ************
 ************ in TIDL_subgraphRtDelete ************
  33486.374886 s:  VX_ZONE_ERROR:[ownReleaseReferenceInt:294] Invalid reference
 33486.374938 s:  VX_ZONE_ERROR:[ownReleaseReferenceInt:294] Invalid reference
************ in ~tidlDelegate ************
 ************ in TIDL_subgraphRtDelete ************
  33486.375791 s:  VX_ZONE_ERROR:[ownReleaseReferenceInt:294] Invalid reference
 33486.375843 s:  VX_ZONE_ERROR:[ownReleaseReferenceInt:294] Invalid reference


 ************ in TIDL_subgraphRtDelete ************
  33486.385346 s:  VX_ZONE_ERROR:[ownReleaseReferenceInt:294] Invalid reference
 33486.385391 s:  VX_ZONE_ERROR:[ownReleaseReferenceInt:294] Invalid reference
 33486.386197 s:  VX_ZONE_WARNING:[vxReleaseContext:1055] Found a reference 0xffff8e141bc8 of type 00000816 at external count 1, internal count 0, releasing it
 33486.386240 s:  VX_ZONE_WARNING:[vxReleaseContext:1057] Releasing reference (name=user_data_object_102) now as a part of garbage collection
 33486.386271 s:  VX_ZONE_WARNING:[vxReleaseContext:1055] Found a reference 0xffff8e142888 of type 00000816 at external count 1, internal count 0, releasing it
 33486.386286 s:  VX_ZONE_WARNING:[vxReleaseContext:1057] Releasing reference (name=user_data_object_115) now as a part of garbage collection
 33486.386308 s:  VX_ZONE_WARNING:[vxReleaseContext:1055] Found a reference 0xffff8e143548 of type 00000816 at external count 1, internal count 0, releasing it
 33486.386323 s:  VX_ZONE_WARNING:[vxReleaseContext:1057] Releasing reference (name=user_data_object_128) now as a part of garbage collection
 33486.386345 s:  VX_ZONE_WARNING:[vxReleaseContext:1055] Found a reference 0xffff8e144208 of type 00000816 at external count 1, internal count 0, releasing it
 33486.386360 s:  VX_ZONE_WARNING:[vxReleaseContext:1057] Releasing reference (name=user_data_object_141) now as a part of garbage collection
Our compile_options:
compile_options = {
'tidl_tools_path' : os.environ['TIDL_TOOLS_PATH'],
'artifacts_folder' : output_dir,
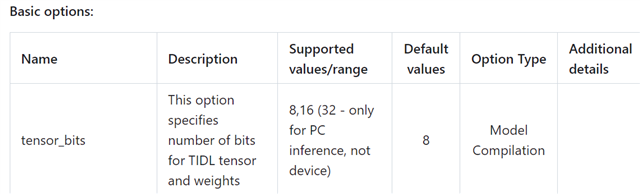
'tensor_bits' : 16,
'accuracy_level' : 9,
'debug_level' : 5,
'advanced_options:calibration_frames' : len(calib_images), # min 10, default 20
'advanced_options:calibration_iterations' : 50, # min 10, default 50
'advanced_options:quantization_scale_type' : 0, # 0, 1, 3, 4
}
Our tflite model looks like:
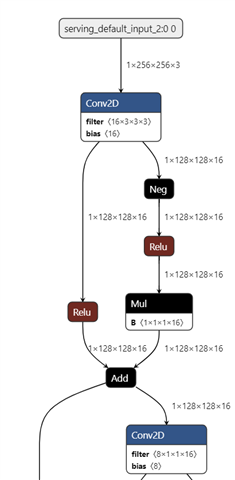
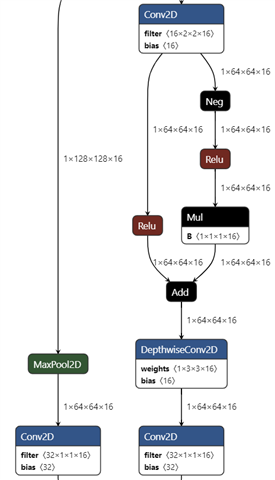
there is no other special operations in our model.
Moreover, what's the meaning of "there are 16 subgraphs, 93 nodes delegated out of 493 nodes." This sentence appeared in our log as well. Does this sentence mean that only 93 nodes are offloaded to C7x-MMA?
We also found that we can set tensor_bits to 32 when we did the inference on EVM. That is weird. Could you clarify this circumstance?
Best regards,
Yunfeng Kang

