This thread has been locked.

If you have a related question, please click the "Ask a related question" button in the top right corner. The newly created question will be automatically linked to this question.

SK-AM62: how to know eth0 interrupts

Part Number: SK-AM62
Other Parts Discussed in Thread: AM625, AM69

Hi

How can I know the specific ETH0 interrupt number。
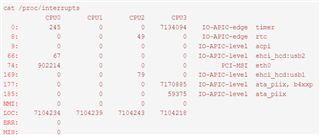
but in SDK8.6 linux is this

Because I'm using isolcpus to isolate the kernel, I want to rebind the network interrupt to a kernel, so I need to know where the network interrupt is.

Thanks

  • Hello hao,

    I am reassigning your thread to another team member to comment. Much of our team is on vacation this week, so please ping the thread next week if you have not received a response.

    Regards,

    Nick

  • Hi,

    Are you trying to bind the interrupt to a different core?

    Best Regards,

    Schuyler

  • Hi

    Yes, I am trying to bind network interrupts to different kernels for testing.Use command cat /proc/interrupts know number 144and 234 .Use command echo * > /proc/irq/144/smp_affinity.I don't know how to distinguish the Ethernet port interruption between eth0 and eth1.

    Thanks

  • Hi

    I have a question about network interruption.I used cat/proc/interrupts and found that there are three network port interrupts below, which are 14234267. But when using ps - elf, only the 267 process can be seen as shown in the figure. May I ask why this is like this

  • Hi,

    Perhaps it has to do with how the CPSW launches threads or daemons. I will check to see if we have guidelines about how to move interrupts. To my knowledge the AM6x class devices may be limited to having the interrupts run on core 0.

    Best Regards,

    Schuyler

  • Hi Schuyler

     I can simply use echo *>/proc/irq/144/smp.affinity to modify the corresponding interrupt and view the/proc/interrupt displayed in another kernel, but I want to specifically distinguish the interrupt numbers for eth0 and eth1.

    Thanks

  • Hi,

    To my knowledge on the CPSW there is not a way to generate interrupts on a MAC level. The CPSW is a switch that can be configured to support a dual MACs by using internal VLANs. These VLANs used for dual MAC are transparent to the network due on ingress or egress the VLAN tags are applied or removed. The VLANs are used by the driver to interface with the kernel network stack. 

    Would this work for your application? If not could you please explain why not?

    Best Regards,

    Schuyler

  • Hi

    At present, testing is still based on SK-AM62X-E3 and linux-5.10 with sdk8.6. One eth0 is used for ethercat communication, while eth1 is used for udp communication. Multiple connections between udp will cause jitter in ethercat. Therefore, I want to try deploying eth0 and eth1 on different kernels to see if there is any performance improvement. However, in/proc/interrup, only three ethernet.8000000 cannot distinguish between eth0 and eth1 information.

  • Hi,

    Are you using a TI EVM? I will also ask a TI colleague to comment on suggestion on this question. Another question I have is typically when using EtherCAT master the solutions we have seen put that protocol on eth1 and eth0 for other ethernet traffic. Is there a reason for the port that you have?

    Best Regards,

    Schuyler

  • Hi

    The same issue with using ti's evm3, Linux uses skd8.6's rt linux-5.10, and rootfs uses the base from the SDK.

    Using AM6254, the CPU kernel frequency is set to 1.4G, the clock frequency is set to 1K, and the Ethercat 1ms task is bound to an isolated kernel to increase priority. Using HTOP to check, Ethercat tasks account for 60% of the CPU. Currently, not only does using UDP cause EtherCAT master synchronization loss, but executing other commands such as top in Linux also causes EtherCAT master synchronization loss.

    I first suspect that the Ethernet ports are mutually affecting EtherCAT master synchronization, but currently testing shows that it is not. It is more like Linux affecting EtherCAT 1ms tasks, but of course EtherCAT master synchronization does not occur for 4ms tasks. Is there any deployment method that can maximize the use of multiple kernels to achieve real-time performance? What is a better query method to identify the impact of the problem?

    Thanks

  • Hello Hao Teng,

    Questions for you:

    Could you elaborate more on EtherCAT master "synchronization loss"? Are you observing that the cycle time of the EtherCAT 1ms task is exceeding 1ms? Are you able to share what the the maximum observed cycle time is?

    What is the EtherCAT master stack you are using?

    Suggestions/Info for you:

    1. You mention using SDK 8.6 RT Linux, we recently made significant real-time improvements from interrupt latencies of around 120us on AM62x SDK 9.0 to around 60us on AM62x on SDK 9.1 which can be observed by running cyclictest. If may be worthwhile to run your EtherCAT master on SDK 9.1 to see if there are any improvements to the observed EtherCAT cycle time.

    See the improved RT-Linux Interrupt Latency numbers from https://software-dl.ti.com/processor-sdk-linux-rt/esd/AM62X/09_01_00_08/exports/docs/devices/AM62X/linux/RT_Linux_Performance_Guide.html#stress-ng-and-cyclic-test

    2. We have in the past couple months been investigating ways to improve the performance of the CODESYS EtherCAT master stack running on AM62x on SDK 9.1 RT. What we have observed is that with a configured cycle period of 1ms, the maximum cycle time observed for the EtherCAT task is about 500us with some basic tunings such as disabling nonuseful tasks running in the background such as display services, audio services, telnetd which run upon startup on the default SDK 9.1 RT image for AM62x. Other tunings we did were isolating all the EtherCAT related tasks onto one core. We also observed running on the SDK 9.1 RT thinimage for AM62x had better performance than the default image (maximum cycle time of about 300us). We tried changing the scheduling policy of ksoftirqd interrupts from "TS" to "FF" but did not observe significant improvements.

    Some other things we haven't tried yet:

    • Enable kernel tracing (ftrace) to detect if an interrupt or another service might be interfering with the performance of the EtherCAT task
    • Look into RCU processes and whether disabling might help
    • Disabling irqbalance
    • Increase clock frequency to max (currently at 1.25 Ghz on all 4 cores)

    I believe that using kernel tracing is probably the best method to understand what is happening on the kernel level during the runtime of EtherCAT however please beware that enabling ftrace may add significant interrupt latency to around 100us.

    -Daolin

  • Hi Daolin

    I built an Ethercat main site in the codesys environment.The main reason for synchronization loss is excessive jitter, resulting in a running cycle that exceeds 1ms.

    Currently, there are two main operations that can be triggered:

    • The first type is that logging into the codesys software again can cause excessive jitter on the Ethercat network port.
    • The second type is when the single core of the CPU is occupied by the ethercat task by 75%, using Linux commands such as ps, top, k3conf, etc. on the Linux side will cause synchronization loss of the ethercat task, which means that the ethercat task is more complex and the Linux console cannot perform other operations.

    My test

    1、SDK9.1 and SDK8.6 have been compared and there has been an improvement in performance, but the effect on the codesys application is not very significant. At present, I want to deploy isolated cores based on the isolcpus command, such as isolating 2-core and 3-core cyclictest testing and SDK9.1 testing, which are similar. However, in SDK9.1, cyclictest cannot be used to test isolation cores 2 and 3, and only 1 and 2 can be displayed. This is also the reason why SDK9.1 was not ultimately chosen. If there is a good method for testing isolation cores in SDK9.1, I am willing to test it again.

    2、My Ethercat master station is connected to 16 slave stations, with a 1ms task running cycle of 500-600 and a maximum cycle of around 1ms. As long as the jitter is within the set range, Codesys can still run normally. Only when other operations are performed simultaneously will the Ethercat master station experience synchronization loss.

    3、I have tested the main frequency 2Gsoc of other platforms to build codesys, which has a very significant effect, only flashing in the default rt Linux. It is estimated that simple optimization can achieve 1ms connection to 32 slave stations. I think CPU frequency will be an important indicator. I used a self-made board and the effect of configuring 1.4G with K3conf was not significant. I found that K3conf can be used to configure up to 1.6G. Does this mean that AM6254 can run up to 1.6G?

    My question

    I want to try to increase the priority of Ethernet port interrupts in Ethercat (eth0) to solve the competition between two ports, but I cannot distinguish eth0 and eth1 well. Can eth0 and eth1 be distinguished by modifying the device tree or driver? Is there any relationship between 144, 234, and 267 in the picture. Why did 267 not generate a single interrupt?

    Sorry for asking so many questions in one email. Thank you very much for Ti's technical support, which is an important reason for choosing Ti SOC.

    Thanks!!

  • I found that K3conf can be used to configure up to 1.6G. Does this mean that AM6254 can run up to 1.6G?

    This is outside datasheet spec for the chip, so it might work, might work for a while, or it might even brick the device permanently. There are no safeguards on root running k3conf.

  • I want to try to increase the priority of Ethernet port interrupts in Ethercat (eth0) to solve the competition between two ports, but I cannot distinguish eth0 and eth1 well. Can eth0 and eth1 be distinguished by modifying the device tree or driver? Is there any relationship between 144, 234, and 267 in the picture. Why did 267 not generate a single interrupt?

    The hard interrupts are not where the interrupt processing see for example https://elinux.org/images/7/72/Elc2011_xi_rt.pdf and https://lpc.events/event/16/contributions/1208/attachments/1034/1984/Plumbers_2022_how_to_no_break_rt.pdf . So ksoftirqd priority is what should matter.

    What is Codesys support saying on tuning their software and Ethernet in PREEMPT_RT Linux?

  • Hi Hao,

    However, in SDK9.1, cyclictest cannot be used to test isolation cores 2 and 3, and only 1 and 2 can be displayed. This is also the reason why SDK9.1 was not ultimately chosen. If there is a good method for testing isolation cores in SDK9.1, I am willing to test it again

    Have you tried the steps in the following FAQ specifically at "This is one read and one write on core 0. You can also give it a list like 0,2 and more threads. This represents the background load. Then start the actual cyclictest. Either just on core you isolated (3) with -t1 -a3, or as I do below on all cores" to test isolated cores with cyclictest? Are you using the same method specified here under item #2? https://www.linutronix.de/blog/A-Checklist-for-Real-Time-Applications-in-Linux 

    Just to clarify, you don't see this problem of only 1 and 2 being displayed in SDK 8.6? There shouldn't be any differences between using cyclictest for testing isolated cores between SDK 9.1 and SDK 8.6., but I will try to verify on my setup on SDK 9.1. Could you share a console log of what you see when you use cyclictest to test isolated cores between SDK 9.1 and SDK 8.6?

    Only when other operations are performed simultaneously will the Ethercat master station experience synchronization loss

    While looking investigating impacts of CODESYS EtherCAT master on AM625 platform, I too have seen increased cycle time metrics when commands such as htop were running at the same time. I speculate this might be the case due to these processes potentially shifting cores and some point it shifts to run on same core as EtherCAT task. It might be worth setting the cpu affinity of these other Linux commands to a core other than the core that EtherCAT task is running and observing the behavior if you haven't done so already.

    Regarding your questions about CPU frequency and ethernet interrupts, please see Pekka's response above.

    -Daolin

  • This is outside datasheet spec for the chip, so it might work, might work for a while, or it might even brick the device permanently. There are no safeguards on root running k3conf.

    Hi 

    After configuring over 1.6G, the K3conf clock will display 0, and when configured to 1.6, it will change to 1.6 normally. I understand that I will ensure that it runs safely on 1.4G. Thank you for your reply

    Thanks

  • What is Codesys support saying on tuning their software and Ethernet in PREEMPT_RT Linux?

    Hi 

    Codesys support personnel suggest increasing the priority of network port interrupts and deploying interrupts in the same kernel as runtime

    Thanks

  • t might be worth setting the cpu affinity of these other Linux commands to a core other than the core that EtherCAT task is running and observing the behavior if you haven't done so already.

    I will try to modify it. Is this modification made during kernel compilation.

  • Just to clarify, you don't see this problem of only 1 and 2 being displayed in SDK 8.6? There shouldn't be any differences between using cyclictest for testing isolated cores between SDK 9.1 and SDK 8.6., but I will try to verify on my setup on SDK 9.1. Could you share a console log of what you see when you use cyclictest to test isolated cores between SDK 9.1 and SDK 8.6?

    I only discovered this issue during the previous testing phase. Using setenv optargs' isolcpus=2-3 'to deploy isolated cores, all cores will appear in SDK 8.6, but only 0 and 1 in 9.1. I am not sure if my testing method is the problem.

  • >>> "Is this modification made during kernel compilation."

    What I have done in the past was to set the cpu affinity using "taskset" command in the Linux environment. This may not be the best way to test since you will have to manually set this up during runtime.

    >>>I only discovered this issue during the previous testing phase. Using setenv optargs' isolcpus=2-3 'to deploy isolated cores, all cores will appear in SDK 8.6, but only 0 and 1 in 9.1. I am not sure if my testing method is the problem.

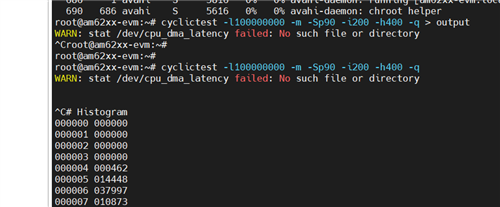
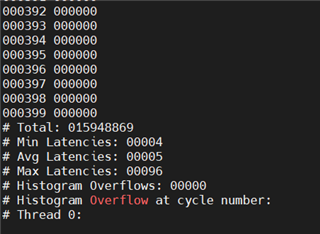
    I see you are using "cyclictest -t -a 0-3 -p 90 -D 5m" could you try "cyclictest -l100000000 -m -Sp90 -i200 -h400 -q" per was is instructed in this FAQ (https://e2e.ti.com/support/processors-group/processors/f/processors-forum/1172055/faq-am625-how-to-measure-interrupt-latency-on-multicore-sitara-devices-using-cyclictest) under section talking about isolating cores?

    -Daolin

  • Hi Daolin

    I used buildroot to redo rootfs and used busybox and system d for system management. After starting codesys, the PID was very small, only over 200, and the real-time running cycle was reduced by about 80us, but it was still not ideal. Logging in to codesys again for monitoring still caused significant jitter, resulting in a 1ms loss of Ethercat synchronization.

    • The Ethercat task and login task of Codesys are both sub threads of runtime, but I have deployed them to different kernels separately, but it still has an impact. May I ask if the sub thread using HTOP during runtime has seen a single CPU exceeding 99? Will there be any improvement in adding thread pooling?Or what could be causing this impact?
    • Is it possible to achieve an Ethercat1ms running cycle of 200us and jitter of 30us based on Am62x? May I ask if you have tested Ti's Ethercat better performing ARM chip? Do you have any recommendations?

    I'm sorry to disturb you for so long. There is a free version available on the official website of Codesys that allows you to deploy Ethercat for half an hour. Codesys+rt Linux is also a common solution for PLC, so you can consider deploying and testing it.

    Thanks

  • I see you are using "cyclictest -t -a 0-3 -p 90 -D 5m" could you try "cyclictest -l100000000 -m -Sp90 -i200 -h400 -q" per was is instructed in this FAQ (https://e2e.ti.com/support/processors-group/processors/f/processors-forum/1172055/faq-am625-how-to-measure-interrupt-latency-on-multicore-sitara-devices-using-cyclictest) under section talking about isolating cores?

    I will try again. I have deployed codesys in 9.1, but the real-time performance of Ethercat is not very obvious.

  • Hi Hao,

    May I ask if the sub thread using HTOP during runtime has seen a single CPU exceeding 99?

    When you say single CPU exceeding 99, I'm assuming you mean you see htop running only on one CPU core and that CPU is exceeding 99% load?

    I'm assuming this was observed when you set the cpu affinity for htop to a single core that is different from the ones running the EtherCAT task and CODESYS login task? In addition to these tasks, have you noticed multiple tasks that show up like the following? Please note the CodeMeterLin is the license reading application for unlimited runtime using Codesys that I had on my setup.

    achieve an Ethercat1ms running cycle of 200us and jitter of 30us based on Am62x

    Currently, with no tuning of the out-of-box SDK 9.1 + Codesys EtherCAT tasks, we cannot achieve these numbers for AM62x, especially if you are applying a Codesys license to enable unlimited runtime. With the free demo version, there is no additional complication of license reading process interfering with the cycle time performance. I cannot comment on whether it is achievable after tuning as I'm still in the process of investigating the effect of the tuning methods I listed above in a previous response here. I can say that you should see improvement in the base interrupt latencies from cyclictest (without codesys application running) on SDK 9.1. Of course, that doesn't directly translate to noticeable difference in cycle time on EtherCAT with Codesys without tuning, you reported this and I've seen this in my setup.

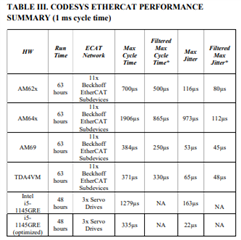
    What we have observed is that with a configured cycle period of 1ms, the maximum cycle time observed for the EtherCAT task is about 500us with some basic tunings

    This currently the best result we can achieve for AM62x (4x A53 cores), filtering out the results of login to Codesys, with 80us of jitter. With the login effects, the best we can see is 700us cycle time with 116us of jitter. We do see better results for some of our Jacinto class ARM based processors such as AM69 (8x A72 cores) which can achieve 250us cycle time and 45us of jitter, filtering out login effects, and 384us cycle time with 53us of jitter with the login effects. (See the table for this info)

    The reason why we filter out results of login is due to this being a one-time occurence and any application using EtherCAT could delay any processing of the transmitted datagrams/packets until after the login is completed.

    I did notice on the Codesys Development System Windows GUI, that if you have two tasks: MainTask + EtherCAT task, this will lead to large jitter results. I observed an improvement when eliminating MainTask and combining both into EtherCAT task. This is more along the lines of Codesys side tuning so the Codesys folks would probably offer better support on that side.

    ---------------------------

    Regarding the synchronization loss due to Linux commands such as htop, is there a particular reason why you need to observe no synchronization loss with these commands? For context, I was only using htop to observe the cpu load for performance optimization purposes but in a real application using EtherCAT, I don't anticipate that htop, k3conf, etc would be used out in the field.

    I just ran the cyclictests (the "cyclictest -t -a 0-3 -p 90 -D 5m" that you used) on my AM62x EVM and I do see only 0 and 1 cores as well. I'll check on the reason for this internally and get back to you.

    Does running "cyclictest -t -a 0-3 -p 90 -D 5m" without the isolating cpu cores (the default environment) still show all 4 cores? That is, is it only after setting the isolcpus parameter that you see only 0-1 in SDK 9.1? 

    -Daolin

  • In addition to these tasks, have you noticed multiple tasks that show up like the following? Please note the CodeMeterLin is the license reading application for unlimited runtime using Codesys that I had on my setup.

    Hi

    I found a codemeter on my PC, but I didn't find it in the codesys runtime on Linux

  • Currently, with no tuning of the out-of-box SDK 9.1 + Codesys EtherCAT tasks, we cannot achieve these numbers for AM62x, especially if you are applying a Codesys license to enable unlimited runtime. With the free demo version, there is no additional complication of license reading process interfering with the cycle time performance. I cannot comment on whether it is achievable after tuning as I'm still in the process of investigating the effect of the tuning methods I listed above in a previous response here. I can say that you should see improvement in the base interrupt latencies from cyclictest (without codesys application running) on SDK 9.1. Of course, that doesn't directly translate to noticeable difference in cycle time on EtherCAT with Codesys without tuning, you reported this and I've seen this in my setup.

    Hi

    I have roughly identified the reason for the excessive Linux jitter caused by logging into the Codesys IDE again, which may be related to which CPU the sub threads of Codesys are deployed on. Currently, I am providing feedback to Codesys for assistance. Thank you for your assistance.

    Thanks

  • Does running "cyclictest -t -a 0-3 -p 90 -D 5m" without the isolating cpu cores (the default environment) still show all 4 cores? That is, is it only after setting the isolcpus parameter that you see only 0-1 in SDK 9.1? 

    -Daolin

    Hi

    My testing conclusion is that with SDK 8.6, regardless of whether isolcpus is configured or not, four results can be seen, but the CPU jitter of isolcpus configured will decrease.

    In SDK9.1, it is normal to use cyclist to test four CPUs for jitter. If isolcpus is configured, only the jitter of the remaining CPUs can be seen. It is uncertain whether the affinity of cyclictest can be forcibly bound through taskset.

    Thanks

  • Hello,

    It looks like cyclictest version changed between SDK 8.x (v2.0) and SDK 9.x (v2.3) based on changes to the Linux kernel between the two SDK versions. There should be some changes between the two versions that caused the issue of seeing only the non-isolated CPUs to show up in SDK 9.1. Additionally, there could be some options that need to run with cyclictest in order to show all CPUs including the non-isolated ones.

    This is not a TI specific issue as we use the existing Linux kernel branch for our SDKs. In other words, if you used another non-ARM processor running Linux and tested isolated cpu interrupt latencies with cyclictest, you would probably also see the same issue of only showing non-isolated CPUs.

    Here is the list of all changes that occurred in related to the cyclictest utility https://git.kernel.org/pub/scm/utils/rt-tests/rt-tests.git/log/. I have not yet been able to track down the specific change(s) that caused the issue but wanted to share it with you for your information.

    You can try running cyclictest on isolated cores on another platform such as x86 and you probably would see the same issue.

    Additionally I'm trying to figure out what options are needed in order to show the isolated-cpus results for interrupt latency. I'll get back to you when I figure this out.

    -Daolin