This thread has been locked.

If you have a related question, please click the "Ask a related question" button in the top right corner. The newly created question will be automatically linked to this question.

TDA4VM: Preview and Captured YUV have brightness difference

Part Number: TDA4VM

Hello TI team,

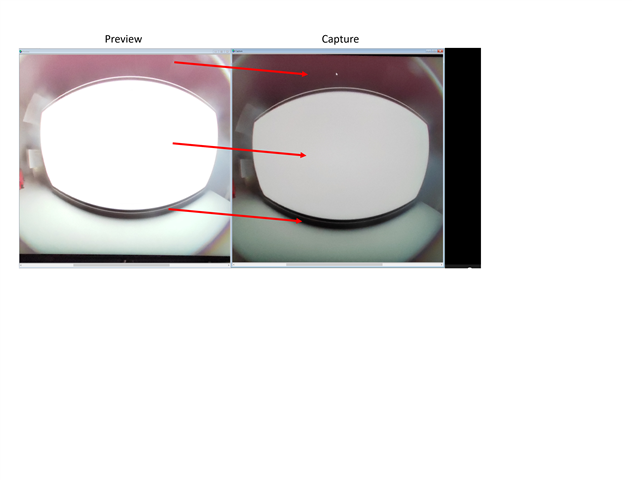
We have query regarding the brightness difference in preview and in YUV.

In lowlight scenarios what we see in preview and in YUV dump have luma difference. Both are checked on the same display. 
Output from TI TDAV4VM is connected to Display monitor using DP cable. 


TI YUV dump converted to PNG.

TI preview snapshot

  • Hi Aprna,

    How are you viewing YUV output? when you say you are using same display for viewing both the outputs, can you please help me with how both outputs are displayed? 

    Regards,

    Brijesh

  • Hi Brijesh,

    Please find the answers inline:

    How are you viewing YUV output?

    YUV dump is viewed using 7YUV tool.


    when you say you are using same display for viewing both the outputs, can you please help me with how both outputs are displayed? 

    We see the preview in monitor where the DP output form the TDA4VM is directly connected as DP input of monitor.
    Once the YUV is dumped from the machine it is coped to the computer and connected to the display using HDMI and then it is viewed using 7YUV tool.

    Preview

    TDA4VM -->DP output-->Monitor (DP input to monitor)

    YUV image 
    TDA4CM --> YUV dumped--> copied to PC---> Connected to Monitor (HDMI input to monitor) --->View using 7YUV.

    Thanks

    Aparna

  • and which example are you using to preview and dump the captured image? is the image directly viewed as YUV422 image? or are you converting it into png format? Does png format support yuv422? 

    Regards,

    Brijesh

  • YUV format of the dumped image from the TI system is NV12. We are viewing as such, there is no conversion.

    We are unable to upload the YUV format image in here, so for convenience the image was converted to PNG and uploaded.

    Thanks

    Aparna

  • Are you also viewing it on NV12 after converting it into png? How do you make sure both the planes are copied correctly? 

    Regards,

    Brijesh

  • we are not using PNG for checking brightness. 
    We use the format NV12 itself in 7YUV.

    Thanks
    Aparna

  • ok, then are you using both plane addresses correctly? Please note that NV12 has two planes and you need to dump both the planes in the file to be able to view it in 7yuv.

    Rgds,

    Brijesh

  • ok, so can you let me know how can i dump both the planes?

    Till now we are using the DCC tool or single_cam_app menu options to dump the YUV.

    Thanks
    Aparna

  • Hi,

    Please refer to API write_output_image_fp in single camera application. This APi dumps both the planes of NV12 image. 

    Regards,

    Brijesh

  • Hi

     We tried some experiments for the same, 
    YUV image was converted to RGM and then gamma value of 2.2 is applied (which is used in tuning), then we can see the line noise same as in preview.

    Preview Snapshot

    Snapshot of gamma applied RGB 

    Is there any additional processing done on the preview?


    Adding on, if the planes of the images in YUV was not dumped properly, it should show issues in other conditions (bright and room light) which we haven't observed till now.

    Thanks

    Aparna

  • Is your capture really running fine? Can you press 'p' on the console and confirm the same? 

    Which example are you running? Are you displaying some grpx along with this video in dark scene? 

    Regards,

    Brijesh

  • Here is the statistics printed(logs are taken just after the captures (press s first and then p))

    Summary of CPU load,
    ====================

    CPU: mpu1_0: TOTAL LOAD = 0.40 % ( HWI = 0. 6 %, SWI = 0. 2 % )
    CPU: mcu2_0: TOTAL LOAD = 11. 0 % ( HWI = 0. 0 %, SWI = 0. 0 % )
    CPU: mcu2_1: TOTAL LOAD = 1. 0 % ( HWI = 0. 0 %, SWI = 0. 0 % )
    CPU: c7x_1: TOTAL LOAD = 0. 0 % ( HWI = 0. 0 %, SWI = 0. 0 % )
    CPU: c7x_2: TOTAL LOAD = 1. 0 % ( HWI = 0. 0 %, SWI = 0. 0 % )


    HWA performance statistics,
    ===========================

    HWA: VISS: LOAD = 13.85 % ( 88 MP/s )
    HWA: MSC0: LOAD = 19.30 % ( 132 MP/s )


    DDR performance statistics,
    ===========================

    DDR: READ BW: AVG = 457 MB/s, PEAK = 5114 MB/s
    DDR: WRITE BW: AVG = 379 MB/s, PEAK = 2629 MB/s
    DDR: TOTAL BW: AVG = 836 MB/s, PEAK = 7743 MB/s


    Detailed CPU performance/memory statistics,
    ===========================================

    DDR_SHARED_MEM: Alloc's: 23 alloc's of 55990216 bytes
    DDR_SHARED_MEM: Free's : 0 free's of 0 bytes
    DDR_SHARED_MEM: Open's : 23 allocs of 55990216 bytes

    CPU: mcu2_0: TASK: FREERTOS_TA: 0. 0 %
    CPU: mcu2_0: TASK: IPC_RX: 0. 0 %
    CPU: mcu2_0: TASK: REMOTE_SRV: 69.33 %
    CPU: mcu2_0: TASK: LOAD_TEST: 0. 0 %
    CPU: mcu2_0: TASK: TIVX_CPU_0: 0. 0 %
    CPU: mcu2_0: TASK: TIVX_V1NF: 0. 0 %
    CPU: mcu2_0: TASK: TIVX_V1LDC1: 0. 0 %
    CPU: mcu2_0: TASK: TIVX_V1SC1: 0. 0 %
    CPU: mcu2_0: TASK: TIVX_V1MSC2: 0. 0 %
    CPU: mcu2_0: TASK: TIVXVVISS1: 0. 0 %
    CPU: mcu2_0: TASK: TIVX_CAPT1: 0. 0 %
    CPU: mcu2_0: TASK: TIVX_CAPT2: 0. 0 %
    CPU: mcu2_0: TASK: TIVX_DISP1: 0. 0 %
    CPU: mcu2_0: TASK: TIVX_DISP2: 0. 0 %
    CPU: mcu2_0: TASK: TIVX_CSITX: 0. 0 %
    CPU: mcu2_0: TASK: TIVX_CAPT3: 0. 0 %
    CPU: mcu2_0: TASK: TIVX_CAPT4: 0. 0 %
    CPU: mcu2_0: TASK: TIVX_CAPT5: 0. 0 %
    CPU: mcu2_0: TASK: TIVX_CAPT6: 0. 0 %
    CPU: mcu2_0: TASK: TIVX_CAPT7: 0. 0 %
    CPU: mcu2_0: TASK: TIVX_CAPT8: 0. 0 %
    CPU: mcu2_0: TASK: TIVX_DPM2M1: 0. 0 %
    CPU: mcu2_0: TASK: TIVX_DPM2M2: 0. 0 %
    CPU: mcu2_0: TASK: TIVX_DPM2M3: 0. 0 %

    CPU: mcu2_0: HEAP: DDR_LOCAL_MEM: size = 16777216 B, free = 16040448 B ( 95 % unused)
    CPU: mcu2_0: HEAP: L3_MEM: size = 524288 B, free = 507392 B ( 96 % unused)

    CPU: mcu2_1: TASK: FREERTOS_TA: 0. 0 %
    CPU: mcu2_1: TASK: IPC_RX: 0. 0 %
    CPU: mcu2_1: TASK: REMOTE_SRV: 4.54 %
    CPU: mcu2_1: TASK: LOAD_TEST: 0. 0 %
    CPU: mcu2_1: TASK: TIVX_CPU_1: 0. 0 %
    CPU: mcu2_1: TASK: TIVX_SDE: 0. 0 %
    CPU: mcu2_1: TASK: TIVX_DOF: 0. 0 %
    CPU: mcu2_1: TASK: IPC_TEST_RX: 0. 0 %
    CPU: mcu2_1: TASK: IPC_TEST_TX: 0. 0 %
    CPU: mcu2_1: TASK: IPC_TEST_TX: 0. 0 %
    CPU: mcu2_1: TASK: IPC_TEST_TX: 0. 0 %
    CPU: mcu2_1: TASK: IPC_TEST_TX: 0. 0 %

    CPU: mcu2_1: HEAP: DDR_LOCAL_MEM: size = 16777216 B, free = 16773120 B ( 99 % unused)
    CPU: mcu2_1: HEAP: L3_MEM: size = 524288 B, free = 524288 B (100 % unused)

    CPU: c7x_1: TASK: FREERTOS_TA: 0. 0 %
    CPU: c7x_1: TASK: IPC_RX: 0. 0 %
    CPU: c7x_1: TASK: REMOTE_SRV: 3.16 %
    CPU: c7x_1: TASK: LOAD_TEST: 0. 0 %
    CPU: c7x_1: TASK: TIVX_C71_P1: 0. 0 %
    CPU: c7x_1: TASK: TIVX_C71_P2: 0. 0 %
    CPU: c7x_1: TASK: TIVX_C71_P3: 0. 0 %
    CPU: c7x_1: TASK: TIVX_C71_P4: 0. 0 %
    CPU: c7x_1: TASK: TIVX_C71_P5: 0. 0 %
    CPU: c7x_1: TASK: TIVX_C71_P6: 0. 0 %
    CPU: c7x_1: TASK: TIVX_C71_P7: 0. 0 %
    CPU: c7x_1: TASK: TIVX_C71_P8: 0. 0 %
    CPU: c7x_1: TASK: IPC_TEST_RX: 0. 0 %
    CPU: c7x_1: TASK: IPC_TEST_TX: 0. 0 %
    CPU: c7x_1: TASK: IPC_TEST_TX: 0. 0 %
    CPU: c7x_1: TASK: IPC_TEST_TX: 0. 0 %
    CPU: c7x_1: TASK: IPC_TEST_TX: 0. 0 %

    CPU: c7x_1: HEAP: DDR_LOCAL_MEM: size = 268435456 B, free = 268435200 B ( 99 % unused)
    CPU: c7x_1: HEAP: L3_MEM: size = 3964928 B, free = 3964928 B (100 % unused)
    CPU: c7x_1: HEAP: L2_MEM: size = 458752 B, free = 458752 B (100 % unused)
    CPU: c7x_1: HEAP: L1_MEM: size = 16384 B, free = 16384 B (100 % unused)
    CPU: c7x_1: HEAP: DDR_SCRATCH_MEM: size = 385875968 B, free = 385875968 B (100 % unused)

    CPU: c7x_2: TASK: FREERTOS_TA: 0. 0 %
    CPU: c7x_2: TASK: IPC_RX: 0. 0 %
    CPU: c7x_2: TASK: REMOTE_SRV: 0. 1 %
    CPU: c7x_2: TASK: LOAD_TEST: 0. 0 %
    CPU: c7x_2: TASK: TIVX_CPU: 0. 0 %
    CPU: c7x_2: TASK: IPC_TEST_RX: 0. 0 %
    CPU: c7x_2: TASK: IPC_TEST_TX: 0. 0 %
    CPU: c7x_2: TASK: IPC_TEST_TX: 0. 0 %
    CPU: c7x_2: TASK: IPC_TEST_TX: 0. 0 %
    CPU: c7x_2: TASK: IPC_TEST_TX: 0. 0 %

    CPU: c7x_2: HEAP: DDR_LOCAL_MEM: size = 16777216 B, free = 16772608 B ( 99 % unused)
    CPU: c7x_2: HEAP: L2_MEM: size = 458752 B, free = 458752 B (100 % unused)
    CPU: c7x_2: HEAP: L1_MEM: size = 16384 B, free = 16384 B (100 % unused)
    CPU: c7x_2: HEAP: DDR_SCRATCH_MEM: size = 67108864 B, free = 67108864 B (100 % unused)


    GRAPH: graph_84 (#nodes = 5, #executions = 1979)
    NODE: CAPTURE2: node_95: avg = 33253 usecs, min/max = 33218 / 45332 usecs, #executions = 1979
    NODE: VPAC_VISS1: VISS_Processing: avg = 4931 usecs, min/max = 4905 / 5409 usecs, #executions = 1979
    NODE: MCU2-0: 2A_AlgNode: avg = 995 usecs, min/max = 741 / 7829 usecs, #executions = 1979
    NODE: VPAC_MSC1: node_106: avg = 6472 usecs, min/max = 6457 / 6553 usecs, #executions = 1979
    NODE: DISPLAY1: node_108: avg = 8782 usecs, min/max = 67 / 16857 usecs, #executions = 1979

    PERF: TOTAL: avg = 33285 usecs, min/max = 32469 / 34138 usecs, #executions = 1291

    PERF: TOTAL: 30. 4 FPS


    Which example are you running?

    Is it the application? If so its is single_cam_app

    Are you displaying some grpx along with this video in dark scene?

    Running single_cam_app, and then seeing the preview.
    I hope this answers your question.

    Thanks

    Aparna

  • Do you see any graphics blended with the in this application? Because display pipeline will exactly show what is in the input image. It cannot introduce artifacts in the image. 

    Also please note that single camera application may not be dump/save the correct/current image.. Are you sure that image contents on the preview is changing?

    Regards,

    Brijesh

  • Application is not modified. We are using as such. 

    While dumping using DCC tool have same problem.

    The preview its brighter, so we see the line noise and in YUV its completely dark.

    Thanks

    Aparna

  • Again, when scene changes, do you see the change in the output? Does the complete dark output changes when scene changes? I would like to first know if capture -> display is really running fine. 

    Regards,

    Brijesh

  • Again, when scene changes, do you see the change in the output? Does the complete dark output changes when scene changes?

    Do you mean the lux intensity by scene change?

    If so, the images which i shared earlier are on 0.2 lux. (<1lux).
    On other lighting scenarios, bright light and room light, YUV dump and preview don't have much difference in brightness. Only on lux intensity <1Lux we observe the issue of brightness difference. 

    Sub 1lux.
    Preview ---> bright and can see line noise.
    YUV dump (NV12 format) ---> Dark

    Thanks

    Aparna

  • Hi,

    I meant is the capture still running and changing the content if the scene changes, even in the dark scene? I am wondering if CSIRX is still capturing?

    Also are you using LDC in the pipeline? or is just capture -> VISS -> display usecase? 

    Regards,

    Brijesh 

  • so we maintain 0.2 lux scenario in the lab., if the scene is changed with in lab maintaining same lux, result is same.

    Also are you using LDC in the pipeline? or is just capture -> VISS -> display usecase?

    We are not using LDC.

    Thanks

    Aparna

  • So, if we change the lux level of the scene it responds to a change but the delta between preview and capture remains. The capture is always more contrasty compared to preview, which in effect makes teh darker regions look dark. In preview mode, the images looks like it is having an offset and blacks look greyish and the images look like there is a lot of flare.

  • oh that's lot brightness difference.

    So from VISS, does it directly go to display only? and is this eDP display? have you checked with multiple displays and confirm the output is same for all displays? Just wondering if this is coming from the display. 

    Also wondering if there is any CSC difference that can cause brightness, lets first check the other parameters. 

    Regards,

    Brijesh

  • The capture is direct output from VISS and the preview is VISS->Display Sub-System->Display through DP connection
    Its not eDP attaching the display info also

  • Is it possible to try on some other DP based display? I am just wondering if display is doing some post processing and increasing brightness. 

    Regards,

    Brijesh

  • If incase display is doing some post-processing then also it should not be a problem because we are viewing both Capture and Preview on the same Display which will apply same level of processing on both. Can you check whether preview and Capture looks same at your end.

  • I think our DSS code uses BT601 CSC coefficients, so if your monitor is using some other coefficients, then there could be difference, other than this, i dont se any other difference

  • If the DSS is still using BT601 format then we are using reduced signal range like (16-235) which causes clipping as our capture NV12 format is of full range (0-255). Could you please confirm in j721s2 which DSS is being used. If this is the case then preview should look dark and capture should look bright but we see opposite behavior. How to check the what coefficients are being used by a monitor.

  • Not sure which coefficients are used by your monitor. I would suggest checking int monitor specs. 

    What do you mean by what dss is being used? i did not get the question. 

    Regards,

    Brijesh

  • I mean in j721s2 TDA4 VPAC3 what is the signal range being used by DSS is it BT601 (16-235) or BT709 (0-255). I have heard from ISP team that signal range  (16-235) is being used by DSS in TDA3 which is the previous version of TDA4 but it got updated and DSS is using full signal range (0-255) in TDA4. It got updated or not.

  • Hi Brijesh,
    Is there any api we can use to print out the pixel values of preview?

    Thanks
    Aparna

  • Hi,

    What is the resolution from the sensor? Because if its not exactly 1080p, scalar will downscale the resolution to 1080p and then submit it to display. Essentially, what is the dataflow? Is it CSIRX -> VISS -> DSS or CSIRX -> VISS -> Scalar -> DSS ? 

    Also when saving the image, are you sure it is from VISS? Can you save the image, which is input to the DSS and share it? 

    Regards,

    Brijesh

  • hi

    sensor output is 1920x1536.

    Essentially, what is the dataflow? Is it CSIRX -> VISS -> DSS or CSIRX -> VISS -> Scalar -> DSS ? 

    IS there any command or log by which i can confirm, the dataflow,


    Also when saving the image, are you sure it is from VISS? Can you save the image, which is input to the DSS and share it?

    Since we didnt check about the scalar, we are under impression that dataflow is   CSIRX -> VISS -> DSS.

    o/p of VISS --> i/p of DSS. 
    Is there any method with which i can double check ?

    Thanks

    Aparna

  • You can press 'p' on the console and it will print the graph statics, it will also print the list of nodes being used in the graph. 

    Rgds,

    Brijesh

  • In the statistics which i have posted before in here using the same method as u said, i could see this

    HWA performance statistics,
    ===========================

    HWA: VISS: LOAD = 13.85 % ( 88 MP/s )
    HWA: MSC0: LOAD = 19.30 % ( 132 MP/s )

    So does this mean the preview pipeline flow is
    VISS-->Scalar-->DSS?

    Thanks 

    Aparna

  • Yes, MSC is being used in the path then.

    Regards,

    Brijesh

  • Hi,
    How to change DSS signal range to 0~255? The default DSS settings using 16~235 range only
    Thanks,
    Ravi.

  • Hi,

    As communicated over email, i think DSS output is in  full range, one difference could be, VISS is using BT709 coefficients whereas DSS is using BT601 coefficients, can you please try changing it in one of the place and make it similar?  

    Regards,

    Brijesh

  • hi brijesh,
    Can you share the method to enable DSS logs?

    Thanks

  • Hi Aparna,

    There isn't any DSS log which will print these coefficients. Most likely we would have to dump register and confirm the same. 

    I think it is easy to find the CSC registers for Vidoe pipeline in TRM, like below. Can you please save these registers using devmem2 utility? 

    Regards,

    Brijesh

  • We just did a swap of the DSS coefficients in the file csl_dssVideoPipe.c (as shown below). and we can see now the YUV dump image is matching with the preview in monitor.

    Can you take  a look on this?


    Thanks

    Aparna

  • Aparna,

    That's strange.

    Let me check the YUV2RGB settings for full range output in bt601. 

    Regards,

    Brijesh

  • Aparna,

    As Gang suggested, Can there be issue due to viewer that you are using? Can you try changing setting in the viewer?

    Regards,

    Brijesh