What information is available of encoder/decoder latency on the Wave521CL CODEC IP?
This thread has been locked.
If you have a related question, please click the "Ask a related question" button in the top right corner. The newly created question will be automatically linked to this question.
What information is available of encoder/decoder latency on the Wave521CL CODEC IP?
Below are FAQ and respective analyses done to provide insights to latency metrics regarding the Wave521CL Codec:
VPU can afford to reach real time performance under memory access latency if the number of cycles per CTU
retains less than 500 cycles. VPU is designed to be less sensitive to pipeline delay especially at a peak bitrate
which might eventually incur performance drop.With use of decoupling technique and inter-pipe queues, it
can hide this sort of delay and deliver high performance at any situation.
End-to-end latency includes input delay, network delay, delay due to the video standard specification, display delay, and so on. This is why our Linux test-cases only look at latency from the v4l2h265/v4l2h264 elements with no display.
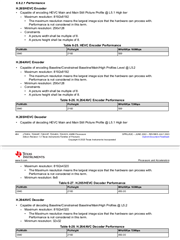
The decoder is 10% faster than encoder in same input frequency. Additionally, you can refer to the TRM in section 6.6.2.1 Performance where it specifies the decoder for 3840x2160@60 with 450MHz input frequency while Encoder encodes the same resolution with 500MHz. Additionally for the decoder, the timing of first display depends on bitstream header syntax. So display delay can be different for each bitstream.
To measure hardware accelerator latency from a GStreamer pipeline follow these steps:
#!/usr/bin/python3 import sys import re import time import signal import threading import os stats = {} pattern_latency = "time=\(guint64\)([0-9]*)" pattern_ts = "ts=\(guint64\)([0-9]*)" pattern_element = "element=\(string\)(.*?)," if len(sys.argv) > 1 and os.path.isfile(sys.argv[1]): fp = open(sys.argv[1], 'r') else: print("[ERROR] Trace file dose not exist") print("Usage: ./parse_gst_tracers.py ./path/to/gst_trace/trace.log") exit() stop = False def signal_handler(sig, frame): print("Ctrl-C") global stop stop = True signal.signal(signal.SIGINT, signal_handler) header = "|element latency out-latancy out-fps frames |" divider = "+-------------------------------------------------------------------------+" def report(): while(not stop): os.system('clear') print(divider) print(header) print(divider) for e in stats: print('|' + e.ljust(20), ("%0.2f"%(stats[e][0]/1000000)).ljust(13), ("%0.2f"%(stats[e][2]/1000000)).ljust(17), str(stats[e][3]).ljust(12), str(stats[e][4]).ljust(10), '|', sep="") print(divider) time.sleep(1) reporting_thread = threading.Thread(target=report) reporting_thread.start() while (not stop): l = fp.readline() # read line if not l: time.sleep(0.5) continue # find instances of latency in this line t = re.findall(pattern_latency, l) if (not t): continue if (not t[0]): continue latency = int(t[0]) # get the current time stamp t = re.findall(pattern_ts, l) if (not t): continue if (not t[0]): continue time_stamp = int(t[0]) # retrieve the current element t = re.findall(pattern_element, l) if (not t): continue element = t[0] # see if this element is currently in stats dict if element not in stats: # [latency[0], curr-timestamp[1], out-latency[2], out-fps[3], num-frames[4]] stats[element] = [0, 0, 0, 0, 0 ]; # set up if just adding stats[element][4] += 1 # increase number of frames # calculate latency of the element stats[element][0] = ((stats[element][4] - 1) * stats[element][0] + latency)/stats[element][4] if (stats[element][1]): stats[element][2] = ((stats[element][4] - 1) * stats[element][2] + time_stamp - stats[element][1])/stats[element][4] stats[element][3] = int(1000000000/stats[element][2]) stats[element][1] = time_stamp