Part Number: DRA821U
Other Parts Discussed in Thread: DRA821, SK-TDA4VM, TDA4VM, DRA829
Tool/software:
Hi,
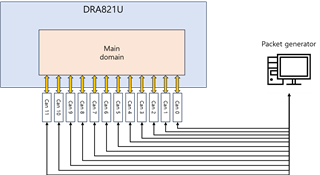
We did a CAN traffic test.
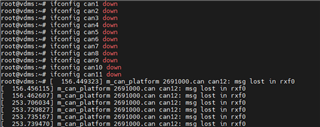
When CAN RX traffic increases, "msglost in rxf0" occurs.
[  582.783855] m_can_platform 2771000.can can5: msg lost in rxf0
[  582.786916] m_can_platform 2751000.can can3: msg lost in rxf0
[  582.791426] m_can_platform 2701000.can can1: msg lost in rxf0
[  582.794588] m_can_platform 2761000.can can4: msg lost in rxf0
[  582.797610] m_can_platform 2781000.can can6: msg lost in rxf0
[  582.801723] m_can_platform 2771000.can can5: msg lost in rxf0
[  582.804739] m_can_platform 2751000.can can3: msg lost in rxf0
[  582.807791] m_can_platform 2761000.can can4: msg lost in rxf0
[  582.812810] m_can_platform 2701000.can can1: msg lost in rxf0
[  582.815954] m_can_platform 2781000.can can6: msg lost in rxf0
[  582.820506] m_can_platform 2771000.can can5: msg lost in rxf0
The test environment is as follows:
SDK version: 9.01
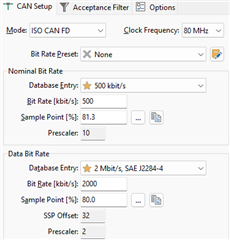
CAN interface setting
root@vdms:~# ip -d -s link show can1
3: can1: <NOARP,UP,LOWER_UP,ECHO> mtu 72 qdisc pfifo_fast state UP mode DEFAULT group default qlen 65536
    link/can  promiscuity 0 minmtu 0 maxmtu 0
    can <BERR-REPORTING,FD> state ERROR-ACTIVE (berr-counter tx 0 rx 0) restart-ms 1000
          bitrate 500000 sample-point 0.800
          tq 12 prop-seg 63 phase-seg1 64 phase-seg2 32 sjw 1 brp 1
          m_can: tseg1 2..256 tseg2 2..128 sjw 1..128 brp 1..512 brp_inc 1
          dbitrate 2000000 dsample-point 0.750
          dtq 12 dprop-seg 14 dphase-seg1 15 dphase-seg2 10 dsjw 1 dbrp 1
          m_can: dtseg1 1..32 dtseg2 1..16 dsjw 1..16 dbrp 1..32 dbrp_inc 1
          clock 80000000
          re-started bus-errors arbit-lost error-warn error-pass bus-off
          0          0          0          0          0          0         numtxqueues 1 numrxqueues 1 gso_max_size 65536 gso_max_segs 65535 parentbus platform parentdev 2701000.can
    RX:  bytes packets errors dropped  missed   mcast
       5470760  683845      0    6743       0       0
    TX:  bytes packets errors dropped carrier collsns
             0       0      0       0       0       0
root@vdms:~#
CAN DTS setting
        mcan0: can@2701000 {
                compatible = "bosch,m_can";
                reg = <0x00 0x02701000 0x00 0x200>,
                      <0x00 0x02708000 0x00 0x8000>;
                reg-names = "m_can", "message_ram";
                power-domains = <&k3_pds 156 TI_SCI_PD_EXCLUSIVE>;
                clocks = <&k3_clks 156 0>, <&k3_clks 156 2>;
                clock-names = "hclk", "cclk";
                interrupts = <GIC_SPI 124 IRQ_TYPE_LEVEL_HIGH>,
                             <GIC_SPI 125 IRQ_TYPE_LEVEL_HIGH>;
                interrupt-names = "int0", "int1";
                bosch,mram-cfg = <0x0 128 64 64 64 64 32 32>;
        };
Please let me know how to increase CAN traffic processing capacity.
Regards,
dohyeon