


Tool/software:
1. Hardware : TDA4 (TI EVM) GP EVM
2. SDK: 0902
3.BOOT_MODE : SBL(OSPI) 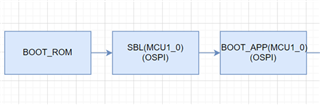
filename:sbl_ospi_img_mcu1_0_release.tiimage
filesize: 328KB
4.BOOT_APP(MCU1_0):
filename:vx_app_rtos_linux_mcu1_0.appimage
filesize: 263KB
5. POST bypass( MCU8_BOOTPIN : 1 MCU9_BOOTPIN : 1)
My requirement: The target can send CAN messages within 75ms after power-on, and the CAN messages are sent in BOOT_APP(MCU1_0)
I don't know why the measured data is so different from the official data.
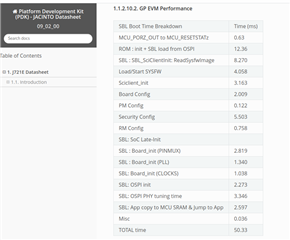
The official data for measuring SBL are as follows
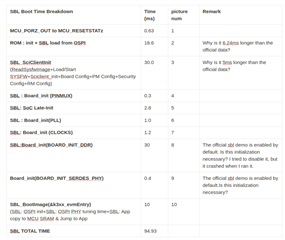
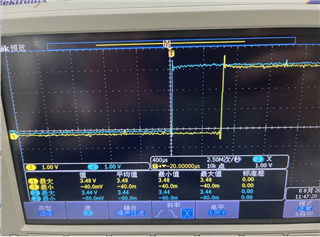
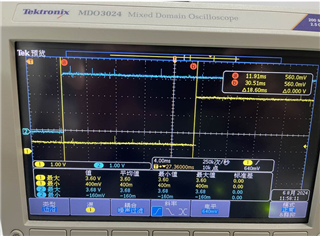
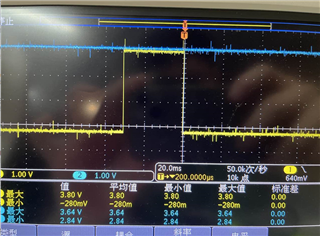
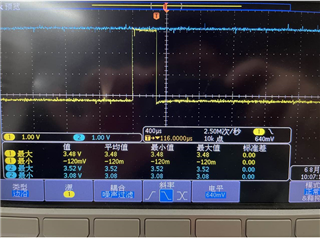
The SBL data I measured are as follows:
Measurement methods:
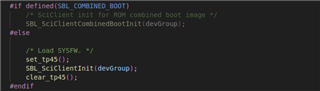
1.
2.
3.
4.
5....
