This thread has been locked.

If you have a related question, please click the "Ask a related question" button in the top right corner. The newly created question will be automatically linked to this question.

TDA4VM: UDMA QUESTION

Part Number: TDA4VM

Tool/software:

Hi TI,

When in the single-function module, there were no issues with UDMA.

When running with full functionality, we found that the UDMA callback was not triggered.

At this time, we inspected the UDMA registers,it's no err.

Therefore, we suspect that there is a problem with the UDMA hardware scheduling.

May I ask, what is the maximum processing frequency of UDMA? And what is the maximum processing frequency at the same time?

BR,

Lei

  • Hi Lei,

    Can you please elaborate on what you mean by full functionality? Also are you programming descriptors in the same way? Are you seeing data transfer happening? If the transfer is completed, then there should be a completion callback. 

    Regards,

    Brijesh

  • Hi Brijesh,

    The issue has been resolved from TRM, thank you.

    BR,

    Lei


  • Thanks Lei, closing this ticket. 

  • Hi Lei, Brijesh,

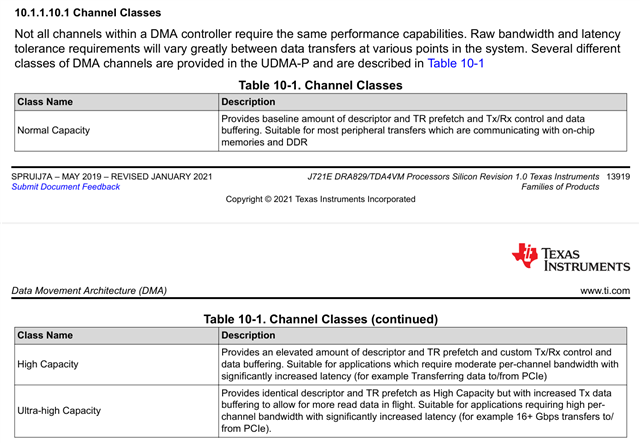
    Customer fixed this issue by change the UDMA channel from HC to UHC channel. customer issue is when they just run the AVM app (partional function), it will not stuck, but they run the parking in the real car (full functional) it will stuck at udma callback. now Car oem want Neusoft give some detail explanation and analysis, so Brijesh we need your help give some comments about this. From TRM I think this may fixed by the more capacity in UHC. do you have some additional explanation about this?

    BR,

    Biao 

  • Hi Biao,

    Strange, even in high load cases, UDMA should still work, it might be delayed, but it should still finish, so if you have timeout on the callback, you might need to increase the timeout, but the callback should still come.. 

    For High capacity channels, as the name suggests, it has higher buffering, so allows cushion in case of high BW scenario.

    Regards,

    Brijesh 

  • Hi Brijesh,

    in high load cases, UDMA should still work, it might be delayed, but it should still finish,

    I agree with this viewpoint, theoretically, it is indeed true. But in reality, the interrupt callback was not triggered. The data is as follows:

    We add statistics at the callback function entry (post count) and before the wait function (receive count).In theory, if the receive count is+1, then the send count is+1. Log:

    At 665s, the last frame of data was sent out with a Count of 10030, followed by an abnormal trigger and Wait entering dead state. The received Count was 10031, as shown in the red block diagram.
    After 179s (At 844s), it can be seen that the post count is still 10030. If the interrupt triggers normally, the sending Count should be 10031. And when the problem occurs, it is confirmed through the UDMA status register that the UDMA status of the last frame is normal, as shown in the yellow block diagram.
    BR,
    Lei
  • Hi Brijesh,

    Can you please elaborate on what you mean by full functionality?

    The main functions are GPU for image preprocessing and 2D stitching, C71 for obstacle detection and parking spot detection, surround view camera * 4 (20fps), CSITX, ETH, ultrasonic sensor.

    Load data:

    CPU: mpu1_0: TOTAL LOAD =  66.66 % ( HWI =  11.11 %, SWI =   0. 0 % )
    CPU: mcu2_0: TOTAL LOAD =  33. 0 % ( HWI =   0. 0 %, SWI =   0. 0 % )
    CPU: mcu2_1: TOTAL LOAD =   3. 0 % ( HWI =   0. 0 %, SWI =   0. 0 % )
    CPU: mcu3_0: TOTAL LOAD =   2. 0 % ( HWI =   0. 0 %, SWI =   0. 0 % )
    CPU: mcu3_1: TOTAL LOAD =  12. 0 % ( HWI =   0. 0 %, SWI =   0. 0 % )
    CPU:  c6x_1: TOTAL LOAD =   0. 0 % ( HWI =   0. 0 %, SWI =   0. 0 % )
    CPU:  c6x_2: TOTAL LOAD =   0. 0 % ( HWI =   0. 0 %, SWI =   0. 0 % )
    CPU:  c7x_1: TOTAL LOAD = 100. 0 % ( HWI =   0. 0 %, SWI =   0. 0 % )
    
    
    HWA performance statistics,
    ===========================
    
    HWA:   LDC : LOAD = 143.22 % ( 816 MP/s )
    
    
    DDR performance statistics,
    ===========================
    
    DDR: READ  BW: AVG =   3481 MB/s, PEAK =  88479 MB/s
    DDR: WRITE BW: AVG =   1589 MB/s, PEAK =   7492 MB/s
    DDR: TOTAL BW: AVG =   5070 MB/s, PEAK =  95971 MB/s
    
    
    Detailed CPU performance/memory statistics,
    ===========================================
    
    DDR_SHARED_MEM: Alloc's: 0 alloc's of 0 bytes
    DDR_SHARED_MEM: Free's : 0 free's  of 0 bytes
    DDR_SHARED_MEM: Open's : 0 allocs  of 0 bytes
    DDR_SHARED_MEM: Total size: 536870912 bytes
    
    CPU: mcu2_0: TASK:           IPC_RX:   0.23 %
    CPU: mcu2_0: TASK:       REMOTE_SRV:  14. 6 %
    CPU: mcu2_0: TASK:        LOAD_TEST:   0. 0 %
    CPU: mcu2_0: TASK:       TIVX_CPU_0:   0. 0 %
    CPU: mcu2_0: TASK:        TIVX_V1NF:   0. 0 %
    CPU: mcu2_0: TASK:      TIVX_V1LDC1:   4.62 %
    CPU: mcu2_0: TASK:       TIVX_V1SC1:   0. 0 %
    CPU: mcu2_0: TASK:      TIVX_V1MSC2:   0. 0 %
    CPU: mcu2_0: TASK:       TIVXVVISS1:   0. 0 %
    CPU: mcu2_0: TASK:       TIVX_CAPT1:   3.32 %
    CPU: mcu2_0: TASK:       TIVX_CAPT2:   0. 0 %
    CPU: mcu2_0: TASK:       TIVX_DISP1:   0. 0 %
    CPU: mcu2_0: TASK:       TIVX_DISP2:   0. 0 %
    CPU: mcu2_0: TASK:       TIVX_CSITX:   0.46 %
    CPU: mcu2_0: TASK:       TIVX_CAPT3:   0. 0 %
    CPU: mcu2_0: TASK:       TIVX_CAPT4:   0. 0 %
    CPU: mcu2_0: TASK:       TIVX_CAPT5:   0. 0 %
    CPU: mcu2_0: TASK:       TIVX_CAPT6:   0. 0 %
    CPU: mcu2_0: TASK:       TIVX_CAPT7:   0. 0 %
    CPU: mcu2_0: TASK:       TIVX_CAPT8:   0. 0 %
    CPU: mcu2_0: TASK:      TIVX_DPM2M1:   0. 0 %
    CPU: mcu2_0: TASK:      TIVX_DPM2M2:   0. 0 %
    CPU: mcu2_0: TASK:      TIVX_DPM2M3:   0. 0 %
    CPU: mcu2_0: TASK:      TIVX_DPM2M4:   0. 0 %
    
    CPU: mcu2_0: HEAP:    DDR_LOCAL_MEM: size =   16777216 B, free =   16689664 B ( 99 % unused)
    CPU: mcu2_0: HEAP:           L3_MEM: size =     262144 B, free =     261888 B ( 99 % unused)
    
    CPU: mcu2_1: TASK:           IPC_RX:   0. 0 %
    CPU: mcu2_1: TASK:       REMOTE_SRV:   6. 5 %
    CPU: mcu2_1: TASK:        LOAD_TEST:   0. 0 %
    CPU: mcu2_1: TASK:       TIVX_CPU_1:   0. 0 %
    CPU: mcu2_1: TASK:         TIVX_SDE:   0. 0 %
    CPU: mcu2_1: TASK:         TIVX_DOF:   0. 0 %
    CPU: mcu2_1: TASK:      IPC_TEST_RX:   0. 0 %
    CPU: mcu2_1: TASK:      IPC_TEST_TX:   0. 0 %
    CPU: mcu2_1: TASK:      IPC_TEST_TX:   0. 0 %
    CPU: mcu2_1: TASK:      IPC_TEST_TX:   0. 0 %
    CPU: mcu2_1: TASK:      IPC_TEST_TX:   0. 0 %
    CPU: mcu2_1: TASK:      IPC_TEST_TX:   0. 0 %
    CPU: mcu2_1: TASK:      IPC_TEST_TX:   0. 0 %
    CPU: mcu2_1: TASK:      IPC_TEST_TX:   0. 0 %
    
    CPU: mcu2_1: HEAP:    DDR_LOCAL_MEM: size =   16777216 B, free =   16773376 B ( 99 % unused)
    CPU: mcu2_1: HEAP:           L3_MEM: size =     262144 B, free =     262144 B (100 % unused)
    
    CPU: mcu3_0: TASK:           IPC_RX:   0. 0 %
    CPU: mcu3_0: TASK:       REMOTE_SRV:   7.96 %
    CPU: mcu3_0: TASK:        LOAD_TEST:   0. 0 %
    CPU: mcu3_0: TASK:      TIVX_MCU3_0:   0. 0 %
    CPU: mcu3_0: TASK:      IPC_TEST_RX:   0. 0 %
    CPU: mcu3_0: TASK:      IPC_TEST_TX:   0. 0 %
    CPU: mcu3_0: TASK:      IPC_TEST_TX:   0. 0 %
    CPU: mcu3_0: TASK:      IPC_TEST_TX:   0. 0 %
    CPU: mcu3_0: TASK:      IPC_TEST_TX:   0. 0 %
    CPU: mcu3_0: TASK:      IPC_TEST_TX:   0. 0 %
    CPU: mcu3_0: TASK:      IPC_TEST_TX:   0. 0 %
    CPU: mcu3_0: TASK:      IPC_TEST_TX:   0. 0 %
    
    CPU: mcu3_0: HEAP:    DDR_LOCAL_MEM: size =    8388608 B, free =    8388352 B ( 99 % unused)
    
    CPU: mcu3_1: TASK:           IPC_RX:   2.98 %
    CPU: mcu3_1: TASK:       REMOTE_SRV:   4.81 %
    CPU: mcu3_1: TASK:        LOAD_TEST:   0. 0 %
    CPU: mcu3_1: TASK:      TIVX_MCU3_1:   0. 0 %
    CPU: mcu3_1: TASK:      TIVX_DATA_S:   1.78 %
    CPU: mcu3_1: TASK:      TIVX_LOG_SE:   0.43 %
    CPU: mcu3_1: TASK:      IPC_TEST_RX:   0. 0 %
    CPU: mcu3_1: TASK:      IPC_TEST_TX:   0. 0 %
    CPU: mcu3_1: TASK:      IPC_TEST_TX:   0. 0 %
    CPU: mcu3_1: TASK:      IPC_TEST_TX:   0. 0 %
    CPU: mcu3_1: TASK:      IPC_TEST_TX:   0. 0 %
    CPU: mcu3_1: TASK:      IPC_TEST_TX:   0. 0 %
    CPU: mcu3_1: TASK:      IPC_TEST_TX:   0. 0 %
    CPU: mcu3_1: TASK:      IPC_TEST_TX:   0. 0 %
    
    CPU: mcu3_1: HEAP:    DDR_LOCAL_MEM: size =    8388608 B, free =    8388352 B ( 99 % unused)
    
    CPU:  c6x_1: TASK:           IPC_RX:   0. 0 %
    CPU:  c6x_1: TASK:       REMOTE_SRV:   0. 9 %
    CPU:  c6x_1: TASK:        LOAD_TEST:   0. 0 %
    CPU:  c6x_1: TASK:         TIVX_CPU:   0. 0 %
    CPU:  c6x_1: TASK:      IPC_TEST_RX:   0. 0 %
    CPU:  c6x_1: TASK:      IPC_TEST_TX:   0. 0 %
    CPU:  c6x_1: TASK:      IPC_TEST_TX:   0. 0 %
    CPU:  c6x_1: TASK:      IPC_TEST_TX:   0. 0 %
    CPU:  c6x_1: TASK:      IPC_TEST_TX:   0. 0 %
    CPU:  c6x_1: TASK:      IPC_TEST_TX:   0. 0 %
    CPU:  c6x_1: TASK:      IPC_TEST_TX:   0. 0 %
    CPU:  c6x_1: TASK:      IPC_TEST_TX:   0. 0 %
    
    CPU:  c6x_1: HEAP:    DDR_LOCAL_MEM: size =   16777216 B, free =   16773376 B ( 99 % unused)
    CPU:  c6x_1: HEAP:           L2_MEM: size =     229376 B, free =     229376 B (100 % unused)
    CPU:  c6x_1: HEAP:  DDR_SCRATCH_MEM: size =   50331648 B, free =   50331648 B (100 % unused)
    
    CPU:  c6x_2: TASK:           IPC_RX:   0. 0 %
    CPU:  c6x_2: TASK:       REMOTE_SRV:   0. 9 %
    CPU:  c6x_2: TASK:        LOAD_TEST:   0. 0 %
    CPU:  c6x_2: TASK:         TIVX_CPU:   0. 0 %
    CPU:  c6x_2: TASK:      IPC_TEST_RX:   0. 0 %
    CPU:  c6x_2: TASK:      IPC_TEST_TX:   0. 0 %
    CPU:  c6x_2: TASK:      IPC_TEST_TX:   0. 0 %
    CPU:  c6x_2: TASK:      IPC_TEST_TX:   0. 0 %
    CPU:  c6x_2: TASK:      IPC_TEST_TX:   0. 0 %
    CPU:  c6x_2: TASK:      IPC_TEST_TX:   0. 0 %
    CPU:  c6x_2: TASK:      IPC_TEST_TX:   0. 0 %
    CPU:  c6x_2: TASK:      IPC_TEST_TX:   0. 0 %
    
    CPU:  c6x_2: HEAP:    DDR_LOCAL_MEM: size =   16777216 B, free =   16773376 B ( 99 % unused)
    CPU:  c6x_2: HEAP:           L2_MEM: size =     229376 B, free =     229376 B (100 % unused)
    CPU:  c6x_2: HEAP:  DDR_SCRATCH_MEM: size =   50331648 B, free =   50331648 B (100 % unused)
    
    CPU:  c7x_1: TASK:           IPC_RX:   0. 3 %
    CPU:  c7x_1: TASK:       REMOTE_SRV:   0.92 %
    CPU:  c7x_1: TASK:        LOAD_TEST:   0. 0 %
    CPU:  c7x_1: TASK:      TIVX_C71_P1:  67.91 %
    CPU:  c7x_1: TASK:      TIVX_C71_P2:   0. 0 %
    CPU:  c7x_1: TASK:      TIVX_C71_P3:   0. 0 %
    CPU:  c7x_1: TASK:      TIVX_C71_P4:   0. 0 %
    CPU:  c7x_1: TASK:      TIVX_C71_P5:   0. 0 %
    CPU:  c7x_1: TASK:      TIVX_C71_P6:   0. 0 %
    CPU:  c7x_1: TASK:      TIVX_C71_P7:   0. 0 %
    CPU:  c7x_1: TASK:      TIVX_C71_P8:   0. 0 %
    CPU:  c7x_1: TASK:      IPC_TEST_RX:   0. 0 %
    CPU:  c7x_1: TASK:      IPC_TEST_TX:   0. 0 %
    CPU:  c7x_1: TASK:      IPC_TEST_TX:   0. 0 %
    CPU:  c7x_1: TASK:      IPC_TEST_TX:   0. 0 %
    CPU:  c7x_1: TASK:      IPC_TEST_TX:   0. 0 %
    CPU:  c7x_1: TASK:      IPC_TEST_TX:   0. 0 %
    CPU:  c7x_1: TASK:      IPC_TEST_TX:   0. 0 %
    CPU:  c7x_1: TASK:      IPC_TEST_TX:   0. 0 %
    
    CPU:  c7x_1: HEAP:    DDR_LOCAL_MEM: size =  268435456 B, free =  188335360 B ( 70 % unused)
    CPU:  c7x_1: HEAP:           L3_MEM: size =    8159232 B, free =          0 B (  0 % unused)
    CPU:  c7x_1: HEAP:           L2_MEM: size =     458752 B, free =     458752 B (100 % unused)
    CPU:  c7x_1: HEAP:           L1_MEM: size =      16384 B, free =          0 B (  0 % unused)
    CPU:  c7x_1: HEAP:  DDR_SCRATCH_MEM: size =  385875968 B, free =  385344256 B ( 99 % unused)
    

    BR,
    Lei
  • Hi Lei,

    Do you mean the capture is stuck? On which device are you seeing this issue? Do you see any overflow or any other error? Which SDK release are you using? 

    Regards,

    Brijesh

  • Hi Brijesh,

    Do you mean the capture is stuck?

    It's CSITX.

    Do you see any overflow or any other error?

    No Error.

    For details, please refer to the log analysis.

    when the problem occurs, it is confirmed through the UDMA status register that the UDMA status of the last frame is normal, as shown in the yellow block diagram.

    Which SDK release are you using? 

    SDK8.6.

    BR,

    Lei

  • Hi Lei,

    I dont see CSITX getting stuck from the log. Can you please share the complete log? 

    In the latest release, the only change the we did is to increate some fifo depth, can you please try with this change? 

    Regards,

    Brijesh

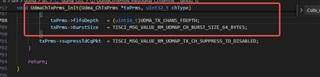
  • Essentially, please add below line of code in Csitx_chCfgInit API in packages\ti\drv\csitx\src\csitx_drvInit.c file.

    #if defined (SOC_J721S2) || defined (SOC_J784S4)
    /*FifoDepth of UDMA transmit channel should be a multiple of PSI-L interface data path
    width in bytes. This parameter is adjusted according to the frame
    size for optimal performance */
    chCfgPrms->txChParams.fifoDepth = ((CSL_NAVSS_UDMAP_TX_CHANS_FDEPTH)/8U)*16U;
    #elif defined (SOC_J721E)
    chCfgPrms->txChParams.fifoDepth = ((CSL_NAVSS_UDMAP_TX_CHANS_FDEPTH)/8U)*8U;
    #endifc

    Regards,

    Brijesh

  • Hi Brijesh,

    I dont see CSITX getting stuck from the log

    The location where the code is stuck:

    The reason for no stuck is due to the following changes:

    tivxEventWait(prms->frame_available, TIVX_EVENT_TIMEOUT_WAIT_FOREVER);
    ==>tivxEventWait(prms->frame_available, 100);
    please add below line of code

    I looked at the code and I don't think the new codes is effective. It will be overwritten by the following code:

    BR,

    Lei

  • Hi Brijesh,

    How are things getting on?

    BR,

    Lei

  • Hi Lei,

    Surprising, CSITX is a transmitter, it does not really wait for the other modules, as long as there is a buffer, it will start transmitting. Even for the DMA, DMA will start transmission as soon as the buffer is submitted to the DMA.

    Are you also using CSIRX in this chain? By any chance, are you seeing overflows or any other errors in the CSIRX? 

    Regards,

    Brijesh

  • Hi Brijesh,

    Are you also using CSIRX in this chain?

    No,only CSITX.

    By any chance, are you seeing overflows or any other errors in the CSIRX? 

    No. This version only has CSITX issues, the scaler has DMA problems in other versions

    BR,

    Lei

  • Hi Lei,

    What else is running in the system ? I see the DDR BW is quite high. From where input images for GPU and obstacle detection algorithm is coming from? 

    DDR: READ BW: AVG = 3481 MB/s, PEAK = 88479 MB/s
    DDR: WRITE BW: AVG = 1589 MB/s, PEAK = 7492 MB/s
    DDR: TOTAL BW: AVG = 5070 MB/s, PEAK = 95971 MB/s

    Also which SDK release are you using? Is it possible to try out on the latest release? 

    Regards,

    Brijesh

  • Hi Brijesh,

    What else is running in the system ? I see the DDR BW is quite high. From where input images for GPU and obstacle detection algorithm is coming from? 

    such as below:

    The main functions are GPU for image preprocessing and 2D stitching, C71 for obstacle detection and parking spot detection, surround view camera * 4 (20fps), CSITX, ETH, ultrasonic sensor.

    I am not aware of more algorithm details. However, even if the usage of DDR is high, the result should be a delayed response rather than an interrupted exception.

    Also which SDK release are you using?

    SDK8.6

    Is it possible to try out on the latest release? 

    SOP is about to be released.The SDK cannot be upgraded.

    BR

    Lei

  • Hi Lei,

    Can you please try keeping value of CSIRX_NUM_STREAM to value 1 in packages/ti/drv/csirx/soc/V0/csirx_soc.h and see if it helps? 

    Regards,

    Brijesh

  • Hi Brijesh,

    We have a problem with TX, why modify RX?

    BR

    Lei

  • Because this is also affecting CSITX. So please try with this change. 

    Regards,

    Brijesh

  • Hi Brijesh,

    Well,let's try.

    BR,

    Lei

  • Hi Lei Tao,

    Any further update on this issue? 

    Regards,

    Brijesh

  • Hi Brijesh,

    This issue have not yet been updated.

    BR,

    Lei

  • ok, i will keep it in waiting status.