This thread has been locked.

If you have a related question, please click the "Ask a related question" button in the top right corner. The newly created question will be automatically linked to this question.

AM3352: What are the functions of EMU2, EMU3, and EMU4?

Part Number: AM3352

Tool/software:

Hi All,

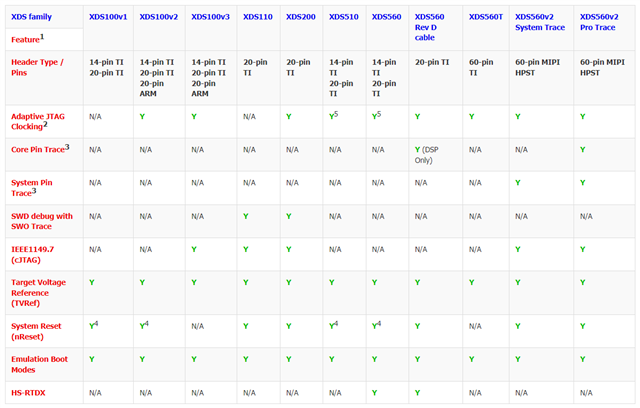
We are planning to build an evaluation board on our side and implement a JTAG connector, but in case of AM335x, there are 14-pin and 20-pin,
and we are wondering which one we should use.
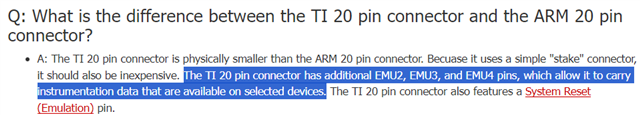
In the case of the 20-pin connector, the following URL says that it is possible to “collect high-speed measurement and trace information with EMU2, EMU3, and EMU4? I am not sure what this is.

https://software-dl.ti.com/ccs/esd/documents/xdsdebugprobes/emu_jtag_connectors.html

Best Regards,

Ito

  • Some debuggers that connect to the device via the JTAG connector have a trace buffer that is bigger than the on-chip trace buffer. These signals can be used to stream trace information from the device to the trace buffer located in the debugger. You will need to research your debugger and its software to know if it supports this capability.

    Regards,
    Paul

  • Hi Paul,

    Thank you for your reply.

    Can I use that feature with the XDS200?

    Best regards,

    Ito

  • No, the XDS200 doesn't support external trace.

    The team answering questions on this E2E forum do not have much experience with the various debuggers and their capabilities. I was told there is a E2E forum for Code Composer Studio (CCS) and the team monitoring that thread are better able to answer questions about debugger capabilities.

    Regards,
    Paul

  • Hi  Paul,

    Here it says that the TI20 pin, which can be used with the XDS200, can transmit measurement data.


    However, the table says that pin trace and core trace cannot be used.
    Is it possible to do software trace debugging with AM335, XDS200 and TI 20pin?
    What is the difference between the normal trace function, core trace, and pin trace?

    Best Regards,

    Ito

  • Pin Trace has several dependencies where the device, board, debug probe, and CCS needs to support it. You typically need an XDS560v2 ProTrace pod for pin trace.

    If you device has an ETB, you may be able to use the ETB for core trace.

    Is it possible to do software trace debugging with AM335, XDS200 and TI 20pin?

    ETB trace may be available. Check your device documentation.

    What is the difference between the normal trace function, core trace, and pin trace?

    See this section of the User's Guide:

    https://software-dl.ti.com/ccs/esd/documents/users_guide/ccs_debug-main.html#core-trace

    Thanks

    ki