This thread has been locked.

If you have a related question, please click the "Ask a related question" button in the top right corner. The newly created question will be automatically linked to this question.

SK-AM62A-LP: Problem with onnx model artifact generation

Part Number:  SK-AM62A-LP

Tool/software:

Hello, 

I wanted to ask that the model artifact generation script that is available on github(onnxrt_ep.py), does it only generate artifacts for one output(final node)? 

Because my model contains two outputs, one of them is from an intermediate layer.
So, when I run this line of code :  

output_names = [output.name for output in ort_session.get_outputs()]

the output_names I get are ['output', 'input.332'] 

but when I run this line of code : 

outputs = ort_session.run(output_names, {input_name: input_data})

The outputs I get are [None, array(valid)]. 

How can I generetae it for both these outputs?

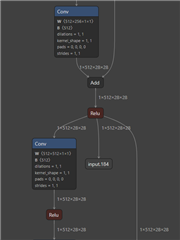
I have also attached an image to show the intermediate output. 

Thank you
  • Hi Pragya,

    This is the same topic as we are discussing in the following thread, correct?

    - https://e2e.ti.com/support/processors-group/processors/f/processors-forum/1411919/sk-am62a-lp-problem-running-inference-script-after-model-artifact-generation

    Let's shift the discussion of that to this thread since you have created a title directly related to the issue at hand. For convenience, I'm pasting my response below so we can continue the support topic here. I'll mark the other thread as solved.

    """

    Hello,

    No, this issue is more likely internal to the what the model compilation/import tool is doing. If you are okay with it, please share your artifacts directory.

    You can check how many outputs TIDL is using from the onnxrtMetaData.txt. You can also visualize how the model was parsed by looking at the SVG files with the artifacts/tempDir subdirectory. If you open in a browser, hovering your mouse over nodes will show additional information. I would suggest doing this for the intermediate node you also want treated as an output.

    """

    BR,

    Reese

  • Porting a follow-up note from Pragya on previous thread into this issue for better consistency:

    """

    Hello, thank you for your reply.

    I have already checked the onnxrtMetaData.txt. and it is only taking one output for some reason. 

    Here is the link to the model artifacts folder : https://drive.google.com/drive/folders/18FYxpObW7Rp6MInwUvXbfr0VWB9e-RBj?usp=sharing

    Thank you :)

    """

  • Thanks for supplying the model artifacts. That is helpful, and the issue is more clear to me now

    Important: could you please include the SDK version you are using here? It should be clear from the git version tag in the edgeai-tidl-tools repo (which I assume you are using to compile). I estimate it is either 9.0 or 9.1. I would suggest at

    I would consider this behavior a bug. In the runtimes_visualization.svg, I can see that it has parsed the output from an intermediate node in the graph. However, it is not actually a part of the subgraph that will run on the accelerator, so there's some disconnect. 

    Here's what I would suggest at this stage:

    BR,
    Reese

  • Hello, thank you for your reply. 

    The SDK version I am using is indeed 9.1
    Does this problem not occur with 9.2?  I would be grateful if the rule can be added to tidl_onnx_model_optimizer.

    In the meanwhile I will try to implement the workaround by myself. 
    Just a query, when I add this buffer node to between the two output nodes then at the end now I am only expecting a single final output instead of two right?  because another issue I am facing if I try to add an identity node which has input node input.184 and output node input.332 is onnx.onnx_cpp2py_export.shape_inference.InferenceError: [ShapeInferenceError] (op_type:Identity, node name: custom_added_Identity0): [ShapeInferenceError] Inferred shape and existing shape differ in dimension 1: (512) vs (1024)

    Because input.184 has shape (1,512,28,28) and input.332 has shape (1,1024,14,14)

    Thaks Slight smile

  • Hi Pragya,

    Reese is out of office this week. Please, expect delay int he response.

    Best regards,

    Qutaiba

  • Hi Pragya,

    Thanks for the patience.

    I would recommend upgrading to the latest SDK 10.0 since there are many bugfixes and improvements to robustness. I suggest trying your compilation again with the 10.0.0.6 tools

    Your final model should have the number of outputs you originally wanted (2). The workaround is to buffer the actual outputs from *also* being the input to another node (inputs to the overall graph should remain untouched). I think we had a miscommunication -- let me describe for your scenario.

    You should be adding some buffer-style node with:

    • input="input.184" and
    • output="input.184.BUFFERED" (name here doesn't matter here).
    • Ensure that the graph outputs are now "input.332" and "input.184.BUFFERED" (same name as above)

    You can leave input.332 untouched. It is not being affected, so far as I can tell.

    We're trying to workaround the fact that this accelerator is very intentional with memory and storing tensors. Any input/output must be mapped to DDR somewhere, but internal tensors for the graph are not restricted this way. If a tensor can exist in internal memory like cache, if will for performance benefit. By making a buffer node such that the output is not also an intermediate tensor, then it can be explicitly mapped as an output.

    BR,

    Reese

  • Hello, thanks for your reply. I did try to compile artifacts with SDK 9.2 and it gave me two outputs and correct model artifacts but I was unable to use them on my board (I got an error) because the SDK there is 9.1

    Wouldn't I run into the same problem with SDK 10.0.0.6?

  • Hi Pragya,

    I did try to compile artifacts with SDK 9.2 and it gave me two outputs and correct model artifacts

    Does this run accurately enough in host emulation? You can run the same command as compilation, but without the -c tag. You may want to provide your own images and check the visualized outputs (or even insert some of your own postprocessing/accuracy checks --- depends on you rmodel. I want to be sure that the outputs in this 9.2 version are also correct.

    - If this is true, then 9.2 and 10.0 do not require the workaround we discussed. 

    It is true that the artifacts are locked to the SDK version. The artifacts you generated with 9.1 tidl_tools will only work for 9.1 SDK. Is it acceptable to reflash your SD card / EVM with the 9.2 SDK? I would more strongly suggest upgrading all the way to 10.0 if possible. 

    BR,
    Reese

  • Hi Reese, I just tried this workaround you suggested : 

    "You should be adding some buffer-style node with:

    • input="input.184" and
    • output="input.184.BUFFERED" (name here doesn't matter here).
    • Ensure that the graph outputs are now "input.332" and "input.184.BUFFERED" (same name as above)"

    and while this does solve the multiple output issue and generates artifacs for both the outputs, it still does not work with my inference script. This is what I get: 
    (venv) root@am62axx-evm:/opt/edgeai-gst-apps/PatchCore_anomaly_detection# python live_detection_onnx_runtime
    /opt/edgeai-gst-apps/PatchCore_anomaly_detection/live_detection_onnx_runtime:9: UserWarning: A NumPy version >=1.23.5 and <2.3.0 is required for this version of SciPy (detected version 1.23.0)
    from scipy.ndimage import gaussian_filter
    libtidl_onnxrt_EP loaded 0x47fa2130
    Final number of subgraphs created are : 1, - Offloaded Nodes - 98, Total Nodes - 98
    APP: Init ... !!!
    MEM: Init ... !!!
    MEM: Initialized DMA HEAP (fd=5) !!!
    MEM: Init ... Done !!!
    IPC: Init ... !!!
    IPC: Init ... Done !!!
    REMOTE_SERVICE: Init ... !!!
    REMOTE_SERVICE: Init ... Done !!!
    8476.313055 s: GTC Frequency = 200 MHz
    APP: Init ... Done !!!
    8476.313197 s: VX_ZONE_INIT:Enabled
    8476.313215 s: VX_ZONE_ERROR:Enabled
    8476.313225 s: VX_ZONE_WARNING:Enabled
    8476.314721 s: VX_ZONE_INIT:[tivxInitLocal:130] Initialization Done !!!
    8476.314922 s: VX_ZONE_INIT:[tivxHostInitLocal:101] Initialization Done for HOST !!!
    8476.357660 s: VX_ZONE_ERROR:[ownContextSendCmd:868] Command ack message returned failure cmd_status: -1
    8476.357733 s: VX_ZONE_ERROR:[ownNodeKernelInit:584] Target kernel, TIVX_CMD_NODE_CREATE failed for node TIDLNode
    8476.357745 s: VX_ZONE_ERROR:[ownNodeKernelInit:585] Please be sure the target callbacks have been registered for this core
    8476.357757 s: VX_ZONE_ERROR:[ownNodeKernelInit:586] If the target callbacks have been registered, please ensure no errors are occurring within the create callback of this kernel
    8476.357771 s: VX_ZONE_ERROR:[ownGraphNodeKernelInit:583] kernel init for node 0, kernel com.ti.tidl:1:2 ... failed !!!
    8476.357790 s: VX_ZONE_ERROR:[vxVerifyGraph:2055] Node kernel init failed
    8476.357801 s: VX_ZONE_ERROR:[vxVerifyGraph:2109] Graph verify failed
    TIDL_RT_OVX: ERROR: Verifying TIDL graph ... Failed !!!
    TIDL_RT_OVX: ERROR: Verify OpenVX graph failed
    Model loading time: 1.2428 seconds
    FAISS index loading time: 0.0117 seconds
    [ WARN:0@30.237] global /usr/src/debug/opencv/4.5.5-r0/git/modules/videoio/src/cap_gstreamer.cpp (1405) open OpenCV | GStreamer warning: Cannot query video position: status=0, value=-1, duration=-1
    Frame read time: 0.0186 seconds
    Frame preprocessing time: 0.0737 seconds
    ['input.332', 'add_output']
    8476.695579 s: VX_ZONE_ERROR:[ownContextSendCmd:868] Command ack message returned failure cmd_status: -1
    8476.695641 s: VX_ZONE_ERROR:[ownNodeKernelInit:584] Target kernel, TIVX_CMD_NODE_CREATE failed for node TIDLNode
    8476.695654 s: VX_ZONE_ERROR:[ownNodeKernelInit:585] Please be sure the target callbacks h[ 8470.724416] audit: type=1701 audit(1725550658.412:35): auid=4294967295 uid=0 gid=0 ses=4294967295 pid=2326 comm="pt_main_thread" exe="/usr/bin/python3.10" sig=4 res=1
    ave been registered for this core
    8476.695666 s: VX_ZONE_ERROR:[ownNodeKernelInit:586] If the target callbacks have been registered, please ensure no errors are occurring within the create callback of this kernel
    8476.695680 s: VX_ZONE_ERROR:[ownGraphNodeKernelInit:583] kernel init for node 0, kernel com.ti.tidl:1:2 ... failed !!!
    8476.695704 s: VX_ZONE_ERROR:[vxVerifyG[ 8470.773017] audit: type=1334 audit(1725550658.460:36): prog-id=21 op=LOAD
    raph:2055] Node kernel init failed
    8476.695715 s: VX_ZONE_ER[ 8470.784088] audit: type=1334 audit(1725550658.472:37): prog-id=22 op=LOAD
    ROR:[vxVerifyGraph:2109] Graph verify failed
    8476.695836 s: VX_ZONE_ERROR:[ownGraphScheduleGraphWrapper:812] graph is not in a state required to be scheduled
    8476.695849 s: VX_ZONE_ERROR:[vxProcessGraph:747] schedule graph failed
    8476.695859 s: VX_ZONE_ERROR:[vxProcessGraph:752] wait graph failed
    ERROR: Running TIDL graph ... Failed !!!
    Model inference time: 0.0091 seconds
    Shape of feature before pooling: torch.Size([1, 1024, 14, 14])
    Shape of feature before pooling: torch.Size([1, 512, 28, 28])
    [ 8596.690516] audit: type=1334 audit(1725550784.380:38): prog-id=22 op=UNLOAD
    [ 8596.697572] audit: type=1334 audit(1725550784.380:39): prog-id=21 op=UNLOAD
    Illegal instruction (core dumped)


    I don't know why is says illegal instruction. 
    Here are the new generated artifacts : drive.google.com/.../18FYxpObW7Rp6MInwUvXbfr0VWB9e-RBj

    and here is the inference script again for your reference : 

    import os
    import cv2
    import numpy as np
    import torch
    from torchvision import transforms
    import onnxruntime as ort
    import faiss
    from PIL import Image
    from scipy.ndimage import gaussian_filter
    import gi
    import time
    
    gi.require_version('Gst', '1.0')
    from gi.repository import Gst
    
    # Import necessary components from train.py
    from train import embedding_concat, reshape_embedding, min_max_norm, cvt2heatmap, heatmap_on_image, get_args
    
    # Define transforms (ensure these match those used in train.py)
    data_transforms = transforms.Compose([
        transforms.Resize((224, 224), Image.LANCZOS),  # Reduced resolution
        transforms.ToTensor(),
        transforms.Normalize(mean=[0.485, 0.456, 0.406], std=[0.229, 0.224, 0.225])
    ])
    inv_normalize = transforms.Normalize(
        mean=[-0.485 / 0.229, -0.456 / 0.224, -0.406 / 0.225],
        std=[1 / 0.229, 1 / 0.224, 1 / 0.225]
    )
    
    def gstreamer_pipeline():
        return (
            'v4l2src device=/dev/video3 io-mode=dmabuf-import ! '
            'video/x-bayer, width=640, height=480, framerate=15/1, format=rggb10 ! '
            'tiovxisp sink_0::device=/dev/v4l-subdev2 sensor-name="SENSOR_SONY_IMX219_RPI" '
            'dcc-isp-file=/opt/imaging/imx219/linear/dcc_viss_10b_640x480.bin sink_0::dcc-2a-file=/opt/imaging/imx219/linear/dcc_2a_10b_640x480.bin '
            '! video/x-raw, format=NV12, width=640, height=480, framerate=15/1 ! '
            'videoconvert ! video/x-raw, format=BGR ! appsink'
        )
    
    def heatmap_on_image(heatmap, image, alpha=0.5, colormap=cv2.COLORMAP_JET):
        if heatmap.shape != image.shape:
            heatmap = cv2.resize(heatmap, (image.shape[1], image.shape[0]))
        heatmap = cv2.applyColorMap(np.uint8(heatmap), colormap)
        overlay = cv2.addWeighted(heatmap, alpha, image, 1 - alpha, 0)
        return overlay
    
    def main():
        # Initialize GStreamer
        Gst.init(None)
    
        # Timing model load
        start_time = time.time()
        
        # Path to the ONNX model file
        onnx_model_path = '/opt/edgeai-tidl-artifacts/cl-ort-patchcore/patchcore_model.onnx'
    
        options = {
            'artifacts_folder': '/opt/edgeai-tidl-artifacts/cl-ort-patchcore'
        }
    
        so = ort.SessionOptions()
        
        # Specify execution providers with TIDL configuration
        ep_list = ['TIDLExecutionProvider', 'CPUExecutionProvider']
        
        # Load the ONNX model with TIDL acceleration
        ort_session = ort.InferenceSession(onnx_model_path, providers=ep_list, provider_options=[options, {}], sess_options=so)
    
        model_load_time = time.time() - start_time
        print(f"Model loading time: {model_load_time:.4f} seconds")
    
        # Get input and output details
        input_name = ort_session.get_inputs()[0].name
        output_names = [output.name for output in ort_session.get_outputs()]
    
        # Get arguments
        args = get_args()
    
        # Update the dataset path to your actual path on the board
        args.dataset_path = '/opt/edgeai-gst-apps/PatchCore_anomaly_detection'
        args.category = 'bottle'  # Ensure this is set to the correct category
    
        # Load the FAISS index
        start_time = time.time()
        index_path = os.path.join(args.dataset_path, 'embeddings', args.category, 'index.faiss')
        index = faiss.read_index(index_path)
        if torch.cuda.is_available():
            res = faiss.StandardGpuResources()
            index = faiss.index_cpu_to_gpu(res, 0, index)
        faiss_load_time = time.time() - start_time
        print(f"FAISS index loading time: {faiss_load_time:.4f} seconds")
    
        # Function to run inference on ONNX model
        def run_onnx_inference(ort_session, input_data):
            start_time = time.time()
            outputs = ort_session.run(output_names, {input_name: input_data})
            inference_time = time.time() - start_time
            print(f"Model inference time: {inference_time:.4f} seconds")
            return outputs
    
        # Initialize video capture with GStreamer pipeline
        cap = cv2.VideoCapture(gstreamer_pipeline(), cv2.CAP_GSTREAMER)
    
        if not cap.isOpened():
            print("Error: Unable to open video source.")
            return
    
        frame_count = 0
        total_processing_time = 0
    
        while cap.isOpened():
            start_time = time.time()
            ret, frame = cap.read()
            if not ret:
                break
    
            frame_read_time = time.time() - start_time
            print(f"Frame read time: {frame_read_time:.4f} seconds")
    
            # Preprocess frame
            start_time = time.time()
            pil_img = Image.fromarray(cv2.cvtColor(frame, cv2.COLOR_BGR2RGB))
            input_tensor = data_transforms(pil_img).unsqueeze(0).numpy().astype(np.float32)
            preprocessing_time = time.time() - start_time
            print(f"Frame preprocessing time: {preprocessing_time:.4f} seconds")
    
            # Run ONNX inference
            start_time = time.time()
            features = run_onnx_inference(ort_session, input_tensor)
    
            inference_time = time.time() - start_time
    
            # Convert features to tensors
            start_time = time.time()
            features = [torch.tensor(f) for f in features]
    
            # Extract embeddings and perform the same steps as in the test_step
            embeddings = []
            for feature in features:
                m = torch.nn.AvgPool2d(3, 1, 1)
                embeddings.append(m(feature))
            embedding_ = embedding_concat(embeddings[0], embeddings[1])
            embedding_test = np.array(reshape_embedding(np.array(embedding_)))
            feature_extraction_time = time.time() - start_time
            print(f"Feature extraction time: {feature_extraction_time:.4f} seconds")
    
            # Search the FAISS index
            start_time = time.time()
            score_patches, _ = index.search(embedding_test, k=args.n_neighbors)
            faiss_search_time = time.time() - start_time
            print(f"FAISS search time: {faiss_search_time:.4f} seconds")
    
            # Postprocess anomaly map
            start_time = time.time()
            anomaly_map = score_patches[:, 0].reshape((28, 28))
            N_b = score_patches[np.argmax(score_patches[:, 0])]
            w = (1 - (np.max(np.exp(N_b)) / np.sum(np.exp(N_b))))
            score = w * max(score_patches[:, 0])  # Image-level score
    
            anomaly_map_resized = cv2.resize(anomaly_map, (224, 224))
            anomaly_map_resized_blur = gaussian_filter(anomaly_map_resized, sigma=2)  # Reduced sigma for faster processing
    
            anomaly_map_norm = min_max_norm(anomaly_map_resized_blur)
            anomaly_map_norm_hm = cvt2heatmap(anomaly_map_norm * 255)
            anomaly_map_norm_hm_resized = cv2.resize(anomaly_map_norm_hm, (frame.shape[1], frame.shape[0]))
            heatmap_overlay_time = time.time() - start_time
            print(f"Heatmap overlay time: {heatmap_overlay_time:.4f} seconds")
    
            hm_on_img = heatmap_on_image(anomaly_map_norm_hm_resized, frame, alpha=0.3)  # More transparent overlay
    	        # Display result
            start_time = time.time()
            cv2.imshow('Anomaly Detection', hm_on_img)
            display_time = time.time() - start_time
            print(f"Display time: {display_time:.4f} seconds")
    
            frame_processing_time = time.time() - start_time
            total_processing_time += frame_processing_time
            frame_count += 1
            print(f"Frame processing time: {frame_processing_time:.4f} seconds")
    
            if cv2.waitKey(1) & 0xFF == ord('q'):
                break
    
        cap.release()
        cv2.destroyAllWindows()
    
        average_processing_time = total_processing_time / frame_count if frame_count else 0
        print(f"Average frame processing time: {average_processing_time:.4f} seconds")
    
    if __name__ == '__main__':
        main()


  • Hi Pragya,

    8476.357660 s: VX_ZONE_ERROR:[ownContextSendCmd:868] Command ack message returned failure cmd_status: -1
    8476.357733 s: VX_ZONE_ERROR:[ownNodeKernelInit:584] Target kernel, TIVX_CMD_NODE_CREATE failed for node TIDLNode
    8476.357745 s: VX_ZONE_ERROR:[ownNodeKernelInit:585] Please be sure the target callbacks have been registered for this core
    8476.357757 s: VX_ZONE_ERROR:[ownNodeKernelInit:586] If the target callbacks have been registered, please ensure no errors are occurring within the create callback of this kernel
    8476.357771 s: VX_ZONE_ERROR:[ownGraphNodeKernelInit:583] kernel init for node 0, kernel com.ti.tidl:1:2 ... failed !!!
    8476.357790 s: VX_ZONE_ERROR:[vxVerifyGraph:2055] Node kernel init failed
    8476.357801 s: VX_ZONE_ERROR:[vxVerifyGraph:2109] Graph verify failed

    Okay, so the model failed to initialize. I would first suggest resetting the EVM. If there was a previous failure, then some of the remote cores may be in an unstable state. 

    If it persists, please run `/opt/vx_app_arm_remote_log.out &` in the background, and retry your application. I'd like to see the log in that case. 

    But if it's fine to upgrade SDK's, then I'd suggest we table the model workaround and go off of a software version that has resolved this issue already.

    BR,

    Reese

  • These are the logs I got: 
    (venv) root@am62axx-evm:/opt/edgeai-gst-apps/PatchCore_anomaly_detection# python live_detection_onnx_runtime
    /opt/edgeai-gst-apps/PatchCore_anomaly_detection/live_detection_onnx_runtime:9: UserWarning: A NumPy version >=1.23.5 and <2.3.0 is required for this version of SciPy (detected version 1.23.0)
    from scipy.ndimage import gaussian_filter
    libtidl_onnxrt_EP loaded 0x149a8970
    Final number of subgraphs created are : 1, - Offloaded Nodes - 98, Total Nodes - 98
    APP: Init ... !!!
    MEM: Init ... !!!
    MEM: Initialized DMA HEAP (fd=5) !!!
    MEM: Init ... Done !!!
    IPC: Init ... !!!
    IPC: Init ... Done !!!
    REMOTE_SERVICE: Init ... !!!
    REMOTE_SERVICE: Init ... Done !!!
    966.866539 s: GTC Frequency = 200 MHz
    APP: Init ... Done !!!
    966.866718 s: VX_ZONE_INIT:Enabled
    966.866731 s: VX_ZONE_ERROR:Enabled
    966.866741 s: VX_ZONE_WARNING:Enabled
    966.868125 s: VX_ZONE_INIT:[tivxInitLocal:130] Initialization Done !!!
    966.868318 s: VX_ZONE_INIT:[tivxHostInitLocal:101] Initialization Done for HOST !!!
    966.912100 s: VX_ZONE_ERROR:[ownContextSendCmd:868] Command ack message returned failure cmd_status: -1
    966.912174 s: VX_ZONE_ERROR:[ownNodeKernelInit:584] Target kernel, TIVX_CMD_NODE_CREATE failed for node TIDLNode
    966.912187 s: VX_ZONE_ERROR:[ownNodeKernelInit:585] Please be sure the target callbacks have been registered for this core
    966.912199 s: VX_ZONE_ERROR:[ownNodeKernelInit:586] If the target callbacks have been registered, please ensure no errors are occurring within the create callback of this kernel
    966.912215 s: VX_ZONE_ERROR:[ownGraphNodeKernelInit:583] kernel init for node 0, kernel com.ti.tidl:1:2 ... failed !!!
    966.912233 s: VX_ZONE_ERROR:[vxVerifyGraph:2055] Node kernel init failed
    966.912244 s: VX_ZONE_ERROR:[vxVerifyGraph:2109] Graph verify failed
    TIDL_RT_OVX: ERROR: Verifying TIDL graph ... Failed !!!
    TIDL_RT_OVX: ERROR: Verify OpenVX graph failed
    Model loading time: 1.2135 seconds
    [C7x_1 ] 966.911834 s: VX_ZONE_ERROR:[tivxAlgiVisionAllocMem:194] Failed to Allocate memory record 5 @ space = 17 and size = 26315776 !!!
    [C7x_1 ] 966.911870 s: VX_ZONE_ERROR:[tivxAlgiVisionCreate:358] tivxAlgiVisionAllocMem Failed
    [C7x_1 ] 966.911901 s: VX_ZONE_ERROR:[tivxKernelTIDLCreate:912] tivxAlgiVisionCreate returned NULL
    FAISS index loading time: 0.0094 seconds
    [ WARN:0@30.969] global /usr/src/debug/opencv/4.5.5-r0/git/modules/videoio/src/cap_gstreamer.cpp (1405) open OpenCV | GStreamer warning: Cannot query video position: status=0, value=-1, duration=-1
    Frame read time: 0.0199 seconds
    Frame preprocessing time: 0.0794 seconds
    967.244701 s: VX_ZONE_ERROR:[ownContextSendCmd:868] Command ack message returned failure cmd_status: -1
    967.244765 s: VX_ZONE_ERROR:[ownNodeKernelInit:584] Target kernel, TIVX_CMD_NODE_CREATE failed for node TIDLNode
    967.244778 s: VX_ZONE_ERROR:[ownNodeKernelInit:585] Please be sure the target callbacks h[ 961.278137] audit: type=1701 audit(1725554704.148:30): auid=4294967295 uid=0 gid=0 ses=4294967295 pid=1591 comm="pt_main_thread" exe="/usr/bin/python3.10" sig=4 res=1
    ave been registered for this core
    967.244790 s: VX_ZONE_ERROR:[ownNodeKernelInit:586] If the target callbacks have been registered, please ensure no errors are occurring within the create callback of this kernel
    967.244805 s: VX_ZONE_ERROR:[ownGraphNodeKernelInit:583] kernel init for node 0, kernel com.ti.tidl:1:2 ... failed !!!
    967.244824 s: VX_ZONE_ERROR:[vxVerifyG[ 961.327236] audit: type=1334 audit(1725554704.196:31): prog-id=19 op=LOAD
    raph:2055] Node kernel init failed
    967.244835 s: VX_ZONE_ER[ 961.337610] audit: type=1334 audit(1725554704.208:32): prog-id=20 op=LOAD
    ROR:[vxVerifyGraph:2109] Graph verify failed
    967.244952 s: VX_ZONE_ERROR:[ownGraphScheduleGraphWrapper:812] graph is not in a state required to be scheduled
    967.244964 s: VX_ZONE_ERROR:[vxProcessGraph:747] schedule graph failed
    967.244974 s: VX_ZONE_ERROR:[vxProcessGraph:752] wait graph failed
    ERROR: Running TIDL graph ... Failed !!!
    Model inference time: 0.0090 seconds
    [C7x_1 ] 967.244438 s: VX_ZONE_ERROR:[tivxAlgiVisionAllocMem:194] Failed to Allocate memory record 5 @ space = 17 and size = 26315776 !!!
    [C7x_1 ] 967.244474 s: VX_ZONE_ERROR:[tivxAlgiVisionCreate:358] tivxAlgiVisionAllocMem Failed
    [C7x_1 ] 967.244516 s: VX_ZONE_ERROR:[tivxKernelTIDLCreate:912] tivxAlgiVisionCreate returned NULL
    Shape of feature before pooling: torch.Size([1, 1024, 14, 14])
    Shape of feature before pooling: torch.Size([1, 512, 28, 28])
    [ 1093.981781] audit: type=1334 audit(1725554836.852:33): prog-id=20 op=UNLOAD
    [ 1093.988863] audit: type=1334 audit(1725554836.852:34): prog-id=19 op=UNLOAD
    Illegal instruction (core dumped)

    And no, I don't think upgrading the software would be the best choice for me right now. thank you 

  • Hello, I think I figured out what the issue was. The features I was getting were in the order : [input.332, input.184.buffered] but expected was [input.184.buffered, input.332]. So, after swapping features positions, now the artifacts are working alright with the workaround you suggested. 

    But, while the model inference time has now reduced after being on the accelerator, the search algo I am using that is the FAISS is pretty slow and causing a bottleneck in my inference script. Is there any way that I can deploy the FAISS to the accelerator as well? Thank you for all your help :) 

  • Hi Pragya, 

    To be clear, you resolved the error that was showing up in the previous message, correct?

    [C7x_1 ] 966.911834 s: VX_ZONE_ERROR:[tivxAlgiVisionAllocMem:194] Failed to Allocate memory record 5 @ space = 17 and size = 26315776 !!!
    [C7x_1 ] 966.911870 s: VX_ZONE_ERROR:[tivxAlgiVisionCreate:358] tivxAlgiVisionAllocMem Failed
    [C7x_1 ] 966.911901 s: VX_ZONE_ERROR:[tivxKernelTIDLCreate:912] tivxAlgiVisionCreate returned NULL

    If that's fixed with your model update, then great progress!

    search algo I am using that is the FAISS

    I'm not familiar with this algorithm, so it's hard to say. We do not currently support general purpose programming of the C7x DSP, so if you wanted an algorithm like this to run on the accelerator, it would need to be composed of supported NN operators. I estimate that is not true, or at least nontrivial. Depending on how much speedup you need, this may require a creative solution. 

    Best Regards,
    Reese

  • Yes, I resolved that issue. But I don't know why when I use the model with the artifacts(basically with TIDLExecutionProvider to deploy it on the accelarator), it gives me the same feature vecor as output for every frame which is weird because the model in isolation(when running on just CPUExecutionProvider) does not do that. 

    This makes me feel that the generated artifacts could still be problematic.

    These are my artifacts : drive.google.com/.../18FYxpObW7Rp6MInwUvXbfr0VWB9e-RBj

  • Hi Pragya,

    it gives me the same feature vecor as output for every frame

    That is strange. This makes me think that a fault happened earlier, and that the model isn't truly running. I have seen this before where a model seems to run without issue but the accelerator has actually fallen into an unstable state from a previous error. In this case, a chunk of data placed at the output's location in memory is being read every time, and is not impacted by the network (seemingly) running. 

    I assume you are changing the input  -- otherwise the same input should always produce the same output. 

    I'll take a look at the artifacts too. I'd suggest:

    • Restart the EVM so SW is in a fresh state
    • run `/opt/vx_app_arm_remote_log.out &` in the background
    • run `export TIDL_RT_DEBUG=1`
    • Run your script.
    • Save the output and share the log here.  

    At that point, is the error still persisting?

    BR,
    Reese

  • Hello,  PFA the log file.tidl_debug_log.txt

    for some reason, I also got these errors while running my script(but I do not get them everytime, just in some runs) : 
    Final number of subgraphs created are : 1, - Offloaded Nodes - 98, Total Nodes - 98
    APP: Init ... !!!
    MEM: Init ... !!!
    MEM: Initialized DMA HEAP (fd=5) !!!
    MEM: Init ... Done !!!
    IPC: Init ... !!!
    IPC: Init ... Done !!!
    REMOTE_SERVICE: Init ... !!!
    REMOTE_SERVICE: Init ... Done !!!
    1883.029103 s: GTC Frequency = 200 MHz
    APP: Init ... Done !!!
    1883.029326 s: VX_ZONE_INIT:Enabled
    1883.029355 s: VX_ZONE_ERROR:Enabled
    1883.029365 s: VX_ZONE_WARNING:Enabled
    1883.030861 s: VX_ZONE_INIT:[tivxInitLocal:130] Initialization Done !!!
    1883.031096 s: VX_ZONE_INIT:[tivxHostInitLocal:101] Initialization Done for HOST !!!
    1883.074069 s: VX_ZONE_ERROR:[ownContextSendCmd:868] Command ack message returned failure cmd_status: -1
    1883.074115 s: VX_ZONE_ERROR:[ownNodeKernelInit:584] Target kernel, TIVX_CMD_NODE_CREATE failed for node TIDLNode
    1883.074139 s: VX_ZONE_ERROR:[ownNodeKernelInit:585] Please be sure the target callbacks have been registered for this core
    1883.074150 s: VX_ZONE_ERROR:[ownNodeKernelInit:586] If the target callbacks have been registered, please ensure no errors are occurring within the create callback of this kernel
    1883.074165 s: VX_ZONE_ERROR:[ownGraphNodeKernelInit:583] kernel init for node 0, kernel com.ti.tidl:1:2 ... failed !!!
    1883.074183 s: VX_ZONE_ERROR:[vxVerifyGraph:2055] Node kernel init failed
    1883.074194 s: VX_ZONE_ERROR:[vxVerifyGraph:2109] Graph verify failed
    TIDL_RT_OVX: ERROR: Verifying TIDL graph ... Failed !!!
    TIDL_RT_OVX: ERROR: Verify OpenVX graph failed
    [ WARN:0@30.965] global /usr/src/debug/opencv/4.5.5-r0/git/modules/videoio/src/cap_gstreamer.cpp (1405) open OpenCV | GStreamer warning: Cannot query video position: status=0, value=-1, duration=-1
    1883.629457 s: VX_ZONE_ERROR:[ownContextSendCmd:868] Command ack message returned failure cmd_status: -1
    1883.629502 s: VX_ZONE_ERROR:[ownNodeKernelInit:584] Target kernel, TIVX_CMD_NODE_CREATE failed for node TIDLNode
    1883.629526 s: VX_ZONE_ERROR:[ownNodeKernelInit:585] Please be sure the target callbacks have been registered for this core
    1883.629538 s: VX_ZONE_ERROR:[ownNodeKernelInit:586] If the target callbacks have been registered, please ensure no errors are occurring within the create callback of this kernel
    1883.629553 s: VX_ZONE_ERROR:[ownGraphNodeKernelInit:583] kernel init for node 0, kernel com.ti.tidl:1:2 ... failed !!!
    1883.629572 s: VX_ZONE_ERROR:[vxVerifyGraph:2055] Node kernel init failed
    1883.629583 s: VX_ZONE_ERROR:[vxVerifyGraph:2109] Graph verify failed
    1883.629701 s: VX_ZONE_ERROR:[ownGraphScheduleGraphWrapper:812] graph is not in a state required to be scheduled
    1883.629713 s: VX_ZONE_ERROR:[vxProcessGraph:747] schedule graph failed
    1883.629724 s: VX_ZONE_ERROR:[vxProcessGraph:752] wait graph failed
    ERROR: Running TIDL graph ... Failed !!!
    /opt/edgeai-gst-apps/PatchCore_anomaly_detection/live_detection_gui_train:323: RuntimeWarning: overflow encountered in exp
    w = (1 - (np.max(np.exp(N_b)) / np.sum(np.exp(N_b))))
    /opt/edgeai-gst-apps/PatchCore_anomaly_detection/live_detection_gui_train:323: RuntimeWarning: invalid value encountered in float_scalars
    w = (1 - (np.max(np.exp(N_b)) / np.sum(np.exp(N_b))))
    /opt/edgeai-gst-apps/PatchCore_anomaly_detection/train.py:181: RuntimeWarning: invalid value encountered in divide
    return (image-a_min)/(a_max - a_min)
    1883.821143 s: VX_ZONE_ERROR:[ownContextSendCmd:868] Command ack message returned failure cmd_status: -1
    1883.821219 s: VX_ZONE_ERROR:[ownNodeKernelInit:584] Target kernel, TIVX_CMD_NODE_CREATE failed for node TIDLNode
    1883.821262 s: VX_ZONE_ERROR:[ownNodeKernelInit:585] Please be sure the target callbacks have been registered for this core
    1883.821275 s: VX_ZONE_ERROR:[ownNodeKernelInit:586] If the target callbacks have been registered, please ensure no errors are occurring within the create callback of this kernel
    1883.821289 s: VX_ZONE_ERROR:[ownGraphNodeKernelInit:583] kernel init for node 0, kernel com.ti.tidl:1:2 ... failed !!!
    1883.821309 s: VX_ZONE_ERROR:[vxVerifyGraph:2055] Node kernel init failed
    1883.821320 s: VX_ZONE_ERROR:[vxVerifyGraph:2109] Graph verify failed
    1883.821439 s: VX_ZONE_ERROR:[ownGraphScheduleGraphWrapper:812] graph is not in a state required to be scheduled
    1883.821451 s: VX_ZONE_ERROR:[vxProcessGraph:747] schedule graph failed
    1883.821462 s: VX_ZONE_ERROR:[vxProcessGraph:752] wait graph failed
    ERROR: Running TIDL graph ... Failed !!!


  • Hi Pragya,

    I'm going to load up the model artifacts and see what I can learn. 

    First reaction on seeing the logs is that there's some fail-silent behavior going on -- the model initialized the first time and seems to run well, but there is actually some fault that causes the model to not truly complete, and it just keeps replaying the same output tensor. Then when it tries to initialize the model the second time the application is run, the error is no longer silent, and it fails to setup the model on the accelerator. I have seen this behavior in the past, and I'll see if that's what we're running into here.

    Do you happen to have a version of your compilation log saved? Sometimes that completes but displays warnings / errors indicating that there may be a failure later on the device. This seems more likely to happen when there are fairly large tensors (relative to the size of the 224kB L2 cache). If you don't have the log on hand, could you rerun compilation with debug_level=2? 

    Edit: I think I have an older version of the artifacts. I can't reproduce the error with these, but I also notice the model isn't giving output for both network outputs. This network shows 97 nodes as opposed to the 98  shown in your situation.

    • NB: this was still informative. The output is not static between different frames and iterations, nor is the model initialization unstable on this version of the model. I am worried that the workaround to force input.184 to be output squashed one bug and produced another. What type of node did you use to buffer this intermediate output from a network output? Identity?

    Edit 2:  Forgive me, I downloaded an older set of artifacts from an earlier link in this thread. I pulled one that has the add_output included as well, which I see is just adding 0 to the previous tensor.

    • This is working on my side -- I'm not seeing errors related to starting the model nor do I see static output feature maps. The model runs consistently in ~75ms. Outputs are deterministic for the same input and different for different inputs. Could you share the snippet of your application where you are configuring the runtime via ONNX and then calling it?

    BR,
    Reese

  • Sure, here is the snippet of my application: (I have also attached the entire script code)

    def gstreamer_pipeline():
    return (
    'v4l2src device=/dev/video3 io-mode=dmabuf-import ! '
    'video/x-bayer, width=640, height=480, framerate=15/1, format=rggb10 ! '
    'tiovxisp sink_0::device=/dev/v4l-subdev2 sensor-name="SENSOR_SONY_IMX21
    'dcc-isp-file=/opt/imaging/imx219/linear/dcc_viss_10b_640x480.bin sink_0
    'video/x-raw, format=NV12, width=640, height=480, framerate=15/1 ! video
    )


    def main():
    # Start timing the model loading process
    start_time = time.time()

    # Load ONNX model
    onnx_model_path = '/opt/edgeai-tidl-artifacts/cl-ort-patchcore/patchcore_model_buffered.onnx'
    options = {

    import cv2
    import numpy as np
    import os
    import torch
    from torchvision import transforms
    import onnxruntime
    import faiss
    from PIL import Image
    from scipy.ndimage import gaussian_filter
    import time
    
    # Import necessary components from train.py
    from train import embedding_concat, reshape_embedding, min_max_norm, cvt2heatmap, heatmap_on_image, get_args
    
    # Define transforms (ensure these match those used in train.py)
    data_transforms = transforms.Compose([
        transforms.Resize((256, 256), Image.LANCZOS),
        transforms.ToTensor(),
        transforms.CenterCrop(224),
        transforms.Normalize(mean=[0.485, 0.456, 0.406], std=[0.229, 0.224, 0.225])
    ])
    
    inv_normalize = transforms.Normalize(
        mean=[-0.485 / 0.229, -0.456 / 0.224, -0.406 / 0.225],
        std=[1 / 0.229, 1 / 0.224, 1 / 0.225]
    )
    
    # GStreamer pipeline function for video capture
    def gstreamer_pipeline():
        return (
            'v4l2src device=/dev/video3 io-mode=dmabuf-import ! '
            'video/x-bayer, width=640, height=480, framerate=15/1, format=rggb10 ! '
            'tiovxisp sink_0::device=/dev/v4l-subdev2 sensor-name="SENSOR_SONY_IMX219_RPI" '
            'dcc-isp-file=/opt/imaging/imx219/linear/dcc_viss_10b_640x480.bin sink_0::dcc-2a-file=/opt/imaging/imx219/linear/dcc_2a_10b_640x480.bin format-msb=9 ! '
            'video/x-raw, format=NV12, width=640, height=480, framerate=15/1 ! videoconvert ! video/x-raw, format=BGR ! appsink'
        )
    
    
    def main():
        # Start timing the model loading process
        start_time = time.time()
    
        # Load ONNX model
        onnx_model_path = '/opt/edgeai-tidl-artifacts/cl-ort-patchcore/patchcore_model_buffered.onnx'
        options = {
            'artifacts_folder': '/opt/edgeai-tidl-artifacts/cl-ort-patchcore'
        }
        so = onnxruntime.SessionOptions()
        onnx_session = onnxruntime.InferenceSession(onnx_model_path, providers=['TIDLExecutionProvider','CPUExecutionProvider'],provider_options=[options, {}], sess_options=so)
    
        model_load_time = time.time() - start_time
        print(f"Model loading time: {model_load_time:.4f} seconds")
    
        # Get arguments
        args = get_args()
    
        # Update the dataset path to your actual path
        args.dataset_path = r'C:\Users\Pragya Kapoor\Documents\mvtec\data'
    
        # Load the FAISS index
        start_time = time.time()
        index_path = os.path.join('./embeddings', args.category, 'index.faiss')
        index = faiss.read_index(index_path)
        if torch.cuda.is_available():
            res = faiss.StandardGpuResources()
            index = faiss.index_cpu_to_gpu(res, 0, index)
        faiss_load_time = time.time() - start_time
        print(f"FAISS index loading time: {faiss_load_time:.4f} seconds")
    
        # Function to run inference on ONNX model
        def run_onnx_inference(onnx_session, input_data):
            start_time = time.time()
            input_name = onnx_session.get_inputs()[0].name
            outputs = onnx_session.run(None, {input_name: input_data})
            print(len(outputs))
            inference_time = time.time() - start_time
            print(f"Model inference time: {inference_time:.4f} seconds")
            return outputs
    
        # Initialize video capture using GStreamer pipeline
        cap = cv2.VideoCapture(gstreamer_pipeline(), cv2.CAP_GSTREAMER)
    
        if not cap.isOpened():
            print("Error: Unable to open video source.")
            return
    
        frame_count = 0
        total_processing_time = 0
    
        while cap.isOpened():
            start_time = time.time()
            ret, frame = cap.read()
            if not ret:
                break
    
            frame_read_time = time.time() - start_time
            print(f"Frame read time: {frame_read_time:.4f} seconds")
    
            # Preprocess frame
            start_time = time.time()
            pil_img = Image.fromarray(cv2.cvtColor(frame, cv2.COLOR_BGR2RGB))
            input_tensor = data_transforms(pil_img).unsqueeze(0).numpy()
            preprocessing_time = time.time() - start_time
            print(f"Frame preprocessing time: {preprocessing_time:.4f} seconds")
    
            # Run ONNX inference
            start_time = time.time()
            features = run_onnx_inference(onnx_session, input_tensor)
            features = features[1:]
            features = [features[1],features[0]]
            inference_time = time.time() - start_time
    
            # Convert features to tensors
            start_time = time.time()
            features = [torch.tensor(f) for f in features]
            print(features[0].shape, features[1].shape)
    
            # Extract embeddings and perform the same steps as in the test_step
            embeddings = []
            for feature in features:
                m = torch.nn.AvgPool2d(3, 1, 1)
                embeddings.append(m(feature))
            embedding_ = embedding_concat(embeddings[0], embeddings[1])
            embedding_test = np.array(reshape_embedding(np.array(embedding_)))
            feature_extraction_time = time.time() - start_time
            print(f"Feature extraction time: {feature_extraction_time:.4f} seconds")
    
            # Search the FAISS index
            start_time = time.time()
            score_patches, _ = index.search(embedding_test, k=args.n_neighbors)
            print(f"Score patches: {score_patches}")
    
            faiss_search_time = time.time() - start_time
            print(f"FAISS search time: {faiss_search_time:.4f} seconds")
    
            start_time = time.time()
            anomaly_map = score_patches[:, 0].reshape((28, 28))
            N_b = score_patches[np.argmax(score_patches[:, 0])]
            N_b_max = np.max(N_b)
            w = (1 - (np.max(np.exp(N_b - N_b_max)) / np.sum(np.exp(N_b - N_b_max))))
    
            score = w * max(score_patches[:, 0])  # Image-level score
    
            # Postprocess anomaly map
            anomaly_map_resized = cv2.resize(anomaly_map, (args.input_size, args.input_size))
            anomaly_map_resized_blur = gaussian_filter(anomaly_map_resized, sigma=4)
    
            anomaly_map_norm = min_max_norm(anomaly_map_resized_blur)
            anomaly_map_norm_hm = cvt2heatmap(anomaly_map_norm * 255)
    
            # Resize heatmap to match frame size
            anomaly_map_norm_hm_resized = cv2.resize(anomaly_map_norm_hm, (frame.shape[1], frame.shape[0]))
            heatmap_overlay_time = time.time() - start_time
            print(f"Heatmap overlay time: {heatmap_overlay_time:.4f} seconds")
    
            hm_on_img = heatmap_on_image(anomaly_map_norm_hm_resized, frame)
    
            # Display the anomaly score on the frame
            start_time = time.time()
            cv2.putText(hm_on_img, f'Anomaly Score: {score:.2f}', (10, 30), cv2.FONT_HERSHEY_SIMPLEX, 1, (0, 255, 0), 2,
                        cv2.LINE_AA)
    
            # Display result
            cv2.imshow('Anomaly Detection', hm_on_img)
            display_time = time.time() - start_time
            print(f"Display time: {display_time:.4f} seconds")
    
            frame_processing_time = time.time() - start_time
            total_processing_time += frame_processing_time
            frame_count += 1
            print(f"Frame processing time: {frame_processing_time:.4f} seconds")
    
            if cv2.waitKey(1) & 0xFF == ord('q'):
                break
    
        cap.release()
        cv2.destroyAllWindows()
    
        average_processing_time = total_processing_time / frame_count if frame_count else 0
        print(f"Average frame processing time: {average_processing_time:.4f} seconds")
    
    
    if __name__ == '__main__':
        main()
    
    
    'artifacts_folder': '/opt/edgeai-tidl-artifacts/cl-ort-patchcore'
    }
    so = onnxruntime.SessionOptions()
    onnx_session = onnxruntime.InferenceSession(onnx_model_path, providers=['TIDLExecutionProvider','CPUExecutionProvider'], provider_options=[options, {}], sess_options=so)

    def run_onnx_inference(onnx_session, input_data):
    start_time = time.time()
    input_name = onnx_session.get_inputs()[0].name
    outputs = onnx_session.run(None, {input_name: input_data})
    print(len(outputs))
    inference_time = time.time() - start_time
    print(f"Model inference time: {inference_time:.4f} seconds")
    return outputs

  • Hi Pragya,

    I see you marked one of the previous responses as resolved -- was this intentional? If so, please let me know what the resolution was! This is helpful for others who may find this thread in the future.

    I don't see anything suspicious in your source code -- it all looks ordinary to me.. I'm not sure why you're running into this issue

    Just to be sure I'm looking at the same artifacts that are giving you an error this is the md5sum of the artifacts I tested: 

    root@am62axx-evm:/PATH/TO/ARTIFACTS# md5sum ./* 
    
    1d3b8df05a64f33767cab9e047018b9d  ./input.332_tidl_io_1.bin #paired to patchcore_model.onnx
    bfba552f3a84c0a45391bd7c52afeb95  ./input.332_tidl_net.bin  #paired to patchcore_model.onnx
    0132a5c35d26e1b96532a9872bbd2f35  ./input.332add_output_tidl_io_1.bin #paired to patchcore_model_buffered.onnx
    fd006769ac21f6d5513463ff4d1d40d1  ./input.332add_output_tidl_net.bin #paired to patchcore_model_buffered.onnx
    9c4a416304bc47eb5b19658aa1dcf952  ./onnxrtMetaData.txt
    06b0dba6ba38a0d1df8a7a06992664eb  ./patchcore_model.onnx
    fb013a94347d88222d2a0d1b062d2f60  ./patchcore_model_buffered.onnx

    Can you do a quick version check on the SDK? It should look like the following:


    root@am62axx-evm:~/model-test# echo $EDGEAI_SDK_VERSION 
    09_01_00
    root@am62axx-evm:~/model-test# echo $EDGEAI_VERSION     
    9.1


    Is this running on the SK-AM62A-LP EVM board? Has there been any change to memory maps (DDR regions designated for specific purposes within the software stack)? I assume not for the memory map, since this is a rather invasive change.

    BR,
    Reese

  • hello, I think I marked it resolved by mistake. 

    and the versions are the same, I just checked. 
    I am also using the same artifacts. which model are you using the patchcore_model or patchcore_model_buffered? 

    could you please also check these artifacts : drive.google.com/.../1Q2eeYcSXPrTiuhl4a11NkiXNDSeIcwOg
    they only contain one model. 
    yes, it is running on the SK-AM62A-LP EVM board and no changes have been made to memory maps.
    and yes the problem is still existing, I don't know why. 

  • HI Pragya, no problem.

    I checked that this is using the patchcore_model_buffered version. I get 3 outputs from this model, but one of them resolves as "None" through Python APIs. It looks like the buffered output is present, and this 'None' output is the original input.184

    Let me see if I can replicate with this model -- I needed to request access, so you should see an email. I will also pass along my model testing script in a ZIP file. I will update this later today.

  • Quick update:

    I'm seeing the same behavior as before on my side, at least with my typical model test scripts. Have you tried running on static image files first? I find this to be a helpful early step if the model is giving issues. The rest of the pipeline can be added once we're sure the model is running consistently.

    Please find those scripts within the attachment - you should untar these within the target filesystem. You may need to run the param-yaml-fixer.py script (single arg pointed at the directory with your param.yaml file) before using the model_speed_test.py script. This fixes some format inconsistencies that I've run into across a few different SDK versions. I run the tester script as follows: 

    python3 model_speed_test.py /PATH/TO/ARTIFACTS/ -n 2 -d 2 -p

    This runs 2 iterations (-n) with debug_level 2 (-d), and prints the output (-p) of each inference. It uses a static image file -- I modify the "infile" variable within the script a few times to make sure it's not giving the same output for different inputs. 

    /cfs-file/__key/communityserver-discussions-components-files/791/model_5F00_tester.tar.gz

    This is a strange issue -- it's usually easy to reproduce something like this

    Edit: I see in your logs/application  that you're printing the score patches but not the output feature maps from the model. Can you verify that those are static as well? Let's also make sure the inputs to the model is not the same either; said another way, ensure the frame captured by cv2 looks correct / isn't the same frame each time. It looks like you added a few other libraries like torch and scipy. It would also be good to assert that those functions are resulting in correct outputs off of a known input.

    BR,
    Reese

  • Hello, I ran your scriot and I have attached the output log for the same, it is called model_output.txt

    I also ran my script live_detection.py the code for which I provided earlier and I have attached the log files(with input_tensor, feature_vector and score_patches) for both with accelerator and without accelerator.

     script_without_acc.txtscript_with_acc.txt


    model_output.txt
    (1, 3, 224, 224)
    [None, array([[[[ 69.809425,  85.32263 ,  69.809425, ..., 201.67168 ,
              209.42827 , 108.59244 ],
             [ 46.539616,  77.566025,  62.052822, ..., 232.69809 ,
              232.69809 ,  93.07923 ],
             [ 15.513206,  62.052822,  77.566025, ..., 201.67168 ,
              217.18488 , 100.83584 ],
             ...,
             [ 62.052822, 193.91507 , 209.42827 , ..., 255.9679  ,
              232.69809 ,  69.809425],
             [ 77.566025, 224.94148 , 240.45468 , ..., 217.18488 ,
              201.67168 ,  54.29622 ],
             [ 15.513206,  85.32263 , 100.83584 , ...,  93.07923 ,
              100.83584 ,  38.783012]],
    
            [[  0.      ,   0.      ,   0.      , ...,   0.      ,
                0.      ,  15.513206],
             [  0.      ,   0.      ,   0.      , ...,   0.      ,
                0.      ,  15.513206],
             [  0.      ,   0.      ,   0.      , ...,   0.      ,
                0.      ,  46.539616],
             ...,
             [  0.      ,   0.      ,   0.      , ...,   0.      ,
                0.      ,   7.756603],
             [  0.      ,   0.      ,   0.      , ...,   0.      ,
                0.      ,  93.07923 ],
             [ 54.29622 ,  23.269808,  46.539616, ...,  69.809425,
              124.105644, 162.88866 ]],
    
            [[  7.756603,   0.      ,   0.      , ...,   0.      ,
                0.      ,   0.      ],
             [  7.756603,   0.      ,   7.756603, ...,   0.      ,
                0.      ,   0.      ],
             [  7.756603,   7.756603,  15.513206, ...,   7.756603,
                0.      ,   0.      ],
             ...,
             [  7.756603,   7.756603,   0.      , ...,   0.      ,
                0.      ,   0.      ],
             [  7.756603,   7.756603,   7.756603, ...,   7.756603,
                7.756603,   0.      ],
             [  7.756603,   0.      ,   0.      , ...,   0.      ,
                0.      ,   0.      ]],
    
            ...,
    
            [[  7.756603,   0.      ,   0.      , ...,   7.756603,
                7.756603,   7.756603],
             [  7.756603,   0.      ,   0.      , ...,   7.756603,
                7.756603,   7.756603],
             [  0.      ,   0.      ,   0.      , ...,   7.756603,
                7.756603,   7.756603],
             ...,
             [  7.756603,   0.      ,   7.756603, ...,   7.756603,
                7.756603,   7.756603],
             [  7.756603,   0.      ,   7.756603, ...,   7.756603,
                7.756603,   7.756603],
             [  7.756603,   7.756603,   7.756603, ...,   7.756603,
                7.756603,   7.756603]],
    
            [[  0.      ,   0.      ,   0.      , ...,   0.      ,
                0.      ,   0.      ],
             [  0.      ,   0.      ,  23.269808, ...,   0.      ,
                0.      ,   0.      ],
             [  0.      ,   0.      ,   0.      , ...,   0.      ,
                0.      ,   0.      ],
             ...,
             [  0.      ,   0.      ,   0.      , ...,   0.      ,
                0.      ,   0.      ],
             [  0.      ,   0.      ,   0.      , ...,   0.      ,
                0.      ,   0.      ],
             [  0.      ,   0.      ,   0.      , ...,   0.      ,
                0.      ,   0.      ]],
    
            [[100.83584 ,   0.      ,   0.      , ...,   0.      ,
                0.      ,   7.756603],
             [  0.      ,   0.      ,   0.      , ...,   0.      ,
                0.      ,   0.      ],
             [  0.      ,   0.      ,   0.      , ...,   0.      ,
                0.      ,   0.      ],
             ...,
             [  0.      ,   0.      ,   0.      , ...,   0.      ,
                0.      ,   0.      ],
             [  0.      ,   0.      ,   0.      , ...,   0.      ,
                0.      ,   0.      ],
             [  0.      ,   0.      ,   0.      , ...,   0.      ,
                0.      ,   0.      ]]]], dtype=float32), array([[[[  0.      ,   0.      ,   0.      , ...,   0.      ,
                0.      ,   0.      ],
             [  0.      ,   0.      ,   0.      , ...,   0.      ,
                0.      ,   0.      ],
             [  0.      ,   0.      ,   0.      , ...,   0.      ,
                0.      ,   0.      ],
             ...,
             [  0.      ,   0.      ,   0.      , ...,   0.      ,
                0.      ,   0.      ],
             [  0.      ,   0.      ,   0.      , ...,   0.      ,
                0.      ,   0.      ],
             [  0.      ,   0.      ,   0.      , ...,   0.      ,
                0.      ,   0.      ]],
    
            [[  0.      ,   0.      ,   0.      , ...,   0.      ,
                0.      ,   0.      ],
             [  0.      ,   0.      ,   0.      , ...,   0.      ,
                0.      ,   0.      ],
             [  0.      ,   0.      ,   0.      , ...,   0.      ,
                0.      ,   0.      ],
             ...,
             [  0.      ,   0.      ,   0.      , ...,   0.      ,
                0.      ,   0.      ],
             [  0.      ,   0.      ,   0.      , ...,   0.      ,
                0.      ,   0.      ],
             [  0.      ,   0.      ,   0.      , ...,   0.      ,
                0.      ,   0.      ]],
    
            ...,
    
            [[ 35.35034 ,  35.35034 ,  35.35034 , ...,  35.35034 ,
               35.35034 ,   0.      ],
             [  0.      ,   0.      ,   0.      , ...,   0.      ,
                0.      ,   0.      ],
             [  0.      ,   0.      ,   0.      , ...,   0.      ,
                0.      ,   0.      ],
             ...,
             [ 35.35034 ,   0.      ,   0.      , ...,   0.      ,
                0.      ,   0.      ],
             [  0.      ,   0.      ,   0.      , ...,  35.35034 ,
               35.35034 ,   0.      ],
             [  0.      ,   0.      ,   0.      , ...,   0.      ,
                0.      ,   0.      ]],
    
            [[353.50342 , 282.80273 , 247.4524  , ..., 318.15308 ,
              282.80273 , 318.15308 ],
             [388.85376 , 212.10205 , 106.051025, ..., 247.4524  ,
              176.75171 , 247.4524  ],
             [282.80273 ,  70.70068 ,  35.35034 , ..., 212.10205 ,
              212.10205 , 247.4524  ],
             ...,
             [282.80273 , 318.15308 , 247.4524  , ..., 212.10205 ,
              212.10205 , 247.4524  ],
             [318.15308 , 282.80273 , 282.80273 , ..., 282.80273 ,
              141.40137 , 247.4524  ],
             [388.85376 , 212.10205 , 247.4524  , ..., 212.10205 ,
              282.80273 , 318.15308 ]],
    
            [[  0.      ,   0.      ,   0.      , ...,   0.      ,
                0.      ,   0.      ],
             [  0.      ,   0.      ,   0.      , ...,   0.      ,
                0.      ,   0.      ],
             [  0.      ,   0.      ,   0.      , ...,   0.      ,
                0.      ,   0.      ],
             ...,
             [  0.      ,   0.      ,   0.      , ...,   0.      ,
                0.      ,   0.      ],
             [  0.      ,   0.      ,   0.      , ...,   0.      ,
                0.      ,   0.      ],
             [  0.      ,   0.      ,   0.      , ...,   0.      ,
                0.      ,   0.      ]]]], dtype=float32)]
    Iteration 1, Elapsed Time: 1.4226746559143066
    [None, array([[[[ 69.809425,  85.32263 ,  69.809425, ..., 201.67168 ,
              209.42827 , 108.59244 ],
             [ 46.539616,  77.566025,  62.052822, ..., 232.69809 ,
              232.69809 ,  93.07923 ],
             [ 15.513206,  62.052822,  77.566025, ..., 201.67168 ,
              217.18488 , 100.83584 ],
             ...,
             [ 62.052822, 193.91507 , 209.42827 , ..., 255.9679  ,
              232.69809 ,  69.809425],
             [ 77.566025, 224.94148 , 240.45468 , ..., 217.18488 ,
              201.67168 ,  54.29622 ],
             [ 15.513206,  85.32263 , 100.83584 , ...,  93.07923 ,
              100.83584 ,  38.783012]],
    
            [[  0.      ,   0.      ,   0.      , ...,   0.      ,
                0.      ,  15.513206],
             [  0.      ,   0.      ,   0.      , ...,   0.      ,
                0.      ,  15.513206],
             [  0.      ,   0.      ,   0.      , ...,   0.      ,
                0.      ,  46.539616],
             ...,
             [  0.      ,   0.      ,   0.      , ...,   0.      ,
                0.      ,   7.756603],
             [  0.      ,   0.      ,   0.      , ...,   0.      ,
                0.      ,  93.07923 ],
             [ 54.29622 ,  23.269808,  46.539616, ...,  69.809425,
              124.105644, 162.88866 ]],
    
            [[  7.756603,   0.      ,   0.      , ...,   0.      ,
                0.      ,   0.      ],
             [  7.756603,   0.      ,   7.756603, ...,   0.      ,
                0.      ,   0.      ],
             [  7.756603,   7.756603,  15.513206, ...,   7.756603,
                0.      ,   0.      ],
             ...,
             [  7.756603,   7.756603,   0.      , ...,   0.      ,
                0.      ,   0.      ],
             [  7.756603,   7.756603,   7.756603, ...,   7.756603,
                7.756603,   0.      ],
             [  7.756603,   0.      ,   0.      , ...,   0.      ,
                0.      ,   0.      ]],
    
            ...,
    
            [[  7.756603,   0.      ,   0.      , ...,   7.756603,
                7.756603,   7.756603],
             [  7.756603,   0.      ,   0.      , ...,   7.756603,
                7.756603,   7.756603],
             [  0.      ,   0.      ,   0.      , ...,   7.756603,
                7.756603,   7.756603],
             ...,
             [  7.756603,   0.      ,   7.756603, ...,   7.756603,
                7.756603,   7.756603],
             [  7.756603,   0.      ,   7.756603, ...,   7.756603,
                7.756603,   7.756603],
             [  7.756603,   7.756603,   7.756603, ...,   7.756603,
                7.756603,   7.756603]],
    
            [[  0.      ,   0.      ,   0.      , ...,   0.      ,
                0.      ,   0.      ],
             [  0.      ,   0.      ,  23.269808, ...,   0.      ,
                0.      ,   0.      ],
             [  0.      ,   0.      ,   0.      , ...,   0.      ,
                0.      ,   0.      ],
             ...,
             [  0.      ,   0.      ,   0.      , ...,   0.      ,
                0.      ,   0.      ],
             [  0.      ,   0.      ,   0.      , ...,   0.      ,
                0.      ,   0.      ],
             [  0.      ,   0.      ,   0.      , ...,   0.      ,
                0.      ,   0.      ]],
    
            [[100.83584 ,   0.      ,   0.      , ...,   0.      ,
                0.      ,   7.756603],
             [  0.      ,   0.      ,   0.      , ...,   0.      ,
                0.      ,   0.      ],
             [  0.      ,   0.      ,   0.      , ...,   0.      ,
                0.      ,   0.      ],
             ...,
             [  0.      ,   0.      ,   0.      , ...,   0.      ,
                0.      ,   0.      ],
             [  0.      ,   0.      ,   0.      , ...,   0.      ,
                0.      ,   0.      ],
             [  0.      ,   0.      ,   0.      , ...,   0.      ,
                0.      ,   0.      ]]]], dtype=float32), array([[[[  0.      ,   0.      ,   0.      , ...,   0.      ,
                0.      ,   0.      ],
             [  0.      ,   0.      ,   0.      , ...,   0.      ,
                0.      ,   0.      ],
             [  0.      ,   0.      ,   0.      , ...,   0.      ,
                0.      ,   0.      ],
             ...,
             [  0.      ,   0.      ,   0.      , ...,   0.      ,
                0.      ,   0.      ],
             [  0.      ,   0.      ,   0.      , ...,   0.      ,
                0.      ,   0.      ],
             [  0.      ,   0.      ,   0.      , ...,   0.      ,
                0.      ,   0.      ]],
    
            [[  0.      ,   0.      ,   0.      , ...,   0.      ,
                0.      ,   0.      ],
             [  0.      ,   0.      ,   0.      , ...,   0.      ,
                0.      ,   0.      ],
             [  0.      ,   0.      ,   0.      , ...,   0.      ,
                0.      ,   0.      ],
             ...,
             [  0.      ,   0.      ,   0.      , ...,   0.      ,
                0.      ,   0.      ],
             [  0.      ,   0.      ,   0.      , ...,   0.      ,
                0.      ,   0.      ],
             [  0.      ,   0.      ,   0.      , ...,   0.      ,
                0.      ,   0.      ]],
    
            [[  0.      ,   0.      ,   0.      , ...,   0.      ,
                0.      ,   0.      ],
             [  0.      ,   0.      ,   0.      , ...,   0.      ,
                0.      ,   0.      ],
             [  0.      ,   0.      ,   0.      , ...,   0.      ,
                0.      ,   0.      ],
             ...,
             [  0.      ,   0.      ,   0.      , ...,   0.      ,
                0.      ,   0.      ],
             [  0.      ,   0.      ,   0.      , ...,   0.      ,
                0.      ,   0.      ],
             [  0.      ,   0.      ,   0.      , ...,   0.      ,
                0.      ,   0.      ]],
    
            ...,
    
            [[ 35.35034 ,  35.35034 ,  35.35034 , ...,  35.35034 ,
               35.35034 ,   0.      ],
             [  0.      ,   0.      ,   0.      , ...,   0.      ,
                0.      ,   0.      ],
             [  0.      ,   0.      ,   0.      , ...,   0.      ,
                0.      ,   0.      ],
             ...,
             [ 35.35034 ,   0.      ,   0.      , ...,   0.      ,
                0.      ,   0.      ],
             [  0.      ,   0.      ,   0.      , ...,  35.35034 ,
               35.35034 ,   0.      ],
             [  0.      ,   0.      ,   0.      , ...,   0.      ,
                0.      ,   0.      ]],
    
            [[353.50342 , 282.80273 , 247.4524  , ..., 318.15308 ,
              282.80273 , 318.15308 ],
             [388.85376 , 212.10205 , 106.051025, ..., 247.4524  ,
              176.75171 , 247.4524  ],
             [282.80273 ,  70.70068 ,  35.35034 , ..., 212.10205 ,
              212.10205 , 247.4524  ],
             ...,
             [282.80273 , 318.15308 , 247.4524  , ..., 212.10205 ,
              212.10205 , 247.4524  ],
             [318.15308 , 282.80273 , 282.80273 , ..., 282.80273 ,
              141.40137 , 247.4524  ],
             [388.85376 , 212.10205 , 247.4524  , ..., 212.10205 ,
              282.80273 , 318.15308 ]],
    
            [[  0.      ,   0.      ,   0.      , ...,   0.      ,
                0.      ,   0.      ],
             [  0.      ,   0.      ,   0.      , ...,   0.      ,
                0.      ,   0.      ],
             [  0.      ,   0.      ,   0.      , ...,   0.      ,
                0.      ,   0.      ],
             ...,
             [  0.      ,   0.      ,   0.      , ...,   0.      ,
                0.      ,   0.      ],
             [  0.      ,   0.      ,   0.      , ...,   0.      ,
                0.      ,   0.      ],
             [  0.      ,   0.      ,   0.      , ...,   0.      ,
                0.      ,   0.      ]]]], dtype=float32)]
    Iteration 2, Elapsed Time: 1.4222159385681152
    minimum execution time is 1422.216 ms
    Total time to run 2 iterations was 2.8449 s
    (75.252855, 74.68371, 0.0, 0.0)
    {'ts:run_start': 219800239275, 'ts:run_end': 221218953690, 'ddr:read_start': 0, 'ddr:read_end': 0, 'ddr:write_start': 0, 'ddr:write_end': 0, 'ts:subgraph_input.332add_output_copy_in_start': 219800538410, 'ts:subgraph_input.332add_output_copy_in_end': 219803163280, 'ts:subgraph_input.332add_output_proc_start': 219803163540, 'ts:subgraph_input.332add_output_proc_end': 219877847250, 'ts:subgraph_input.332add_output_copy_out_start': 219877848725, 'ts:subgraph_input.332add_output_copy_out_end': 221218685415}
    

  • Hi Pragya,

    Hmm, these results are interesting. I do see in your script_with_acc.txt that the results are indeed the same each time, even if the input is changing. The model_speed_test.py script shows same output, but this is for the same input. 

    Do you find that the model fails to initialize/run during the tests at this point?

    What I'm noticing in the output is that is one of two values: 0 or 7.7566  --  that's strange to me. I wonder if this issue is somehow related to clipping from the quantization values. I notice that the outputs for the network from the model_speed_test.py script are quite high as well. Further, I notice that all the output values are evenly divisible by 7.7566. I imagine this is not right, since the CPU / non-acc version had many low-value floating point numbers. 

    I think we should look at the quantization of the model at this stage:

    1) Try recompiling the model with "tensor_bits" set to 16 (passed as part of the delegate options). This will impact performance, but we can use a hybrid of 9 and 16-bit quantization to optimize the accuracy vs. performance tradeoff

    2) Consider the calibration images and number of iterations. What is the setting for these? If not set as part of your model config, then the default values are within common_utils.py (calibration_iterations, calibration_frames).

    • You should use images from the training or validation set here if you aren't already. The default images may be resulting in poor quantization parameters when applied to your use case (quick search of patchcore suggests defect detection, so very different from scenes in automative and classifier info)

    BR,
    Reese

  • Hello, 

    1. I tried recompiling the model with tensor_bits set to 16
    2. calibration images are set to 2 and iterations to 5(default) 
    3. I used images from my training data in the compilation script. 

    Even after doing all this, the result is the same :( 

  • Hi Pragya,

    1. I tried recompiling the model with tensor_bits set to 16

    Did the performance change noticeably, and did the outputs still look identical (multiples of this 7.7566 value)? I'm surprised the issue persisted after this, and I want to be sure the setting applied correctly. The SVG files with the artifacts/tempDir directory would be helpful for me to look at too.

    edit: One more thing popped up in my mind as it relates to preprocessing.

    You have preprocesing values of 0.485, 0.456 and 0.406 for the mean, which gets subtracted from the input. I recall these values as being the traditional means in pytorch for imagenet classification models (and by extension, most other models that start from such a feature extractor / spine). In pytorch, I believe the inputs are normalized to [0,1] first.

    In our preprocessing with edgeai-tidl-tools, we read images as uint8, so the starting distribution is between 0 and 255. If I look at the mean in some of our model_configs, multiplying those pytorch values by 255 results in the 'mean' values part of the model configs. Similarly, dividing the scales from your model by 255 results in scale values very close to some of our other models. 

    • pytorch transforms for imagenet: https://github.com/pytorch/examples/blob/cdef4d43fb1a2c6c4349daa5080e4e8731c34569/imagenet/main.py#L236
      • the means make sense to me
      • The std/scales in pytroch don't map so well (0.229 vs. our 0.017125). However, your scales do have some linear relation to the others in our model configs (4.366 / 255 = 0.017) 
      • The actual transform code will subtract mean and divide that by the std
        • we subtract mean and multiply by the scale, so the std value should be inverted. That's what looks like you've done

    This may be coincidental, but seems suspicious enough to mention. Subtracting a mean of 0.45 and dividing by 4.4 doesn't seem like an intentional choice w.r.t. the resulting distribution. This concept is something we don't have well documented, and I realize that would be a source of confusion (noted in my docs backlog now). I suggest revisiting these parameters on your side. I would suggest multiplying your mean values by 255 and dividing your scales (1/std) by 255. Modify those and recompile -- they will have a first order effect on the quantization of the model. 

    BR,
    Reese

  • Hello Reese, 

    I tried your suggestions and used this as my model config : 

    'cl-ort-patchcore' : { 'model_path' : os.path.join(models_base_path,
    'patchcore_model_buffered.onnx'),
    'mean': [123.675, 116.28, 103,53],
    'scale' : [0.017125, 0.017507, 0.017429],
    'num_images' : 2,
    'num_classes': 2,
    'session_name' : 'onnxrt' ,
    'model_type': 'classification' }

    While this helped a little, because now the model outputs and scores are being updated. The score values are too high and the heatmap isn't changing still.
    I feel the output values beings generated are still not entirely correct. 
    I am assuming I am still supposed to use these values in my inference script  : 

    mean=[0.485, 0.456, 0.406], std=[0.229, 0.224, 0.225]


    I have attached the log file using these new artifacts and the link to the new artifacts : drive.google.com/.../1hNAvUqlz3-oJ4WNqRDZebvilGTG3Rf5w

    8400.script_with_acc.txt


    edit: I had forgotten that I had changed the tensor_bits to 16 which is probably what was causing the score values being too high and heatmap still incorrect. I now changed it back to tensor_bits 8 and now everything is working as expected. So, in conclusion setting the correct mean, std and tensor_bits values solved the problem. Thank you so much for all your help :) 

  • Hi Pragya,

    Great, I'm glad to hear that this was the solution.

    I think our documentation would be aided by a note about these preprocessing parameters, how they are applied, and what types of common values are used (e.g. these are straight from pytorch, but that is not obvious). The edgeai-tidl-tools/docs/custom_model_evaluation.md page is where that information should go. 

    You're welcome for the help!

    BR,
    -Reese