This thread has been locked.

If you have a related question, please click the "Ask a related question" button in the top right corner. The newly created question will be automatically linked to this question.

TDA4VM: HWA performance issue

Part Number: TDA4VM

Tool/software:

Hi, 

[Question]
Has TI sdk encountered any time-out issues with VPAC(TIVX_TARGET_VPAC_MSC1) before, and what's the reason and any solutions?

[background]

Here is an issue that ADAS function(NOA) had exit by accident, reported by the customer.

According to log analysis, the image processing model of scaler had timed out, detail:
After A72 sent an image processing command(to adjusting front-camera image size for TIDL model) to VPAC (TIVX_TARGET_VPAC_MSC1), VPAC did not return the result within 150ms, but delayed about 250ms
After a few minutes, another time-out occurred... and it had happened multiple times within an hour then never happened.
By our design, When time-out occurs, the perception module will report a failure and the ADAS function has to exit.

At present, it cannot be reproduced as VPAC always responded in a short time(<50ms), but we are not sure whether it will happen again since a large number of vehicle released in the market.

Ti sdk version is 8.2. 

task load: ( was from the car of customer, the statistics data output per 30 seconds, here just provide  one segment  for example)

----------------

HWA performance statistics,
===========================

HWA: VISS: LOAD = 53.19 % ( 311 MP/s )
HWA: LDC : LOAD = 41.58 % ( 161 MP/s )
HWA: MSC0: LOAD = 52.98 % ( 232 MP/s )
HWA: MSC1: LOAD = 14.81 % ( 12 MP/s )
HWA: DOF : LOAD = 11.79 % ( 12 MP/s )


DDR performance statistics,
===========================

DDR: READ BW: AVG = 4519 MB/s, PEAK = 11811 MB/s
DDR: WRITE BW: AVG = 2895 MB/s, PEAK = 9062 MB/s
DDR: TOTAL BW: AVG = 7414 MB/s, PEAK = 20873 MB/s


Detailed CPU performance/memory statistics,
===========================================

PERF STATS: ERROR: Invalid command (cmd = 00000003, prm_size = 388 B
CPU: mcu2_0: TASK: IPC_RX: 1.53 %
CPU: mcu2_0: TASK: REMOTE_SRV: 2.82 %
CPU: mcu2_0: TASK: LOAD_TEST: 0. 0 %
CPU: mcu2_0: TASK: TIVX_CPU_0: 7.34 %
CPU: mcu2_0: TASK: TIVX_NF: 0. 0 %
CPU: mcu2_0: TASK: TIVX_LDC1: 5.88 %
CPU: mcu2_0: TASK: TIVX_MSC1: 8.45 %
CPU: mcu2_0: TASK: TIVX_MSC2: 5. 7 %
CPU: mcu2_0: TASK: TIVX_VISS1: 18.94 %
CPU: mcu2_0: TASK: TIVX_CAPT1: 1.29 %
CPU: mcu2_0: TASK: TIVX_CAPT2: 1.41 %
CPU: mcu2_0: TASK: TIVX_DISP1: 0. 0 %
CPU: mcu2_0: TASK: TIVX_DISP2: 0. 0 %
CPU: mcu2_0: TASK: TIVX_CAPT3: 0. 0 %
CPU: mcu2_0: TASK: TIVX_CAPT4: 0. 0 %
CPU: mcu2_0: TASK: TIVX_CAPT5: 0. 0 %
CPU: mcu2_0: TASK: TIVX_CAPT6: 0. 0 %
CPU: mcu2_0: TASK: TIVX_CAPT7: 0. 0 %
CPU: mcu2_0: TASK: TIVX_CAPT8: 0. 0 %
CPU: mcu2_0: TASK: TIVX_DISP_M: 0. 0 %
CPU: mcu2_0: TASK: IPC_TEST_RX: 0. 0 %

CPU: mcu2_0: HEAP: DDR_SHARED_MEM: size = 16777216 B, free = 14971904 B ( 89 % unused)
CPU: mcu2_0: HEAP: L3_MEM: size = 262144 B, free = 178688 B ( 68 % unused)

--------------

  • Hi,

    no, we have not seen such timeout issue in Scalar. Scalar should not such large time in processing. Are you running anything else on the R5F core, which probably does not allow running MSC task? This could be one reason why MSC task is not getting scheduled and why it is taking time in processing the frame. 

    Regards,

    Brijesh

  • Hi,thank you for reply timely.

    > Are you running anything else on the R5F core

    Yes, there are several tasks running such as camera data capturing,ldc and viss and ethernet driver

    if it is related with task  scheduling, the load of the tasks may be abnormal.

    We have checked the load of them, including MSC1, the load data is normal value when it happened.

    for example: compared the load data of timeout with the one of not timeout. The difference is too small.

    How about IPC? Is there any performance issue already known at present?


  • additional information:

    The car which occurred timeout had a capture device for ethernet data, it didn't connect to TDA4 directly but OBD,  and the device  captured the ethernet data that TDA4 output. And the ethernet driver running on r5f.  Does the capture influence on the scaler?

  • How about IPC? Is there any performance issue already known at present?

    No, IPC is another higher priority task, so will not be blocked due to other tasks. 

    Do you have detailed performance statistics when the issue comes? also any logs available from mcu2_0? 

    Also which SDK release are you using? 

    Regards,

    Brijesh

  • Hi, 

    SDK release version: SDK8.2

    > Do you have detailed performance statistics when the issue comes? also any logs available from mcu2_0? 

    We have done it but hard to show it since we haven't an accurate measurement of performance in a release version and did not find any obvious helpful clue including mcu2_0 log

    please reference:

    comment.xlsx: it helps to understand the original problem and get the date time while it happened. 

    mcu_log_46_2024_0904_072312.log: MCU2_0 log is in it, I am not sure if have any available information 

    sys_log_38_2024_0904_072319.log: the original task load data with date time (keyword: taskload, the  log content is redirected from vx_app_task_load.out  of SDK)

    Note: the log of task load output per 30 seconds. That means load value may be an average value in 30 seconds period, not so accurate.

    noa_failed_tidl_often_timeout.zipcomment.xlsx

  • Hi,

    Would you have any other idea about the issue or some suggestion?
    If it might be a scheduling problem. What's the action for us to prove it.
    We have no idea to find an efficient way since it happened with a low incidence.

    We also may focus on checking health status of the scheduling when app tasks runs.
    Are there any systematic check tools or methods from TI? As we know:
    vx_app_arm_remote_log.out: which can output RTOS log via shared memory.
    vx_app_task_print.out: which can output the load of tasks or other statistics.

    Both of them work well, but difficult to trace scheduling problem.
    We may add statistics log to trace the time consumption of tasks and interrupts,
    but it is not efficient or involve performance issue by itself.

  • We have done it but hard to show it since we haven't an accurate measurement of performance in a release version and did not find any obvious helpful clue including mcu2_0 log

    The performance stats reports max/min and average performance numbers. So from this, we can determine if the MSC tool more than expected time once in a while. 

    In the comments.xls file, i see you have printed the MSC load, but can you also include MSC's performance at different instances? This will help to determine if this is really related to MSC. 

    Do you see any other error from MSC? Can you also check what's the value of VHWA_M2M_MSC_MAX_WAIT_LOOP_CNT macro in the VHWA driver? Since it is old release, it might be set to less value and might be timing out. 

    In order to check the scheduling issue, is it possible to first see if we can reproduce the issue consistently? Also is it possible to get detailed performance statistics? Also how much time it takes to reproduce this issue?  

    Regards,

    Brijesh

  • Hi,

    >In the comments.xls file, i see you have printed the MSC load, but can you also >include MSC's performance at different instances? This will help to determine if this is >really related to MSC. 

    -> We have compared the load with normal ones, no much difference of MSC itself.
    But from our log, we have found some other abnormal things.
    The frame rate of TIDL model(by C71) and pyramid(by C66) was down a little bit in the period which the scaler timeout had happened in.
    The frame rate are calculated by A72, based on the response time from C71 or C66 including cores IPC communication.

    >Do you see any other error from MSC? Can you also check what's the value of >VHWA_M2M_MSC_MAX_WAIT_LOOP_CNT macro in the VHWA driver?

    ->Thanks, we will trace VHWA_M2M_MSC_MAX_WAIT_LOOP_CNT later. We have found no errors from MSC.


    >In order to check the scheduling issue, is it possible to first see if we can reproduce the issue consistently?


    -> It is very hard to reproduce, It has not happened yet in several weeks.
    We will try to reproduce it by more cars and collect more output log data including the system running situation and try to figure out the precondition for reproducing it with 100% percent.

  • Hi Frank,

    The frame rate of TIDL model(by C71) and pyramid(by C66) was down a little bit in the period which the scaler timeout had happened in.
    The frame rate are calculated by A72, based on the response time from C71 or C66 including cores IPC communication.

    this is strange, this should not have affected MSC, unless they are using high DDR BW and delaying MSC read/write operations. But again delaying by 150ms or even 250ms seems very high in this case. It is not DDR BW issue, and core loading is also in control, then probably some scheduling issue on mcu2_0. If you have something high priority task taking longer time, then it can affect MSC (and probably other tasks) performance also. 

    Regards,

    Brijesh

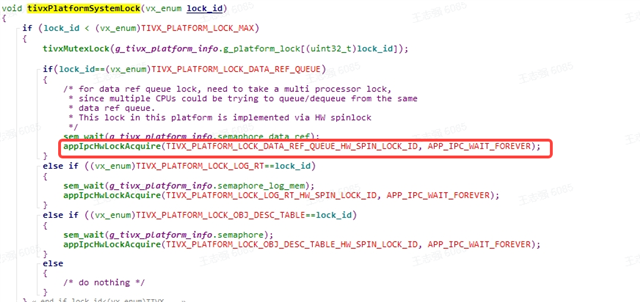
  • I have confirmed the communication between A72 and R5f are using spinlock in TIOVX, and it seems the side of A72 has not disabled all interrupts before acquire spin lock. Is it possible that scheduling of A72 occurs while A72 is holding the spin lock and  cannot release the spin lock in time, in which period R5f is just spinning, no any scheduling?

    Please see the picture below(a internal abstracted spin lock interface for all cores,  SDK8.2). Interrupts is not disabled.  I may misunderstand something as I could not understand TIOVX well.

  • Hi Frank,

    Yes, that's possible. but do you have other high priority tasks running on A72 Linux? 

    Btw, its not possible to disable interrupts from user application on Linux. 

    Regards,

    Brijesh