Part Number: TDA4VH-Q1
Other Parts Discussed in Thread: TDA4VH
Tool/software:
Hello,
I am responsible for preparing tests for the new project bring-up.
The goal is to use "low hanging fruit" to detect as many issues as possible at the earliest stage.
Since Linux is already operational, many of the tests use it.
I am currently testing the idea of using the Error Signaling Module (ESM) for detecting the another potential issues.
During preparation, I issued the following commands:
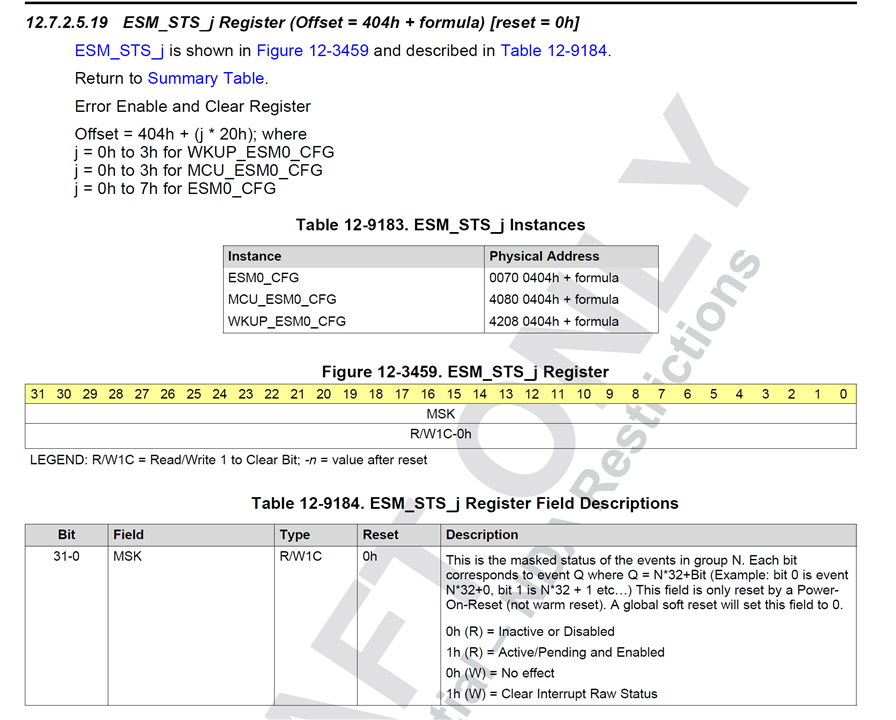
devmem2 0x00700420 w
devmem2 0x00700424 w 0xFFFFFFFF
devmem2 0x00700420 w
and I got an unexpected result:
# devmem2 0x00700420 w
/dev/mem opened.
Memory mapped at address 0xffffa1df3000.
Read at address 0x00700420 (0xffffa1df3420): 0x00000024
# devmem2 0x00700424 w 0xFFFFFFFF
/dev/mem opened.
Memory mapped at address 0xffffa3c8e000.
Read at address 0x00700424 (0xffffa3c8e424): 0x00000000
Write at address 0x00700424 (0xffffa3c8e424): 0xFFFFFFFF, readback 0xFFFFFFFF
# devmem2 0x00700420 w
/dev/mem opened.
Memory mapped at address 0xffff83c21000.
Read at address 0x00700420 (0xffff83c21420): 0x00000024
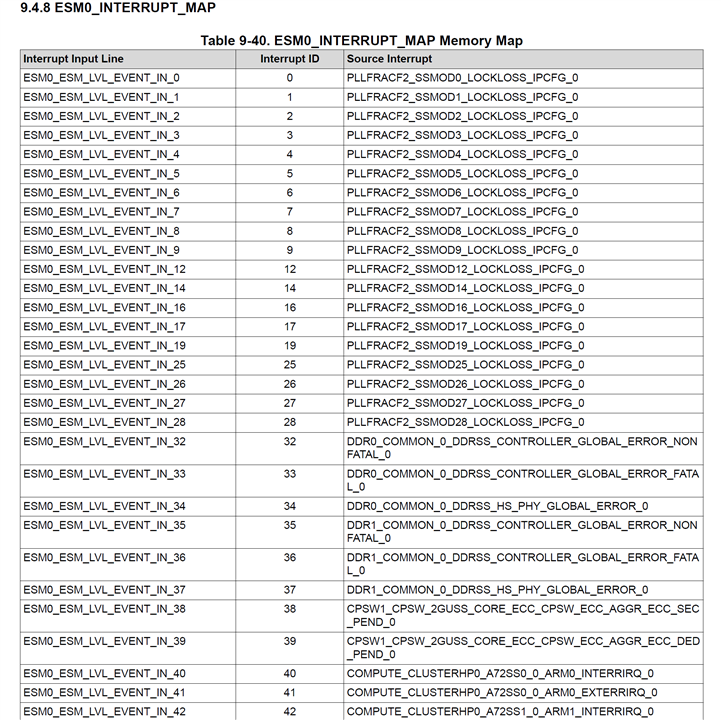
- Do I understand correctly that ESM0 reports permanent events (issues) number 34 and 37?
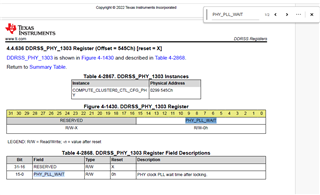
- Do I understand correctly that these events (34 and 37) means DR0_DDRSS_HS_PHY_GLOBAL_ERROR_OUT_0 and DDR1_DDRSS_HS_PHY_GLOBAL_ERROR_OUT_0?
- What can be the root cause for these events?
- Can you please give me some suggestions on where to begin investigating?
Thanks in advance.
Pawel