Tool/software:
The current Linux SDK documentation gives an example of setting up Enhancements for Scheduled Traffic (EST).
However, the example is complicated to understand and analyze.
Is there a simpler way to test EST and analyze the results?
This thread has been locked.
If you have a related question, please click the "Ask a related question" button in the top right corner. The newly created question will be automatically linked to this question.
Tool/software:
The current Linux SDK documentation gives an example of setting up Enhancements for Scheduled Traffic (EST).
However, the example is complicated to understand and analyze.
Is there a simpler way to test EST and analyze the results?
Steps to setup a simple example of EST/TAS in Linux
1. Configure EST Schedule
In this simple example, we will setup two traffic classes (TC) with the goal of a 1 millisecond cycle time. The line rate needs to be at 1Gbps for this example.
This configuration means that TC1 is limited to 20Mbps and TC0 is limited to 980Mbps.
The below script gives an example of how to set up the above schedule.
est_2_queue_ex.sh
#Must bring down all connected interfaces to modify interface properties ip link set dev eth0 down ip link set dev eth1 down sleep 2 #Configure 8 TX queues for eth0 ethtool -L eth0 tx 8 #Show current eth0 properties ethtool -l eth0 #Driver doesn't enable EST in round-robin mode, by default this is off ethtool --set-priv-flags eth0 p0-rx-ptype-rrobin off #Show current round-robin settings for eth0 ethtool --show-priv-flags eth0 #Bring all connected interfaces up ip link set dev eth0 up ip link set dev eth1 up sleep 3 #Sets up the EST schedule to map all 8 HW TX Queues tc qdisc replace dev eth0 parent root handle 100 taprio num_tc 8 map 0 1 2 3 4 5 6 7 0 0 0 0 0 0 0 0 queues 1@0 1@1 1@2 1@3 1@4 1@5 1@6 1@7 base-time 0000 sched-entry S 2 20000 sched-entry S 1 980000 flags 2 #sched-entry S 2 --> 5002 --> priority/queue 1 #sched-entry S 1 --> 5001 --> priority/queue 0 #Q7 is the highest priority Queue and Q0 is the lowest priority #To enable the classifier tc qdisc add dev eth0 clsact #Show current EST schedule tc qdisc show dev eth0 #To configure the skb priority to deliver frames to specific hardware queues? tc filter add dev eth0 egress protocol ip prio 1 u32 match ip dport 5002 0xffff action skbedit priority 1 tc filter add dev eth0 egress protocol ip prio 1 u32 match ip dport 5001 0xffff action skbedit priority 0 #Show filters applied to packets leaving the eth0 interface tc filter show dev eth0 egress
----------------------------------------------------------------------------------------------------------------------------------------------------------------------------------------------------------------
2. Select a Packet Generator
There are several different Linux-based packet generators, each with it's pros and cons when used for an EST example.
To make analyzing the results of an EST example easier, choose a packet generator that allows the user to specify a specific interval between each packet that is sent.
Below is a list of some Linux-based packet generators and the pros and cons when used in an EST example.
Packet Generator | Pros | Cons |
iperf3 | Already included in TI Processor SDK Linux | Doesn't allow user to specify packet transmission interval |
hping3 | Allows user to specify packet transmission interval |
Not included in TI Processor SDK Linux Must be built and included separately OR must be installed via "sudo apt install hping3" on a TI Debian SDK |
nping | Allows user to specify packet transmission interval |
Not included in TI Processor SDK Linux Must be built and included separately OR must be installed via "sudo apt install hping3" on a TI Debian SDK |
pktgen |
Linux Kernel-based packet generator tool, so just need to enable CONFIG_NET_PKTGEN in the Kernel configuration Can be used to send packets at specific intervals or in bursts Sends large volume of packets at high speeds |
Packets sent by pktgen are labeled as "PKTGEN" packets rather than UDP or TCP packets Need to figure out correct EST configuration to control PKTGEN packets |
For simplicity and easy access, we will use two instances of iperf3 clients to simulate the below
To determine the correct iperf3 client configuration to simulate TC1:
Pick a frame size smaller than the Maximum Transmission Unit (MTU) size, excluding the header bytes (something less than 1472 bytes) |
1 frame = 1400 bytes |
Calculate the bandwidth with selected frame size |
1 frame/ms = 1400 bytes/ms = 11200 bits/ms = 1200000 bits/sec = 11.2 Mbits/sec --> round to 12Mbps |
Check that the calculated bandwidth is not exceeding the 20Mbps |
12Mbps < 20Mbps |
Choose duration of packet generation |
3 seconds |
TC1: iperf3 -c <ip address> -u -b12M -p 5002 -l1400 -t3&
TC0: iperf3 -c <ip address> -p 5001 -t3&
----------------------------------------------------------------------------------------------------------------------------------------------------------------------------------------------------------------
3. Hardware Setup and Commands to Run
First, set up two devices (e.g. AM64x EVMs) connected via one Ethernet cable.
DUT1 <----> DUT2
Second, run the est_2_queue_ex.sh script to set up the EST schedule on DUT1.
./est_2_queue_ex.sh
Third, setup iperf3 servers on DUT2.
iperf3 -s -p5001 &
iperf3 -s -p5002 &
Finally, run the iperf3 clients on DUT1.
root@am64xx-evm:~# cat iperf_est.sh
ipaddr=$1
if [ "$#" != "1" ]
then
echo "$0 <ipaddr>"
exit
fi
iperf3 -c $ipaddr -u -b12M -p 5002 -l1400 -t3&
iperf3 -c $ipaddr -p 5001 -t3&
root@am64xx-evm:~# sh iperf_est.sh 192.168.1.11
How to Analyze EST/TAS Results
1. Default Configuration
A. Using an Ethernet tapping tool such as Wireshark, capture the packets sent from DUT1 to DUT2. Use a Profishark device for more accurate timing results.
The "default configuration" here refers to the configuration steps in the first part of this FAQ.
B. Once the packets are captured, filter them to just the TC1 packets which are the UDP packets sent to port 5002. (i.e. "udp.dstport==5002" in Wireshark).
C. Show the time as "Seconds Since Previous Displayed Packet" in Wireshark (i.e. "View"->"Time Display Format")
D. Export the pcap file as a csv file and open with Excel (or LibreCalc when on a Linux PC)
E. Create a histogram based on time (interval) in Excel
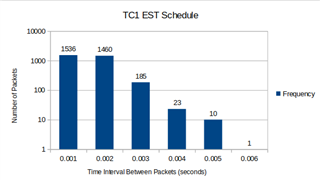
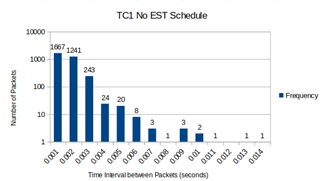
The histogram on the left shows the time interval between each TC1 packet under EST scheduling. The histogram on the right shows the time interval between each TC1 packet without EST scheduling.
Under the EST schedule, we expect to see the majority of TC1 packets to have a time interval <= 0.001 seconds (1ms) between each packet since that is the cycle time we configured the EST for.
However, as can be seen in the left histogram, there are still many packets are >0.001 seconds. This could be attributed to the fact that iperf3 is not a packet generator that can control the interval that each packet gets sent. Instead, it sends packets in bursts that adhere to the bandwidth, packet size, and line rate that was configured. This means that there could be chances that no TC1 packets get sent within a 1ms cycle time (as long as overall the 12Mbps and 1400 bytes on a1Gbps was satisfied).
Using another packet generator that allows for control of the time interval each packet gets sent out might show better results.
2. Optimized Configuration (to see better results)
As explained in "Default Configuration", the main issue is with iperf3 not being the best packet generator tool to use for testing and analyzing the EST schedule.
In order to improve the timing interval, make the following changes
DUT1 commands
root@am64xx-evm:~# phc2sys -a -r -transportSpecific=1 & root@am64xx-evm:~# cat iperf_est.sh #iperf3 -c 172.168.1.1 -u -b900M -p 5001 -l1472 -t10 & ipaddr=$1 if [ "$#" != "1" ] then echo "$0 <ipaddr>" exit fi chrt -f 60 iperf3 -c $ipaddr -u -b20M -p 5002 -l1400 -t3& chrt -f 60 iperf3 -c $ipaddr -p 5001 -t3& root@am64xx-evm:~# sh iperf_est.sh 192.168.1.11
DUT2 commands
phc2sys -a -r -transportSpecific=1 & iperf3 -s -p5001& chrt -f 60 iperf3 -s -p5002&
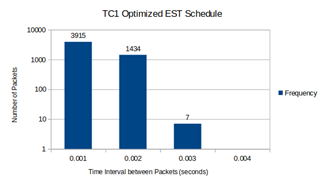
With the above three changes, the time interval of each TC1 packet is closer to within 0.001 seconds. However, since there are still many TC1 packets >0.001 seconds, this indicates that using iperf3 is still not the best tool to test the effects of an EST schedule.
It may be worth trying other packet generator tools or directly run the EST schedule on the target traffic and use the steps here to analyze the effects of the EST schedule.
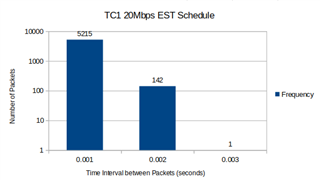
Note: Below is a histogram of only changing the iperf3 bandwidth to 20Mbps. Increasing the iperf3 bandwidth of TC2 helps achieve better results to analyze the EST schedule.