TDA4VEN-Q1: capture Node frame loss issue

Part Number: TDA4VEN-Q1

Tool/software:

Hi,Ti,

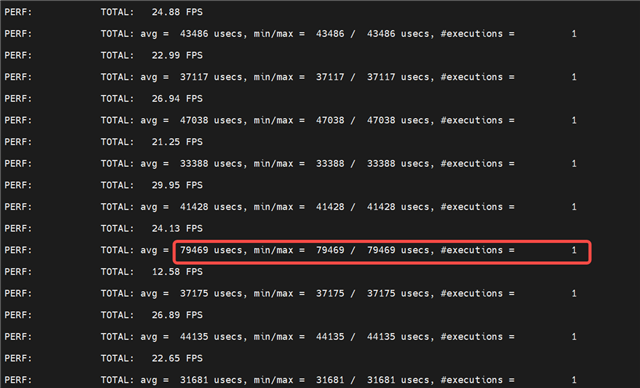
We have encountered a frame loss issue in capture Node, please help to analyze it.

1、The normal execution time for capture Node is as follows:

2、When the TIDL-related application was running, the execution time of the capture Node became unstable, as follows:

Regards,

jc

  • Hi Jc,

    Which SDK release are you using? Can you please check this in SDK10.1 release? 

    Regards,

    Brijesh

  • Hi,Brijesh;

    Which SDK release are you using? Can you please check this in SDK10.1 release? 

    We are using sdk10.0.

    This does not seem to be related to sdk version, it seems to be a resource contention issue, we want to increase the priority of csirx or mcu2_0, is it possible ?

    Regards,

    jc

  • Hi jc,

    Can you try changing one parameter in CSIRX driver? Instead of using bus order id of 8 in the Csirx_chCfgInit in the file ti-processor-sdk-rtos-j722s-evm-10_00_00_05\mcu_plus_sdk_j722s_10_00_00_25\source\drivers\csirx\v1\csirx.h, can you change this value to 15 and see if it helps? 

    Regards,

    Brijesh

  • Hi,Brijesh,

    Can you try changing one parameter in CSIRX driver? Instead of using bus order id of 8 in the Csirx_chCfgInit in the file ti-processor-sdk-rtos-j722s-evm-10_00_00_05\mcu_plus_sdk_j722s_10_00_00_25\source\drivers\csirx\v1\csirx.h, can you change this value to 15 and see if it helps? 

    After we changed the value of bus order id to 15, the frame loss problem did not seem to improve.

    Are there any other things you could try, such as increasing the qos priority of mcu2_0 or csirx ?

    Regards,

    jc

  • Hi jc,

    We already increased the priority of the CSIRX. 

    One question, please confirm that you are not seeing any frame receive error like "CAPTURE: ERROR: Incomplete Frame for Ch0/1/2/3" and also you are not seeing any overflow in capture statistics.. 

    If you are not, then we can try increasing priority for r5f and see if it helps.

    Regards,

    Brijesh

  • Hi,Brijesh,

    One question, please confirm that you are not seeing any frame receive error like "CAPTURE: ERROR: Incomplete Frame for Ch0/1/2/3" and also you are not seeing any overflow in capture statistics.. 

    No, I don't see this error.

    If you are not, then we can try increasing priority for r5f and see if it helps.

    Ok, so how do you increase the priority of the r5f core ?

    Regards,

    jc

  • Hi jc,

    Which bootflow are you using? Is it SPL bootflow or SBL? 

    In SDK10.1, we have added support for setting QoS settings in SPL bootflow. We would just need to add R5F QoS here. 

    Regards,

    Brijesh 

  • Hi,Brijesh,

    Which bootflow are you using? Is it SPL bootflow or SBL? 

    In SDK10.1, we have added support for setting QoS settings in SPL bootflow. We would just need to add R5F QoS here. 

    We used sdk10.0, SBL boot.

    Regards,

    jc

  • Hi jc,

    ok thanks for sharing this details, i will work on enabling qos in SBL and share you changes on SDK10.0. 

    Regards,

    Brijesh

  • Hello jc,

    Can you please apply attached patch on mcu+ sdk, essentially on ti-processor-sdk-rtos-j722s-evm-10_00_00_05\mcu_plus_sdk_j722s_10_00_00_25, rebuild SBL and see if it helps in getting better performance on Main R5F? 

    Regards,

    Brijesh

  • Hi,Brijesh,

    Can you please apply attached patch on mcu+ sdk, essentially on ti-processor-sdk-rtos-j722s-evm-10_00_00_05\mcu_plus_sdk_j722s_10_00_00_25, rebuild SBL and see if it helps in getting better performance on Main R5F? 

    ok,Where can I get this patch file ?

    Regards,

    jc

  • Hi,Brijesh,

    I tried your patch but it doesn't seem to improve.

    Regards,

    jc

  • Hi jc,

    When you say capture cost time in the print, what does it mean? How are you getting this time and printing it from OpenVX? Can you please print the OpenVX stats and see if capture is running fine? 

    Regards,

    Brijesh

  • Hi,Brijesh,

    When you say capture cost time in the print, what does it mean? How are you getting this time and printing it from OpenVX? Can you please print the OpenVX stats and see if capture is running fine? 

    Record a timestamp at the beginning and end of the tivxCaptureProcess function.

    For example:

    tivxCaptureProcess()

    {

        time_start = tivxPlatformGetTimeInUsecs(); //At the front

        ....

        time_end = tivxPlatformGetTimeInUsecs(); //At the back

        printf(%s cost time: %llu \n", __func__, (time_end-time_start/1000));

    }

    Regards,

    jc

  • Hi jc,

    But instead of measuring the time of tivxCaptureProcess API, can you please measure the time period between two dequeue calls? Typically application uses capture output as graph parameter and does the operation like enqueue and dequeue of the parameter. Can you please check if the time remains consistent between two dequeues? 

    Regards,

    Brijesh

  • Hi,Brijesh,

    But instead of measuring the time of tivxCaptureProcess API, can you please measure the time period between two dequeue calls? Typically application uses capture output as graph parameter and does the operation like enqueue and dequeue of the parameter. Can you please check if the time remains consistent between two dequeues? 

    The timestamp is recorded before and after the dequeue function call, which is also unstable and has a large jitter.

    For example:

    time_start = tivxPlatformGetTimeInUsecs(); 

    vxGraphParameterDequeueDoneRef(); //capture buffer

    time_end = tivxPlatformGetTimeInUsecs(); 

    printf(%s cost time: %llu \n", __func__, (time_end-time_start/1000));

    Regards

  • Hi jc,

    I really doubt this is still correct. Do you have perf_stats integrated in this application? Can you then please print TIOVX performance stats and share them? I would like to see performance stats of the capture node.

    Regards,

    Brijesh

  • Hi,Brijesh,

    The statistics are as follows:

    Regards,

    jc

  • Hi jc,

    But this seems to be graph performance, can you please get the complete statistics? This should include capture node's statistics. This will tell us if there is any error reported by the CSIRX or if there are any frame drops. 

    Essentially control command TIVX_CAPTURE_PRINT_STATISTICS in the Capture node prints the statistics on the console. So can you please call this control command when you see frame drops? 

    Regards,

    Brijesh

  • Hi,Brijesh,

    The detailed statistics are shown below:

    Regards,

    jc

  • Hi jc,

    As we can see from the statistics, there are no errors reported by the CSIRX, there is no overflow, no ECC or CRC errors, no spurious interrupts..

    But there are dropped frames, reported by the driver. This typically comes when something else is running slower in the pipeline and because of which it is not able to provide the buffers back to the CSIRX. That's when CSIRX will drop this frame.. 

    In the above prints, i see only LDC, which runs most of the time in real time, on the average, it is taking 26m. 

    Can you check the other components? See if any of them is taking more than 33ms consistently and their average performance time is more than 33. 

    Regards,

    Brijesh

  • Hi,Brijesh,

    Can you check the other components? See if any of them is taking more than 33ms consistently and their average performance time is more than 33. 

    This graph has only two nodes, capture+ldc, and should not be able to look at the average time alone, the issue is that the time jitter of each frame is large.

    The DDR bandwidth must exceed 6.5GB/s before frame loss occurs. What can be done to solve it.

    Regards,

    jc

  • Hi jc,

    Where is the output of LDC connected? Is it not connected to anywhere? Also how many buffers are allocated between capture and LDC node? I do see LDC node taking more than 33ms once in while, having slightly mode buffering between capture and LDC can potentially help in this case. 

    Regards,

    Brijesh

  • Hi,Brijesh,

    Where is the output of LDC connected? Is it not connected to anywhere? Also how many buffers are allocated between capture and LDC node? I do see LDC node taking more than 33ms once in while, having slightly mode buffering between capture and LDC can potentially help in this case. 

    Yes, the ldc node output does not connect any nodes;  it just shares the ldc buffer for use by other processes.

    The graph link is as follows:

    capture Node(3 3uffers) ——> LDC Node(6 buffers)

    I tried increasing the number of buffers, but it didn't improve the frame loss issue.

    The frame rate of the camera is 25 frames, after DDR bandwidth exceeds 6.5GB/s, frame loss occurs, and the average frame rate is in the range of 22-23 frames.

    Regards,

    jc

  • Hi jc,

    Have you tried increasing the buffer depth between capture and LDC? I see you are using 3 buffers between them, can you try increasing it by one and see if it helps? 

    Regards,

    Brijesh

  • Hi,Brijesh,

    After I tried adding a buffer, the issue of dropping frames improved, no drop frames.

    Regards,

    jc

  • Thanks jc, let us know if it full resolves the issue, we can close this thread then.