This thread has been locked.

If you have a related question, please click the "Ask a related question" button in the top right corner. The newly created question will be automatically linked to this question.

PROCESSOR-SDK-J784S4: DSS Init - Random Crashes at System Boot

Part Number: PROCESSOR-SDK-J784S4
Other Parts Discussed in Thread: J784S4XEVM

Tool/software:

Hello,

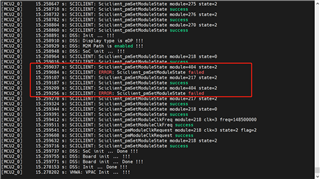
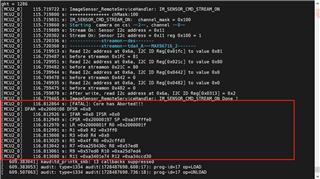
We're experiencing random DSS Init crashes at system boot (TI EVM TDA4H-J784 device):

[MCU2_0] 23.005084 s: DSS: Init ... !!!
...
[MCU2_0] 23.006342 s: [FATAL]: Core has Aborted!!!
[MCU2_0] DFAR =0x5050408 DFSR =0x808
[MCU2_0] 23.006381 s: IFAR =0x0 IFSR =0x0
[MCU2_0] 23.006401 s: CPSR =0x200f0197 SP =0xa3ffffe0
[MCU2_0] 23.006422 s: LR =0x200f003f R0 =0x200f003f
[MCU2_0] 23.006442 s: R1 =0x20 R2 =0x5050408
[MCU2_0] 23.006460 s: R3 =0x2a800000 R4 =0x4f40010
[MCU2_0] 23.006479 s: R5 =0x10001 R6 =0xa3885173
[MCU2_0] 23.006497 s: R7 =0xa39e7b68 R8 =0xa35e87a8
[MCU2_0] 23.006518 s: R9 =0xa35d2240 R10 =0x2
[MCU2_0] 23.006536 s: R11 =0xa39e7bbc R12 =0x277
...

I.e. the message "DSS: Init ... done !!!" is missing.

Attached to this message you will find the full log file - DSS_Init_Crash.log.

Thank you for your time!

Best regards,

Hristo

DSS_Init_Crash.log

  • Hi Hrishto,

    By any chance, is DSS enabled on any other Core, like on Linux? This is because i see some of the DSS APIs like SciClient settings are failing.. Probably that's why accessing DSS registers are causing crash. 

    Regards,

    Brijesh

  • Hi Brijesh,

    DSS is not enabled for other cores, like on Linux.

    To confirm this for sure, we build the TI official release without our modifications and the DSS behavior is the same.

    There are 3 cases of DSS behavior:

    1. Normal behaviour (see attached log file log_TI_module_217_success.txt)

    log_TI_module_217_success.txt

    2. No signal on display (see attached log file log_TI_module_217_failed.txt)

    log_TI_module_217_failed.txt

    3. DSS crash (see attached log file log_TI_FATAL.txt)

    log_TI_FATAL.txt

    BR,

    Dimitar

  • Hi Dmitar,

    But in the failing case, I see SciClient APIs are failing, Are you sure that mcu1_0 is running fine and is not crashed. 

    [MCU2_0] 23.116772 s: SCICLIENT: Sciclient_pmSetModuleState module=218 state=0
    [MCU2_0] 23.116826 s: SCICLIENT: Sciclient_pmSetModuleState success
    [MCU2_0] 23.116847 s: SCICLIENT: Sciclient_pmSetModuleState module=404 state=2
    [MCU2_0] 23.116893 s: SCICLIENT: ERROR: Sciclient_pmSetModuleState failed
    [MCU2_0] 23.116916 s: SCICLIENT: Sciclient_pmSetModuleState module=217 state=2
    [MCU2_0] 23.116960 s: SCICLIENT: ERROR: Sciclient_pmSetModuleState failed
    [MCU2_0] 23.116983 s: SCICLIENT: Sciclient_pmSetModuleState module=404 state=2
    [MCU2_0] 23.117027 s: SCICLIENT: ERROR: Sciclient_pmSetModuleState failed
    [MCU2_0] 23.117049 s: SCICLIENT: Sciclient_pmSetModuleState module=217 state=2
    [MCU2_0] 23.117093 s: SCICLIENT: ERROR: Sciclient_pmSetModuleState failed
    [MCU2_0] 23.117114 s: SCICLIENT: Sciclient_pmSetModuleState module=218 state=0
    [MCU2_0] 23.117159 s: SCICLIENT: Sciclient_pmSetModuleState success
    [MCU2_0] 23.117180 s: SCICLIENT: Sciclient_pmSetModuleClkFreq module=218 clk=3 freq=148500000
    [MCU2_0] 23.117271 s: SCICLIENT: Sciclient_pmSetModuleClkFreq success
    [MCU2_0] 23.117294 s: SCICLIENT: Sciclient_pmModuleClkRequest module=218 clk=3 state=2 flag=2
    [MCU2_0] 23.117357 s: SCICLIENT: Sciclient_pmModuleClkRequest success
    [MCU2_0] 23.117379 s: SCICLIENT: Sciclient_pmSetModuleState module=218 state=2
    [MCU2_0] 23.117472 s: SCICLIENT: Sciclient_pmSetModuleState success

    Regards,

    Brijesh

  • Hi Brijesh,

    This SciClient API always fails for all three cases above:

    [MCU2_0] 23.116847 s: SCICLIENT: Sciclient_pmSetModuleState module=404 state=2
    [MCU2_0] 23.116893 s: SCICLIENT: ERROR: Sciclient_pmSetModuleState failed

    A crash occurs when SciClient API for module 217 fails, but not always and when no   FATAL crash  for sure no signal on display:

    [MCU2_0] 23.117049 s: SCICLIENT: Sciclient_pmSetModuleState module=217 state=2
    [MCU2_0] 23.117093 s: SCICLIENT: ERROR: Sciclient_pmSetModuleState failed

    How do we check if that mcu1_0 is running fine and not crashed and what is the connection to DSS, whose init is on mcu2_0?

    As I wrote, this problem is observed on J784S4XEVM board with a TI PSDK ti-processor-sdk-rtos-j784s4-evm-10_01_00_04 without our SW modifications.

    Would you check what behavior of system(J784S4XEVM board with a TI PSDK ti-processor-sdk-rtos-j784s4-evm-10_01_00_04) on your side?

    BR,

    Dimitar

  • Sure Dimitar, but due to other priority issues, i will check in first week of April. 

  • Hi Dimitar,

    I think we are also seeing somewhat similar issue on the EVM, and are currently looking into it. 

    Regards,

    Brijesh

  • Hi Brijesh,

    Thanks for update!

    BR,

    Dimitar

  • Here is the jira id for the reference. 

    https://jira.itg.ti.com/browse/ADASVISION-6597

    Regards,

    Brijesh 

  • Hi Brijesh,

    I can't reach this page above.

    BR,

    Dimitar

  • Hi Dimitar,

    You will not be able to access this page, its just for the reference. 

    Regards,

    Brijesh

  • hi

    We also encountered this problem. Does TI have a corresponding solution at present?

    And we found that MCU20 would crash when the deserializer output image data to CSI.

  • hi Jin,

    In order to fix this issue, can you please disable mhdp node in Linux dtb file for vision apps and try with it, as shown below in arch/arm64/boot/dts/ti/k3-j784s4-vision-apps.dtso file? 

    &mhdp {
        status = "disabled";
    };

    Regards,

    Brijesh