Tool/software:
In my j784S4 EVM board, GTC clock is configured by CTRL_MMR0_CFG0::CFG0_GTC_CLKSEL as MAIN_PLL3_HSDIV1_CLKOUT:

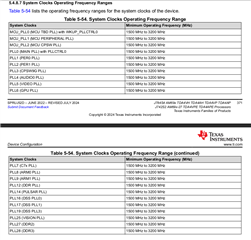
The MAIN_PLL3 clkout is 1GHz:
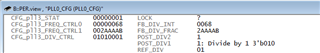
The HSDIV1 for MAIN_PLL3 is 7

So the GTC frequency is: 1GHz/(HSDIV1+1) = 125MHz
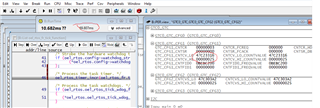
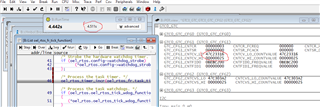
I use following spin_time function to spin some time basing on the GTC frequency:
void spin_time(u32_l20_t wait_time)
{
uint64_t ts_start;
uint64_t ts_curr;
uint32_t time_period;
uint64_t time_ran;
time_period = gtc_get_period(); /* Returns in Seconds left shifted by 40,
verified that period matching 125MHz */
ts_start = gtc_counter_get64();
do
{
ts_curr = gtc_counter_get64();
time_ran = ((uint64_t)(ts_curr - ts_start) * time_period) >> 20u;
}while (time_ran < ((uint64_t)wait_time));
return;
}
but I only get half of the spin time I setup. The time when I step from line 77 line 78, it expects to be 40ms, but I always get about half of the number it supposed to get
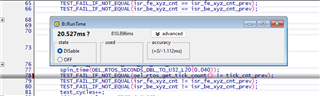
I have tested with different like 10ms 500ms, 1s, and always get about half of them spined.
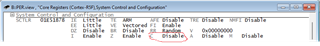
There is another issue that: even I set CNTCT.HDBG=1, gtc counter is supposed to freezing when I stop in debugger, but it keeps increasing
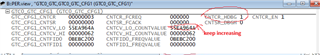
How can we stop the counter ticking during debugging ?