This thread has been locked.

If you have a related question, please click the "Ask a related question" button in the top right corner. The newly created question will be automatically linked to this question.

TDA4AL-Q1: Runtime debug and trace capability

Part Number: TDA4AL-Q1
Other Parts Discussed in Thread: TDA4VL, TDA4AEN-Q1,

Tool/software:

Hi TI Team,

Based on TDA4AL EVK, we have developed a custom hardware design.

This design has a 20 pin JTAG connection. We tried exploring runtime debug and data trace for running processes on the Linux kernel running on A72 cores. We were only able to use DAP with stop and go debug feature available with Lauterbach scripts. This is not feasible for our final application as more parallel processes would be running with even more data. Is there a way to establish on chip trace and debug with any internal buffers??

Is the post trace extraction capability available with this SoC (Similar to MCDS for almost real time variable updates in Lauterbach watch window).

Thanks,

S P Tejas

  • Hello,

    TDA4VL does supports run time collection of core trace and system statistics (with out the needs to stop).  Information can be collected at run time using DAP (over JTAG), via a off-chip trace bus (TPIU), or putting data out over a functional unit.  Lauterbach does fully support former two methods.  Up to 26 parallel data pins can be used to output into their 8GB receiver.  Its common to collect processor core trace (ARM-ETM from M4, R5, A72, and DSP-trace from C7) or system tracers (STM, cptracer-bus-stats, ctset and pmu micro-arch stats).   The TI EVM has a MIPI-60 connector which allows full export of the events at run time. A 20-pin connection ARM typically only carries JTAG (not trace signals) however some MIPI or TI 20 pin adaptors can care up to 4-bits parallel trace.   4 bits is not enough for fast processors, but with filtering it can give some useful information, and it can be OK for system trace.   Trace into internal buffers can be pulled out via DAP but its size might only old a few hundred micro-seconds of CPU trace where streaming to an external receiver can be in the minutes (or if usb3 streaming to a harddrive for a M or R core much more).  If offchip trace is critical for your usage, it would be recommended to use a MIPI-60 connector and use offchip parallel TRC pins in addition to the JTAG signals.

    Regards,
    Richard W.
  • Hi Richard, I have a few follow up questions,

    1) What are all the trace pins required to enable the aforementioned 4-bit parallel trace? if they are to be pulled

    2) Can we pull only some of the Trace pins e.g. TRC_CLK, TRC_CTL, and TRC_DATA0 to TRC_DATA5 in our custom hardware and use the Lauterbach's off chip trace solution with a custom connector and get actionable data? 

    3) I have heard the black hawk XDS110 on board debugger and XDS560v2 System trace emulator only supports single core debugging at a time, if that is so, then how effectively can we use it to debug/trace a process in TI Linux running on two Cortex-A cores? without missing data when the process switches to a different core other than the one we have attached to.

  • Hello,

    You need JTAG signals for control and standard debug and you need TRC signals (consecutive starting low #) for trace.  If you look at our MIPI-60 example you can use a subset (https://www.ti.com/lit/zip/sprr411).  Your example is correct for up to 6 bits (TRC, TRC_data0-trace5).  If you only wanted 4 it would require TRC_data0-TRC_data3.  the TRC_CTRL is option and is needed for older protocols.

    Yes, if you are using a Lauterbach receiver it can captured any size 1 to X.  As I understand the efficiency of the trace memory storage  usage is better with even sizes 4,8,16...  but odd sizes like 5 are possible if the extra bandwidth helps more then the size.   Not all vendor trace receiver hardware and software is so flexible. You should double check with the tool hardware vendor to ensure what you are doing will work.

    A small 'standard' header which does both jtag and trace for LB would be the MIPI-20T https://repo.lauterbach.com/pdfnew/app_arm_target_interface.pdf#Page=18 .  If you put this on your board it could do both jtag and trace without any additional adaptors.  To enable other 3rd party debuggers (other than LB, some adaptor might be needed)..   A header like TI'c cTI20 header https://repo.lauterbach.com/pdfnew/app_arm_target_interface.pdf#Page=67 will give jtag control, and some of the trace lines could be used to export trace, however, a custom hook up and adaptor would be needed to use it with tools.

    I believe its possible to do multi-core debug with xds class emulators. It might require some script linkages to debug complex multi-core senecios.  It has some native idea of groups which can look into.  How hard or how natural multi-core debug vs a usage senecio will vary depending on the tool.

    Regards,
    Richard W.
  • Hi Richard,

    Is WIR mode supported using this MIPI-20T trace connection?   i.e.  do we need EMU0 and EMU1 added to the connector to support WIR mode?

    Previously we needed WIR mode to boot a HS device when the primary boot loader was valid but non-functional and EMU0/EMU1 was needed.

    Reference
    e2e.ti.com/.../5523964

    Regards,

    Devin

  • Hello Devin,

    To get WIR mode with a MIPI-20T would require board DIP switches on EMU0/1.  On boards I have which don't have DIP switches (but have a cTI20) if I use a LB CombiProbe2 I switch from the MIPI-20T to a MIPI-34 as it has DBGREQ/DBGACK which in my next level adaptor maps to EMU0/1.

    Regards,
    Richard W.
  • Thank you.

    Also I presume this e2e discussion and the JTAG interfaces therein applies to the TDA4AEN-Q1 as well as the TDA4AL-Q1, correct?

  • Yes, both SOCs will have the same JTAG and trace hook up considerations.  However, the TDA4AL-Q1 can support more trace pins.

  • Hello Richard, do you have the information on TRACECLK speed of TDA4AL-Q1 and TDA4EN-Q1?

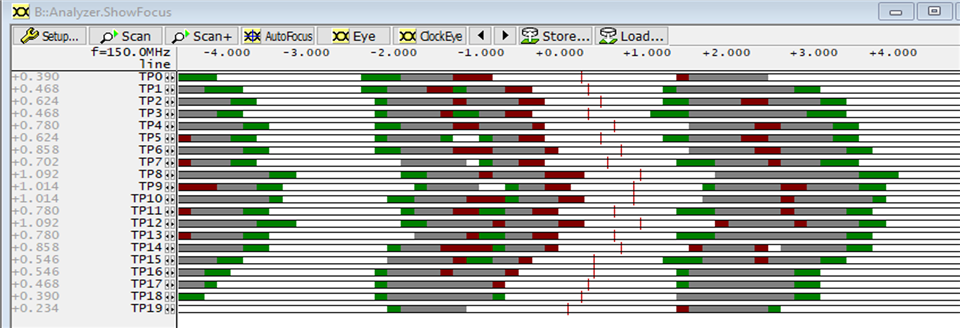
  • In my usage at room temperature I am running TDA4L's trace clock at 150MHz and TDA4VEN's trace clock at 166MHz.   This speed is higher then the data manual guarantees (which specifies a guarantee with worst cases across temperature and process).  If you target your layout to support that, you can get that or lower working.  The data is DDR in nature (using both edges) so BW estimates just 2x the clock x # of pins.   A smart trace receiver which does training and correction like LB provides is needed to work at the top speed.   I notice other more Cortex-M focused receivers only target a fraction of that speed.

    Here is an example solution used with TDA4L.  A per lane delay is used along with active termination to better center the signal to give a max eye.

    Regards,
    Richard W.